Unlock document.
This document is partially blurred.
Unlock all pages and 1 million more documents.
Get Access
CHAPTER 7: OPTIMAL RISKY PORTFOLIOS
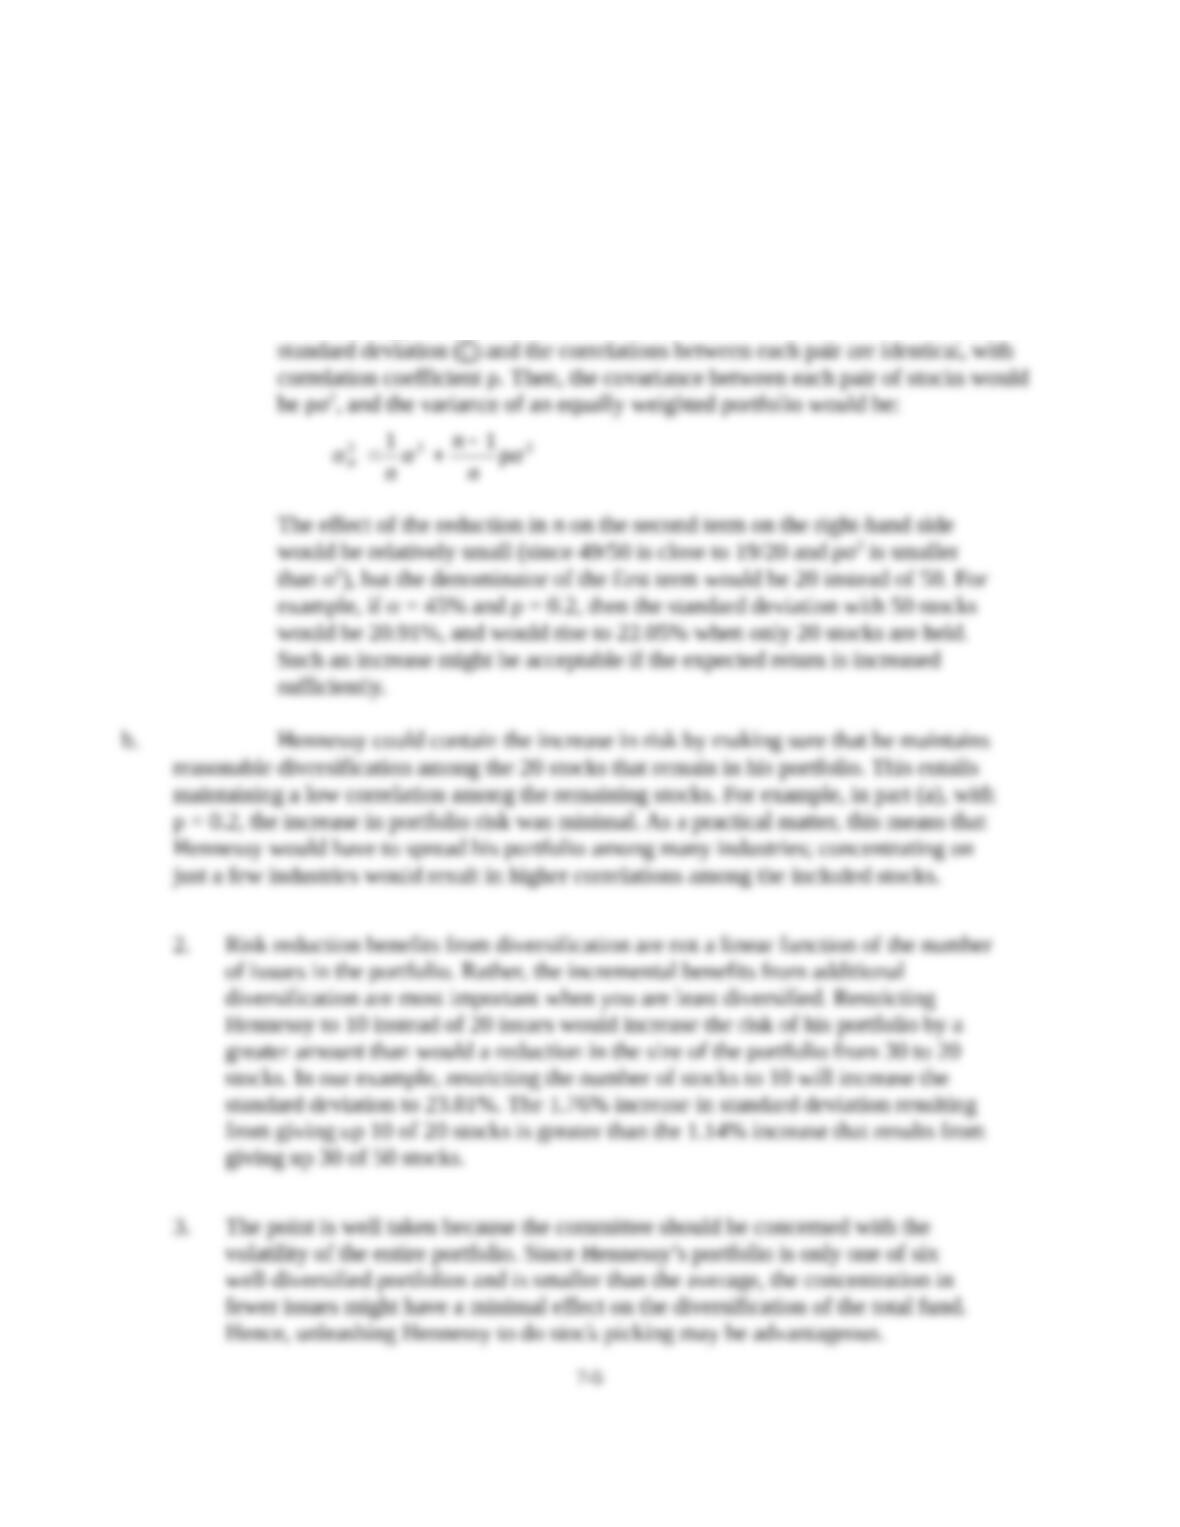
17. The correct choice is (c). Intuitively, we note that since all stocks have the same
More formally, we note that when all stocks have the same expected rate of return,
the optimal portfolio for any risk-averse investor is the global minimum variance
)(1)(
),(Cov2
),(Cov
)(
22
2
IwJw
rr
rr
Iw
MinMin
JIJI
JIJ
Min
Since all standard deviations are equal to 20%:
( , ) 400 and ( ) ( ) 0.5
I J I J Min Min
Cov r r w I w Jr s s r= = = =
This intuitive result is an implication of a property of any efficient frontier, namely,
that the covariances of the global minimum variance portfolio with all other assets
CHAPTER 7: OPTIMAL RISKY PORTFOLIOS
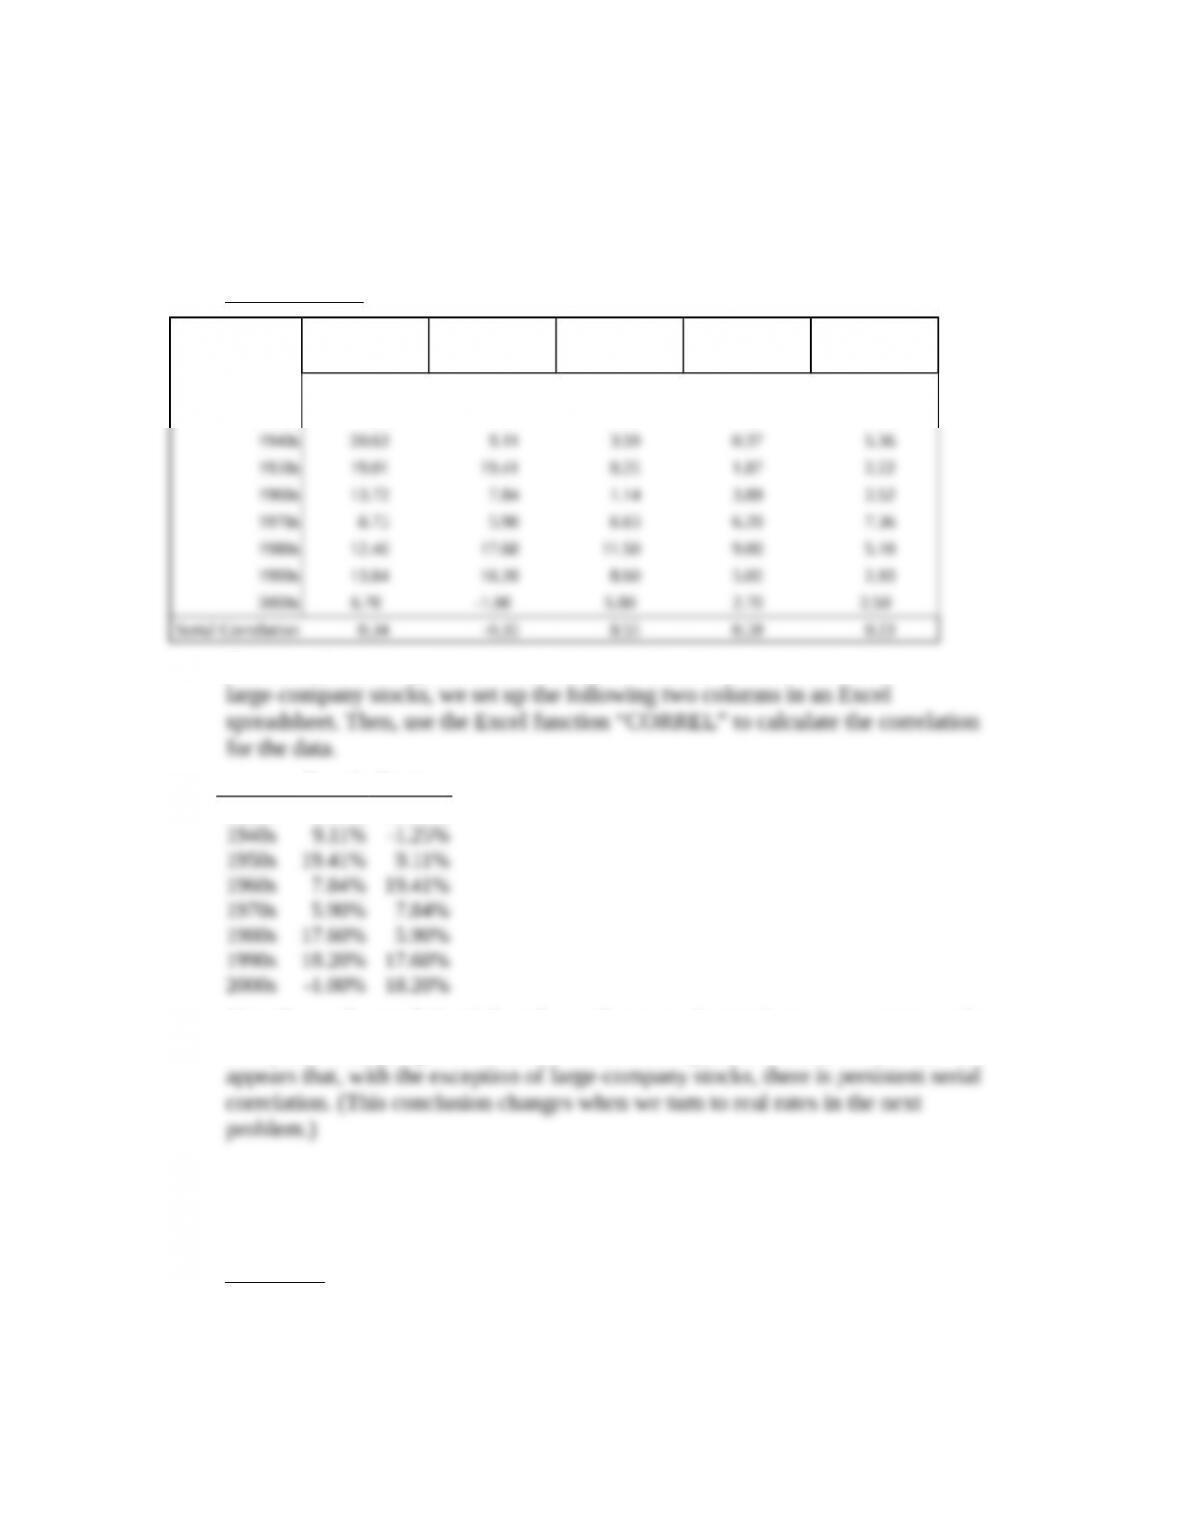
20. Rearrange the table (converting rows to columns) and compute serial correlation
results in the following table:
Nominal Rates
Small
Company
Stocks
Large
Company
Stocks
Long-Term
Government
Bonds
Treasury
Bills
Inflation
1920s -3.72 18.36 3.98 3.56 -1.00
1930s 7.28 -1.25 4.60 0.30 -2.04
For example: to compute serial correlation in decade nominal returns for
Decade Previous
1930s
-1.25%
18.36%
Note that each correlation is based on only seven observations, so we cannot arrive
at any statistically significant conclusions. Looking at the results, however, it
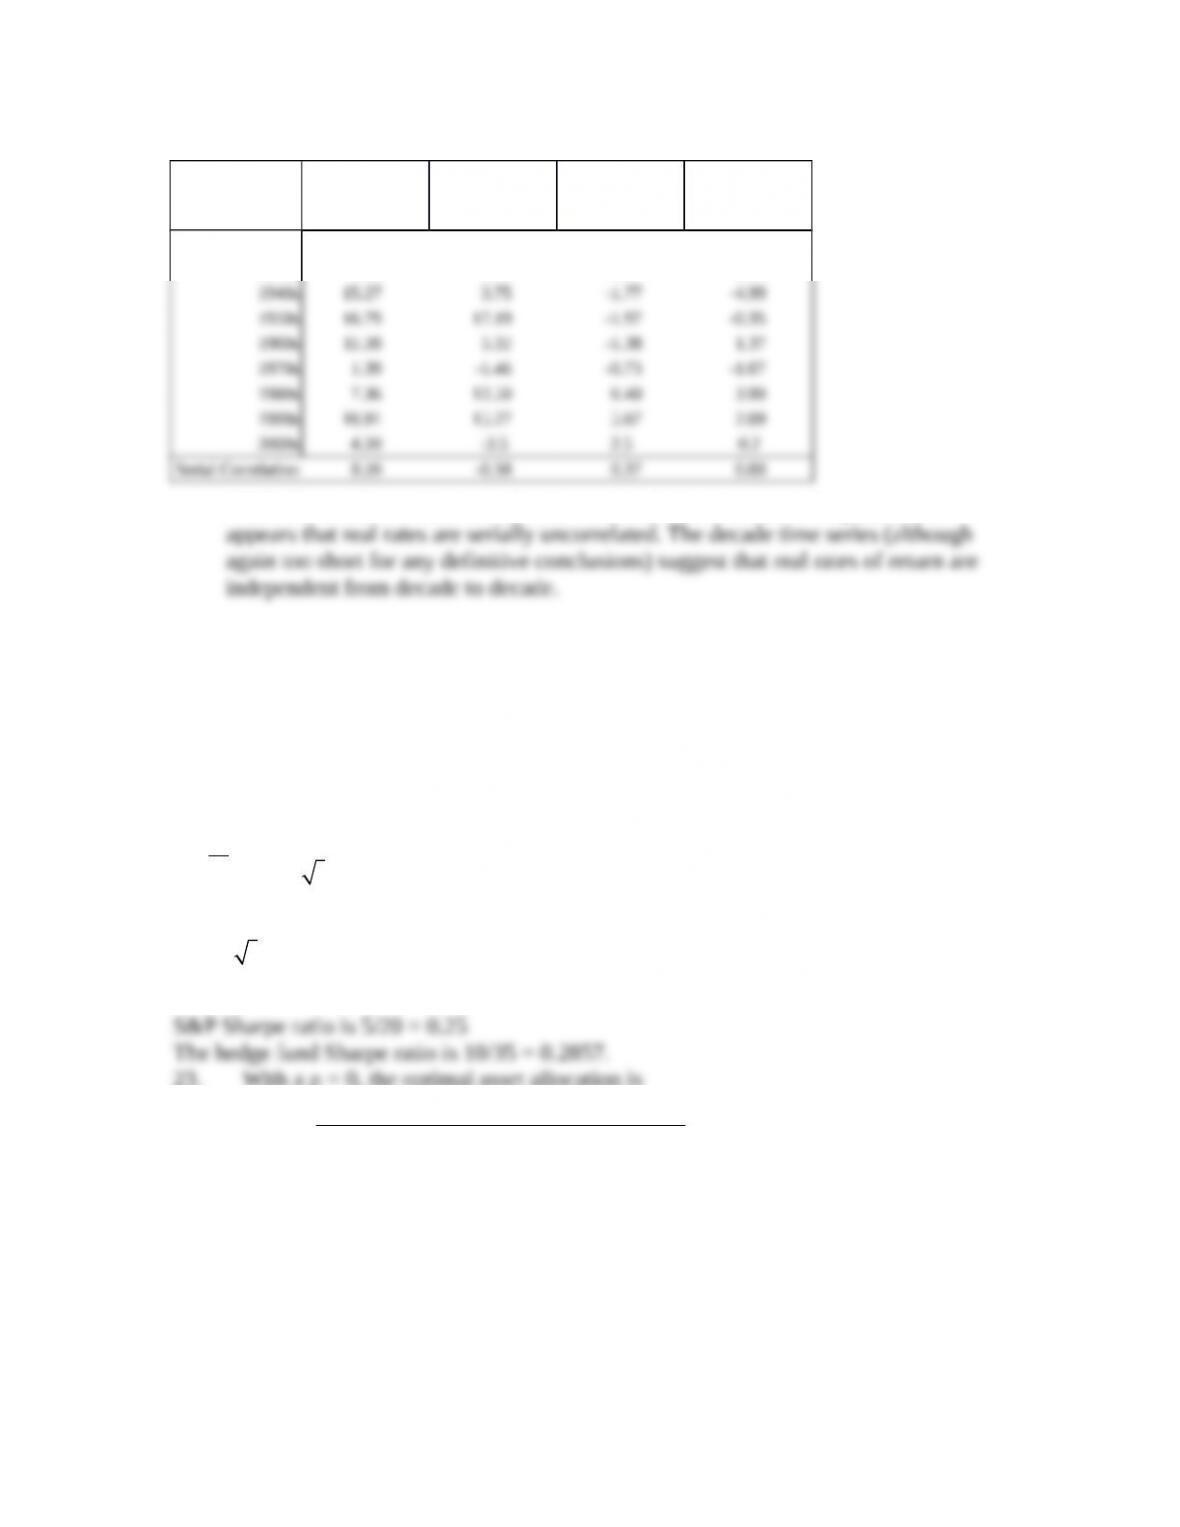
21. The table for real rates (using the approximation of subtracting a decade’s average
inflation from the decade’s average nominal return) is:
Real Rates
7-2
CHAPTER 7: OPTIMAL RISKY PORTFOLIOS
Small
Company
Stocks
Large
Company
Stocks
Long-Term
Government
Bonds
Treasury
Bills
1920s -2.72 19.36 4.98 4.56
1930s 9.32 0.79 6.64 2.34
While the serial correlation in decade nominal returns seems to be positive, it
22. The risk premium for the S&P portfolio is:
❑❑
1
(1 .05) 1 0.05+ - =
The 3-year risk premium for the hedge fund portfolio is
❑❑
1
(1 .1) 1 0.1+ - =
The S&P 3-year standard deviation is:
√
❑
0.2 1 0.20´ =
.
The hedge fund 3-year standard deviation is:
0.35 1 0.35´ =
23. With a ρ = 0, the optimal asset allocation is
2
&2 2
5 35 10 (0 20 35) 0.6049
5 35 10 20 (5 10) (0 20 35)
S P
W´ - ´ ´ ´
= =
´ + ´ - + ´ ´ ´
1 0.6049 0.3951
Hedge
W= - =
.
With these weights,
7-3
CHAPTER 7: OPTIMAL RISKY PORTFOLIOS
( ) 0.6049 5 0.3951 10 0.0698 6.9753%
P
E r = ´ + ´ = =
2 2 2 2
.6049 20 .3951 35 2 .6049 .3951 (0 20 35) .1837 18.3731%
P
s= ´ + ´ + ´ ´ ´ ´ ´ = =
24. Greta has a risk aversion of A=3, Therefore, she will invest
2
.06975 0.6888 68.88%
3 .1837
y= = =
´
of her wealth in this risky portfolio. The resulting investment composition will be S&P:
31.11% will be invested in the risk-free asset.
CHAPTER 7: OPTIMAL RISKY PORTFOLIOS
4. d. Portfolio Y cannot be efficient because it is dominated by another portfolio.
10. Since we do not have any information about expected returns, we focus exclusively
on reducing variability. Stocks A and C have equal standard deviations, but the
11. Fund D represents the single best addition to complement Stephenson's current
portfolio, given his selection criteria. Fund D’s expected return (14.0 percent) has the
potential to increase the portfolio’s return somewhat. Fund D’s relatively low
The other three funds have shortcomings in terms of expected return enhancement
or volatility reduction through diversification. Fund A offers the potential for
increasing the portfolio’s return but is too highly correlated to provide substantial
7-6
CHAPTER 7: OPTIMAL RISKY PORTFOLIOS
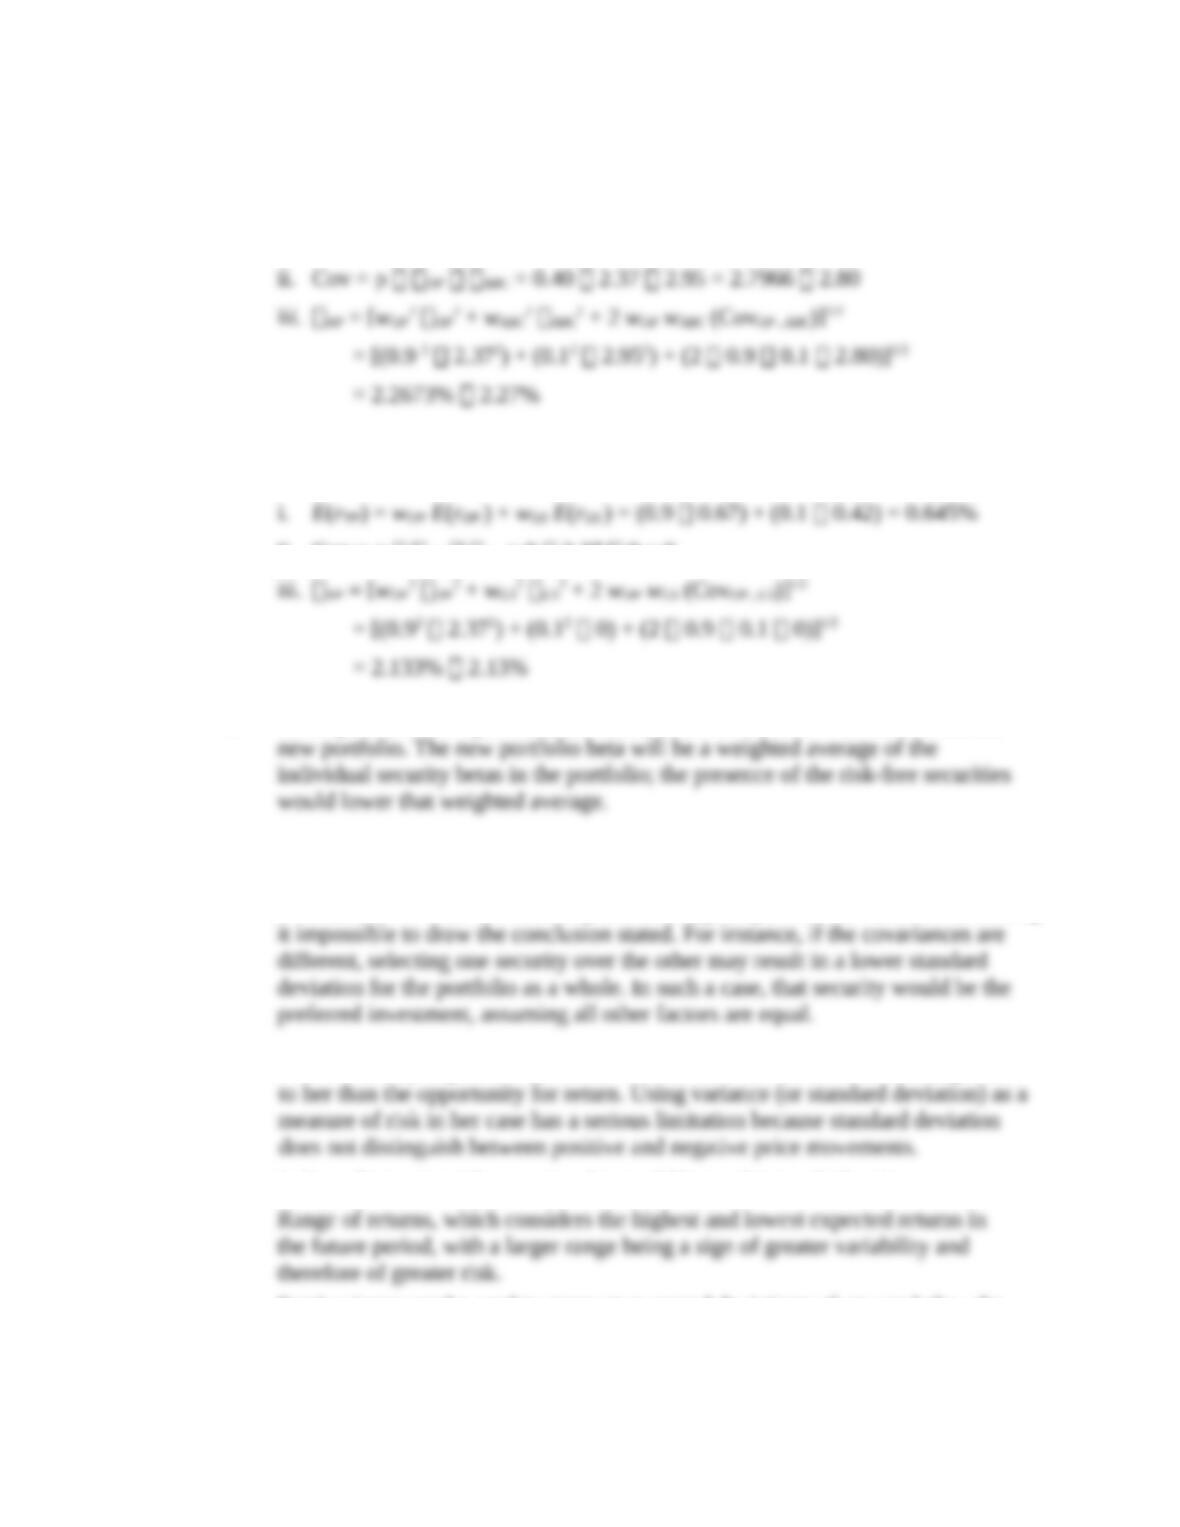
12. a. Subscript OP refers to the original portfolio, ABC to the new stock, and NP
to the new portfolio.
i. E(rNP) = wOP E(rOP ) + wABC E(rABC ) = (0.9 0.67) + (0.1 1.25) = 0.728%
b. Subscript OP refers to the original portfolio, GS to government securities, and
NP to the new portfolio.
ii. Cov = ρ OP GS = 0 2.37 0 = 0
c. Adding the risk-free government securities would result in a lower beta for the
d. The comment is not correct. Although the respective standard deviations and
expected returns for the two securities under consideration are equal, the
covariances between each security and the original portfolio are unknown, making
e. i. Grace clearly expressed the sentiment that the risk of loss was more important
ii. Two alternative risk measures that could be used instead of variance are:
Semivariance can be used to measure expected deviations of returns below the
mean, or some other benchmark, such as zero.
7-7
CHAPTER 7: OPTIMAL RISKY PORTFOLIOS
Either of these measures would potentially be superior to variance for Grace.
Range of returns would help to highlight the full spectrum of risk she is
13. a. Systematic risk refers to fluctuations in asset prices caused by macroeconomic
factors that are common to all risky assets; hence systematic risk is often
Firm-specific risk refers to fluctuations in asset prices caused by factors that
b. Trudy should explain to the client that picking only the top five best ideas
would most likely result in the client holding a much more risky portfolio. The
The systematic component depends on the sensitivity of the individual assets
to market movements as measured by beta. Assuming the portfolio is well
On the other hand, the components of firm-specific risk (sometimes called
nonsystematic risk) are not perfectly positively correlated with each other and,
as more assets are added to the portfolio, those additional assets tend to reduce
portfolio risk. Hence, increasing the number of securities in a portfolio
7-8


