CHAPTER 6: RISK AVERSION AND
CAPITAL ALLOCATION TO RISKY ASSETS
CHAPTER 6: RISK AVERSION AND
CAPITAL ALLOCATION TO RISKY ASSETS
PROBLEM SETS
1. (d) While a higher or lower Sharpe ratios are not an indication of an investor’s
2. (b) A higher borrowing rate is a consequence of the risk of the borrowers’ default.
In perfect markets with no additional cost of default, this increment would equal the
3. Assuming no change in risk tolerance, that is, an unchanged risk-aversion
4. a. The expected cash flow is: (0.5 × $70,000) + (0.5 × 200,000) = $135,000.
b. If the portfolio is purchased for $118,421 and provides an expected cash
inflow of $135,000, then the expected rate of return [E(r)] is as follows:
c. If the risk premium over T-bills is now 12%, then the required return is:
6-D
CHAPTER 6: RISK AVERSION AND
CAPITAL ALLOCATION TO RISKY ASSETS
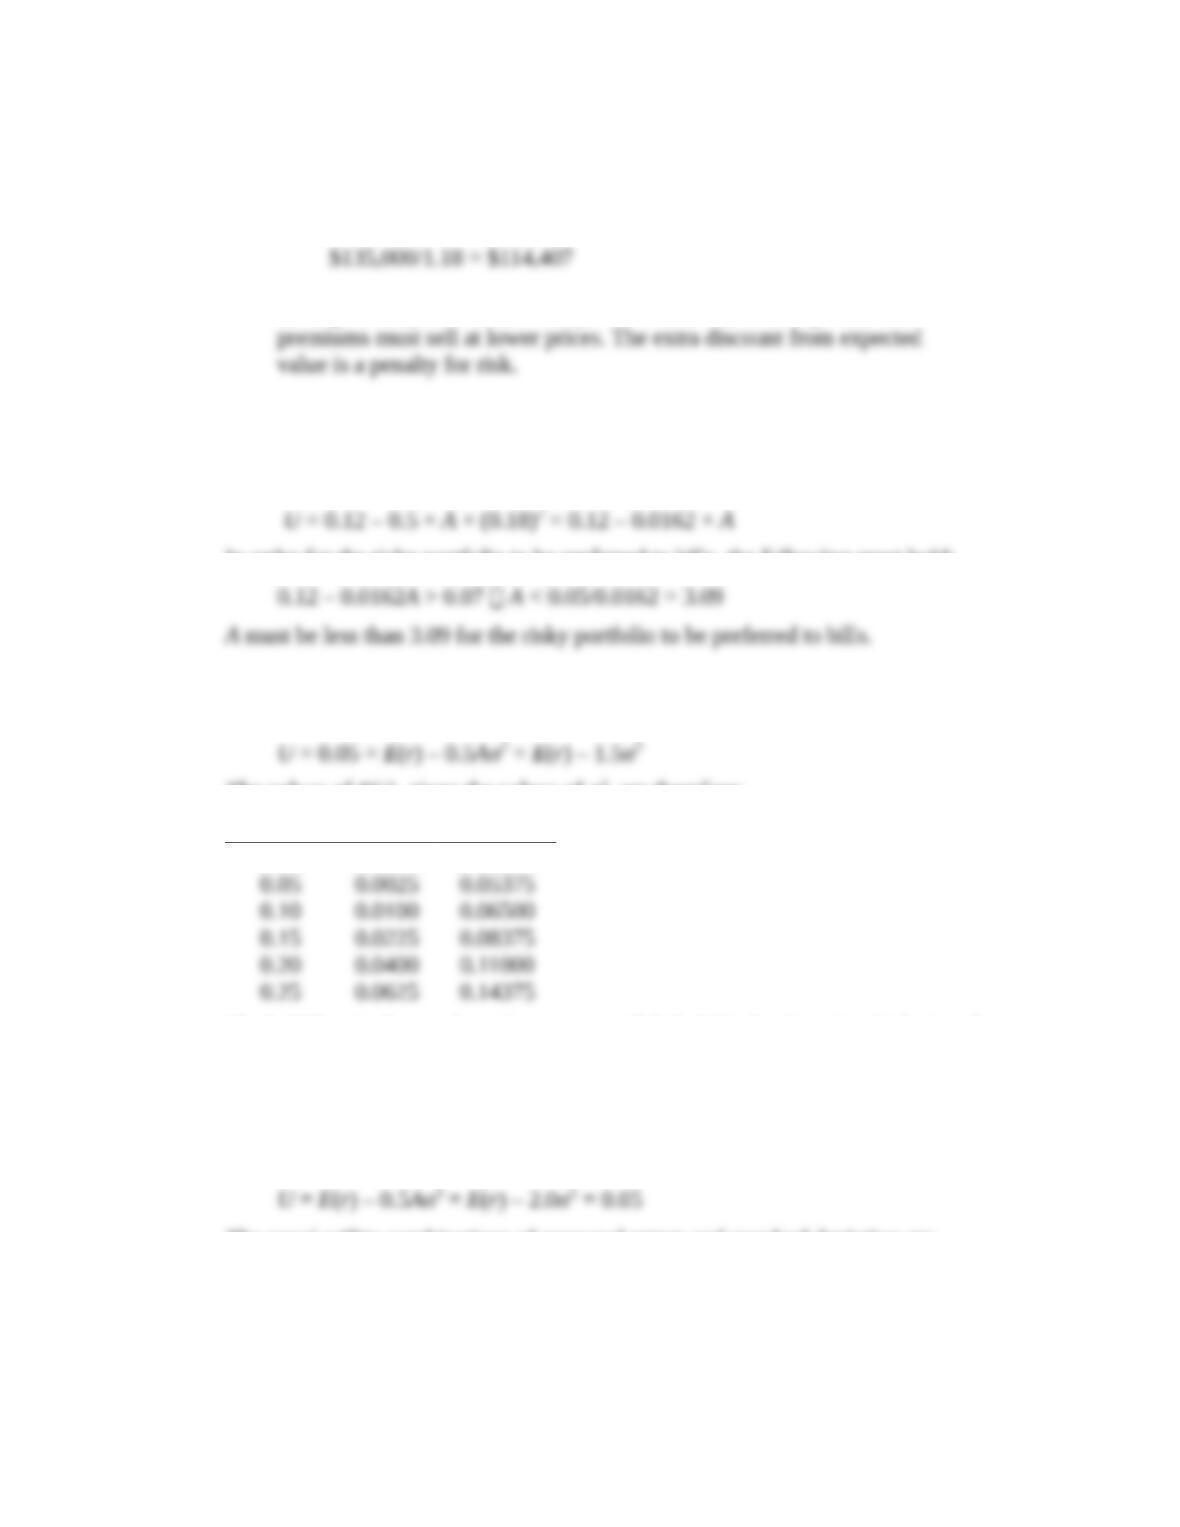
The present value of the portfolio is now:
d. For a given expected cash flow, portfolios that command greater risk
5. When we specify utility by U = E(r) – 0.5AσD2, the utility level for T-bills is: 0.07
The utility level for the risky portfolio is:
In order for the risky portfolio to be preferred to bills, the following must hold:
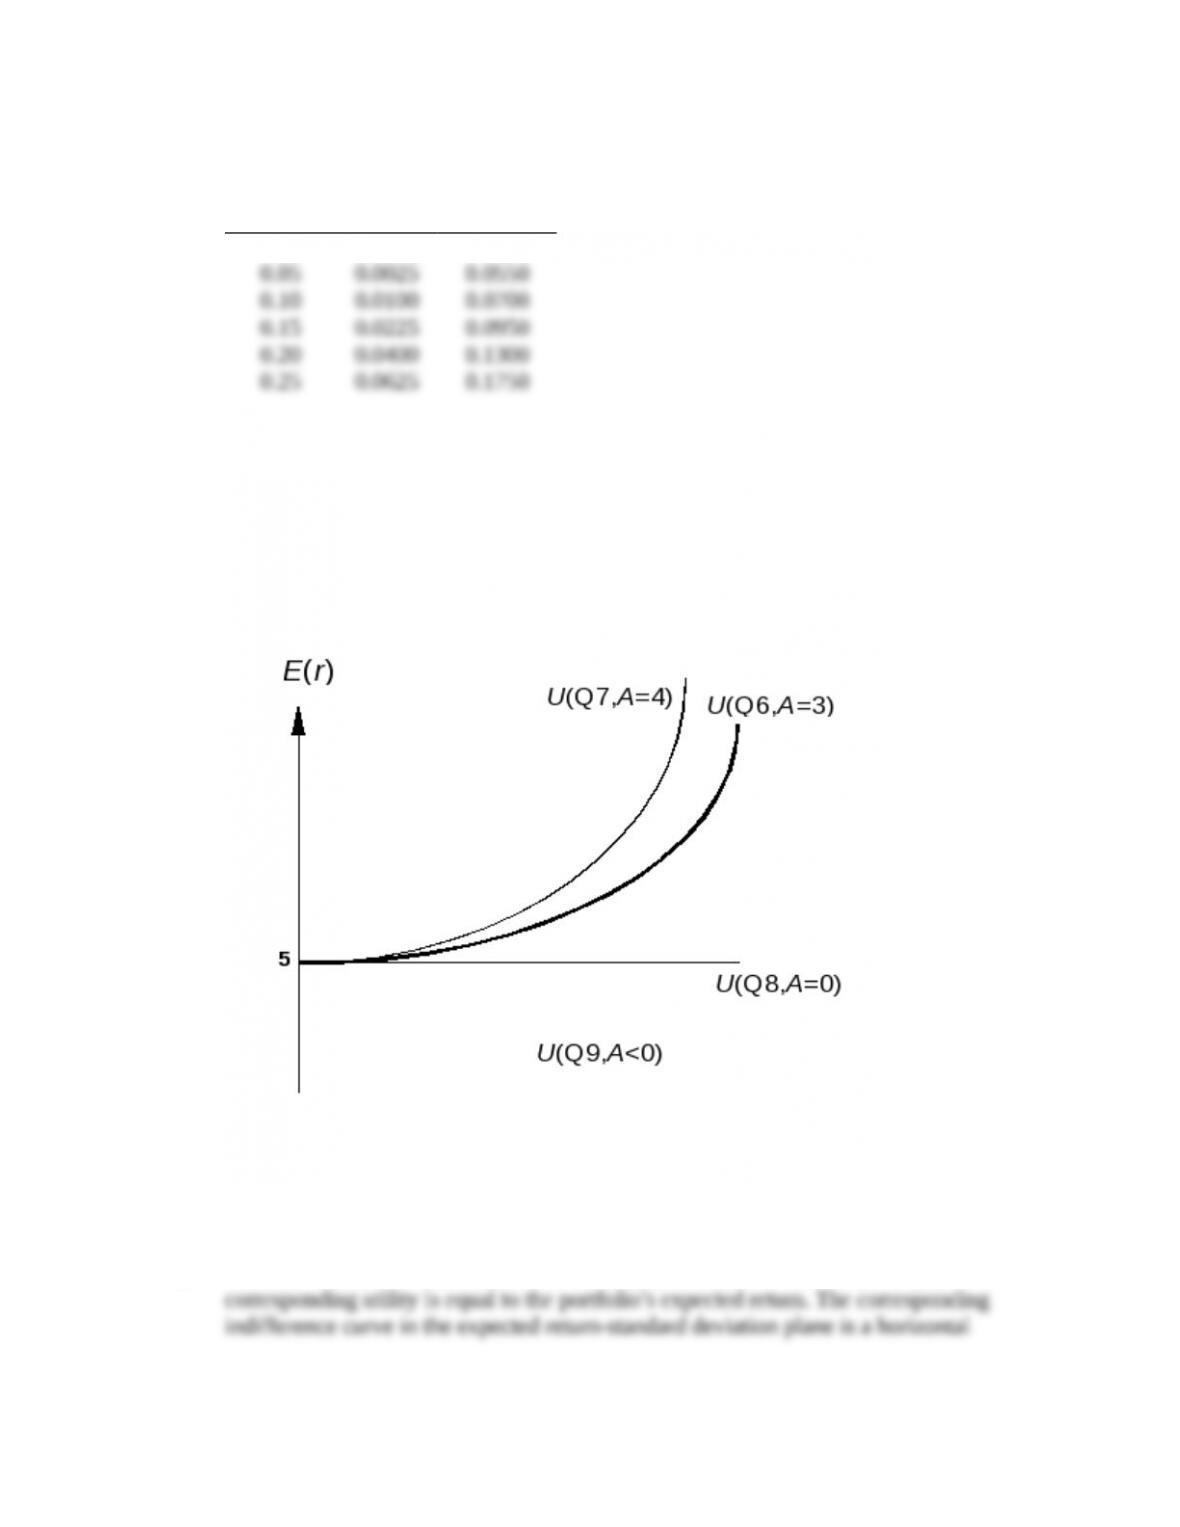
6. Points on the curve are derived by solving for E(r) in the following equation:
The values of E(r), given the values of σ2, are therefore:
2 E(r)
0.00
0.0000
0.05000
The bold line in the graph on the next page (labeled Q6, for Question 6) depicts the
indifference curve.
7. Repeating the analysis in Problem 6, utility is now:
The equal-utility combinations of expected return and standard deviation are
presented in the table below. The indifference curve is the upward sloping line in
the graph on the next page, labeled Q7 (for Question 7).
6-D
CHAPTER 6: RISK AVERSION AND
CAPITAL ALLOCATION TO RISKY ASSETS
2 E(r)
0.00
0.0000
0.0500
The indifference curve in Problem 7 differs from that in Problem 6 in slope.
When A increases from 3 to 4, the increased risk aversion results in a greater
slope for the indifference curve since more expected return is needed in order to
compensate for additional σ.
8. The coefficient of risk aversion for a risk neutral investor is zero. Therefore, the
6-D
CHAPTER 6: RISK AVERSION AND
CAPITAL ALLOCATION TO RISKY ASSETS
9. A risk lover, rather than penalizing portfolio utility to account for risk, derives
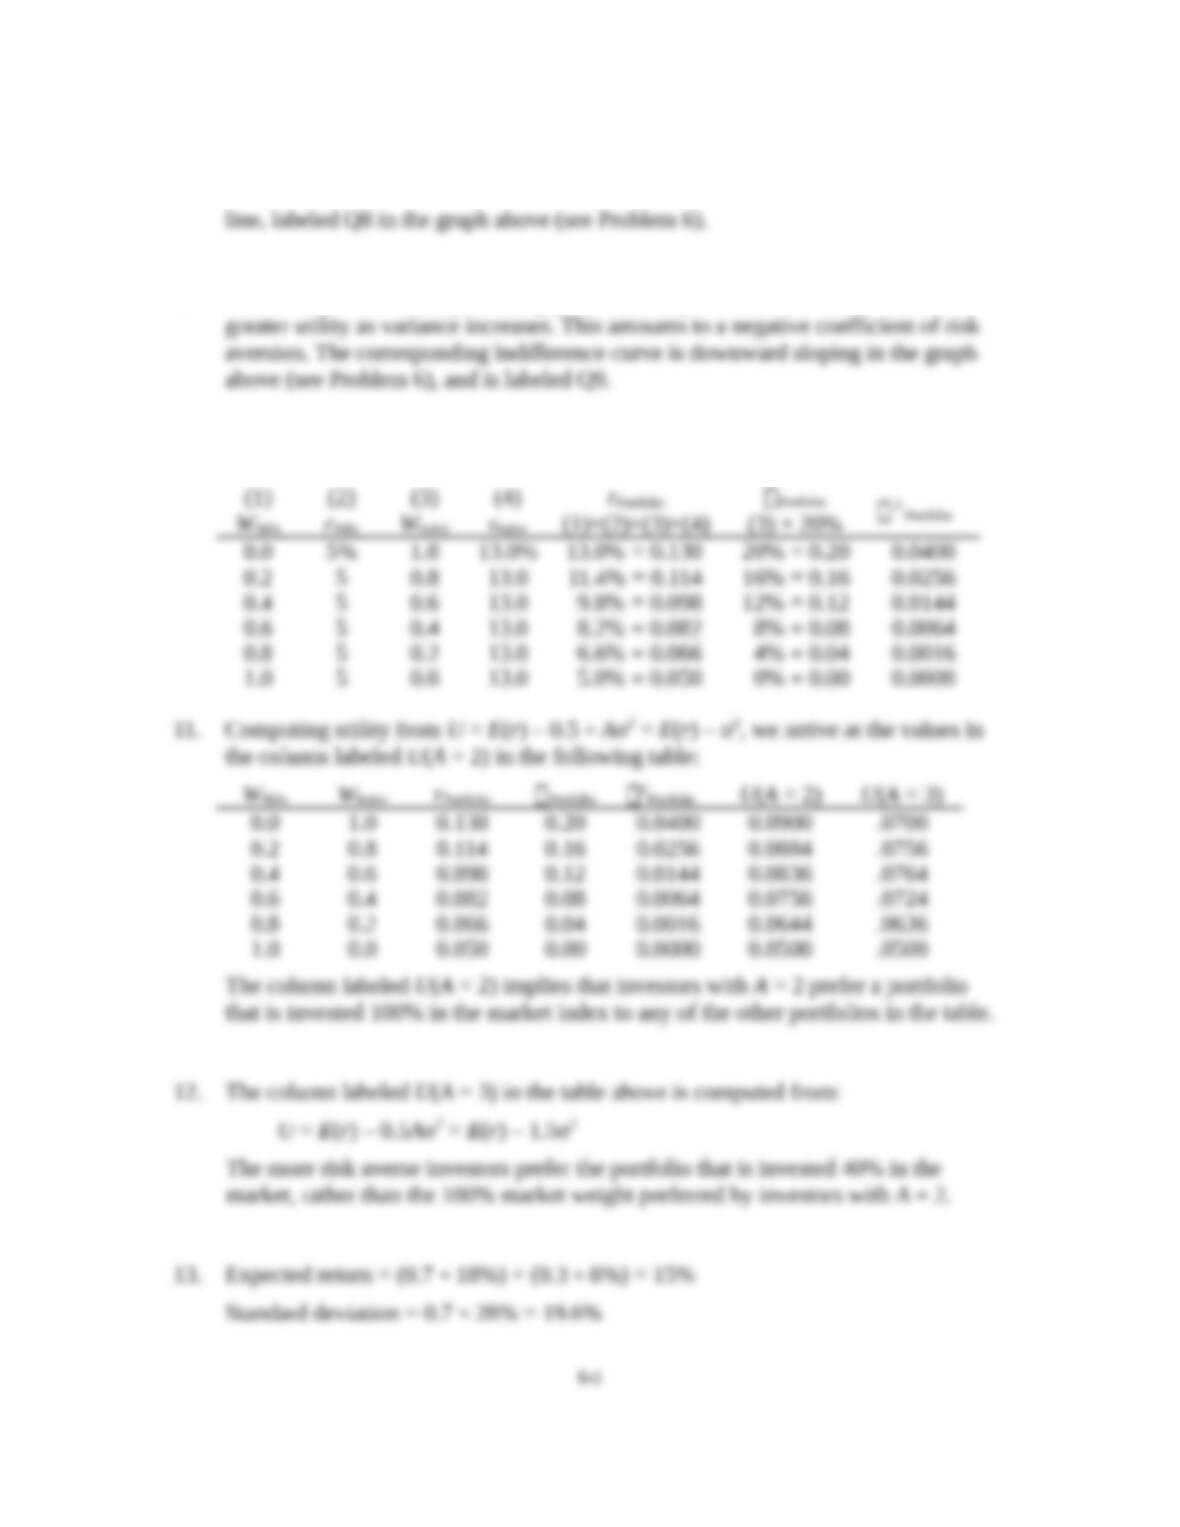
10. The portfolio expected return and variance are computed as follows:
CHAPTER 6: RISK AVERSION AND
CAPITAL ALLOCATION TO RISKY ASSETS
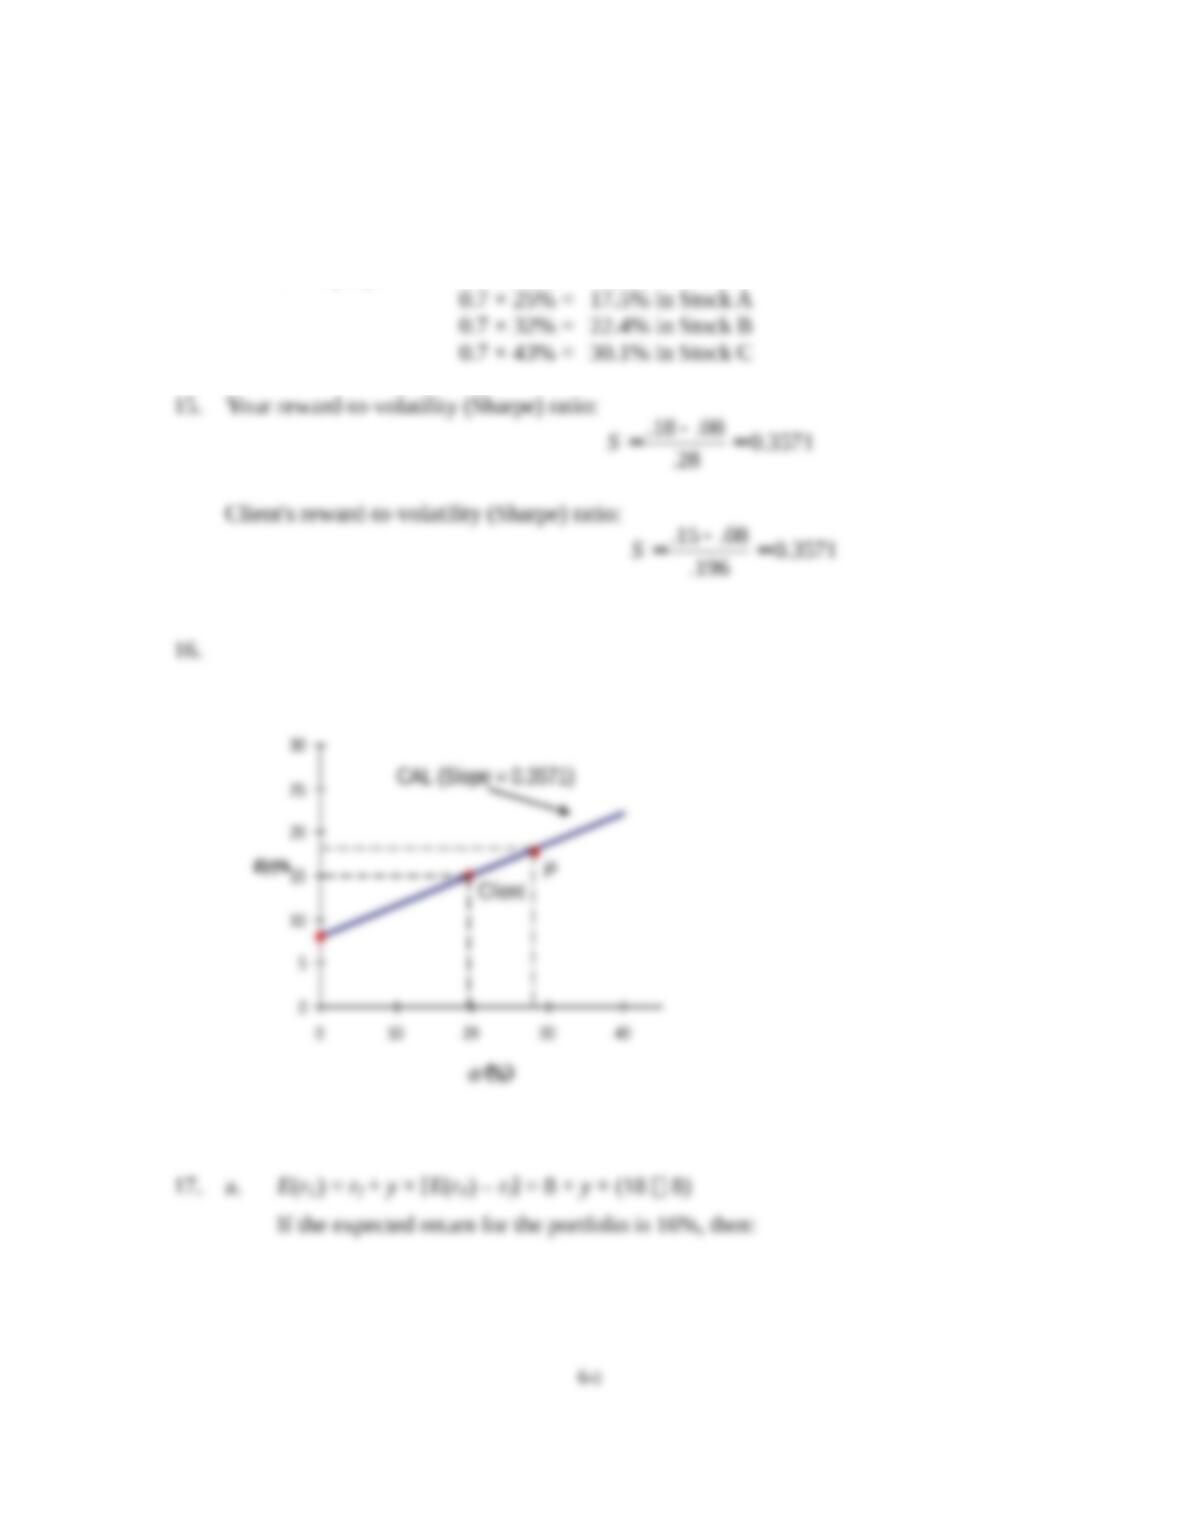
14. Investment proportions: 30.0% in T-bills
CHAPTER 6: RISK AVERSION AND
CAPITAL ALLOCATION TO RISKY ASSETS
CHAPTER 6: RISK AVERSION AND
CAPITAL ALLOCATION TO RISKY ASSETS
b.
Client’s investment proportions: 20.0% in T-bills
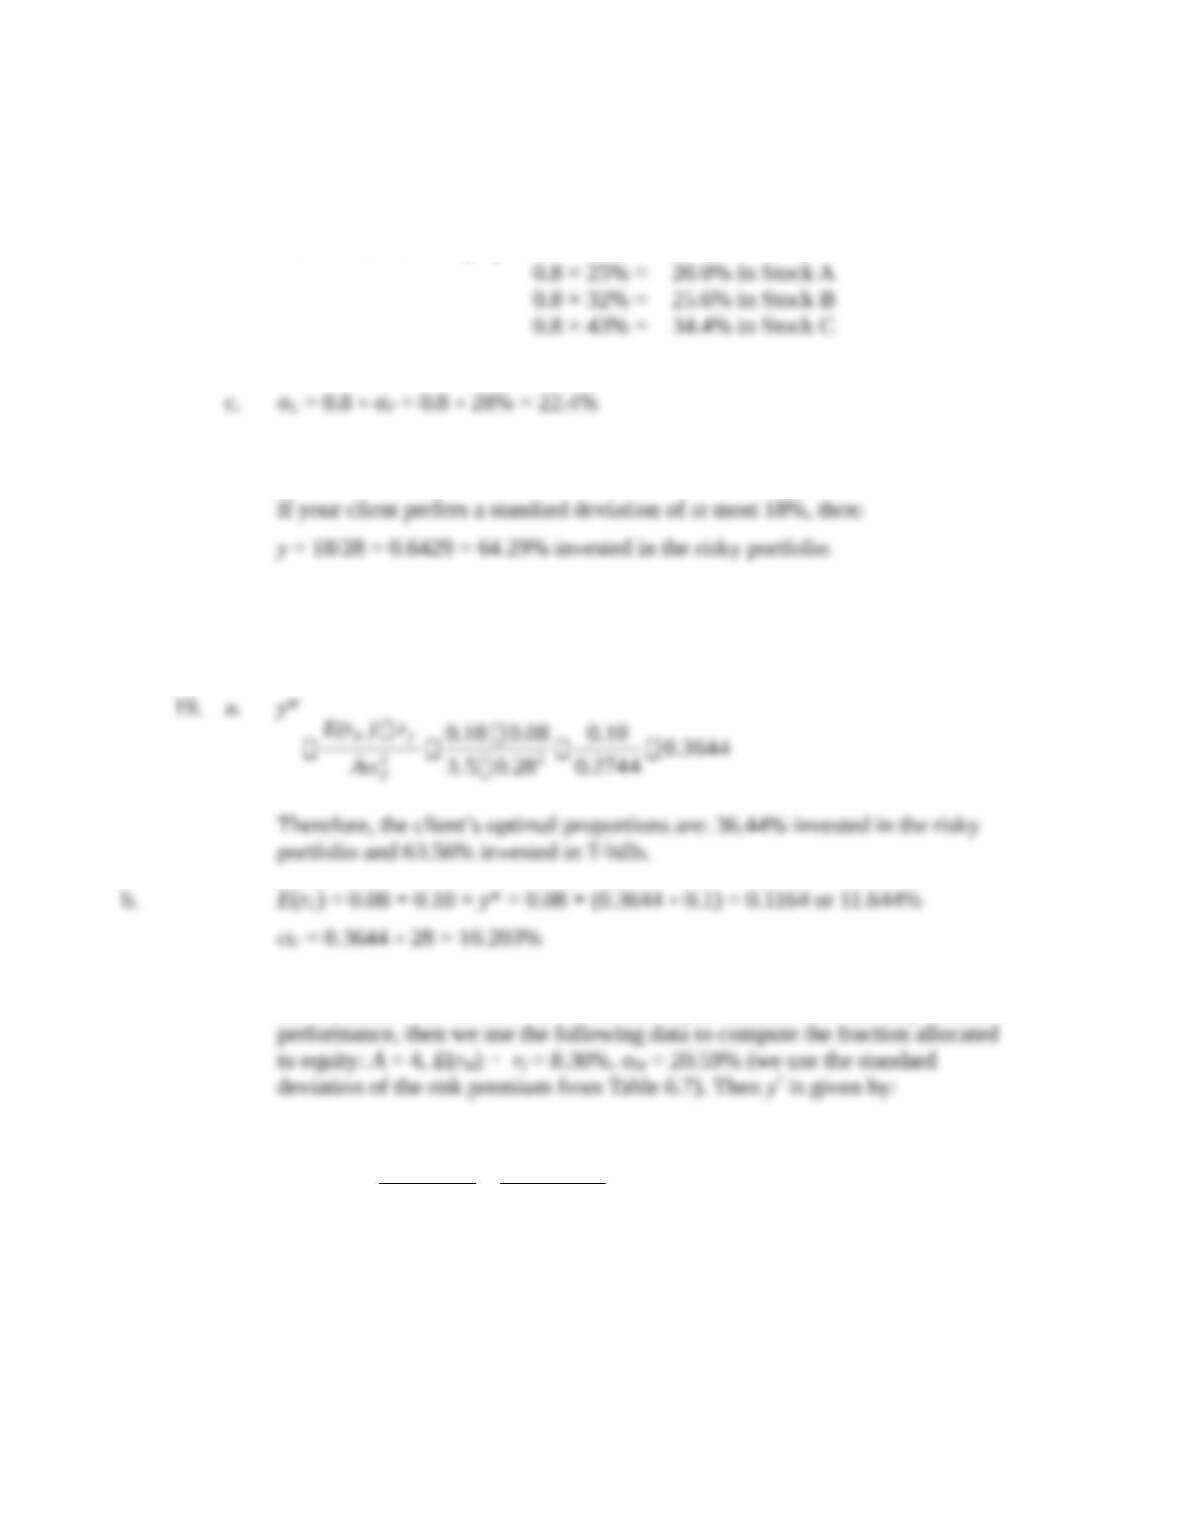
18. a. σC = y × 28%
b.
( ) .08 .1 .08 (0.6429 .1) 14.429%
C
E r y= + ´ = + ´ =
19. a. y*
0.3644
0.2744
0.10
0.283.5
0.080.18
σ
22
P
fP
A
r)E(r
Therefore, the client’s optimal proportions are: 36.44% invested in the risky
portfolio and 63.56% invested in T-bills.
b. E(rC) = 0.08 + 0.10 × y* = 0.08 + (0.3644 × 0.1) = 0.1164 or 11.644%
C = 0.3644 × 28 = 10.203%
20. a. If the period 1926–2015 is assumed to be representative of future expected
2 2
( ) 0.0830
* 0.4894
4 0.2059
M f
M
E r r
yAs
–
= = =
´
That is, 48.94% of the portfolio should be allocated to equity and 51.06%
should be allocated to T-bills.
6-D
2 2
( ) 0.0533
* 0.4023
4 0.1820
M f
M
E r r
yAs
–
= = =
´
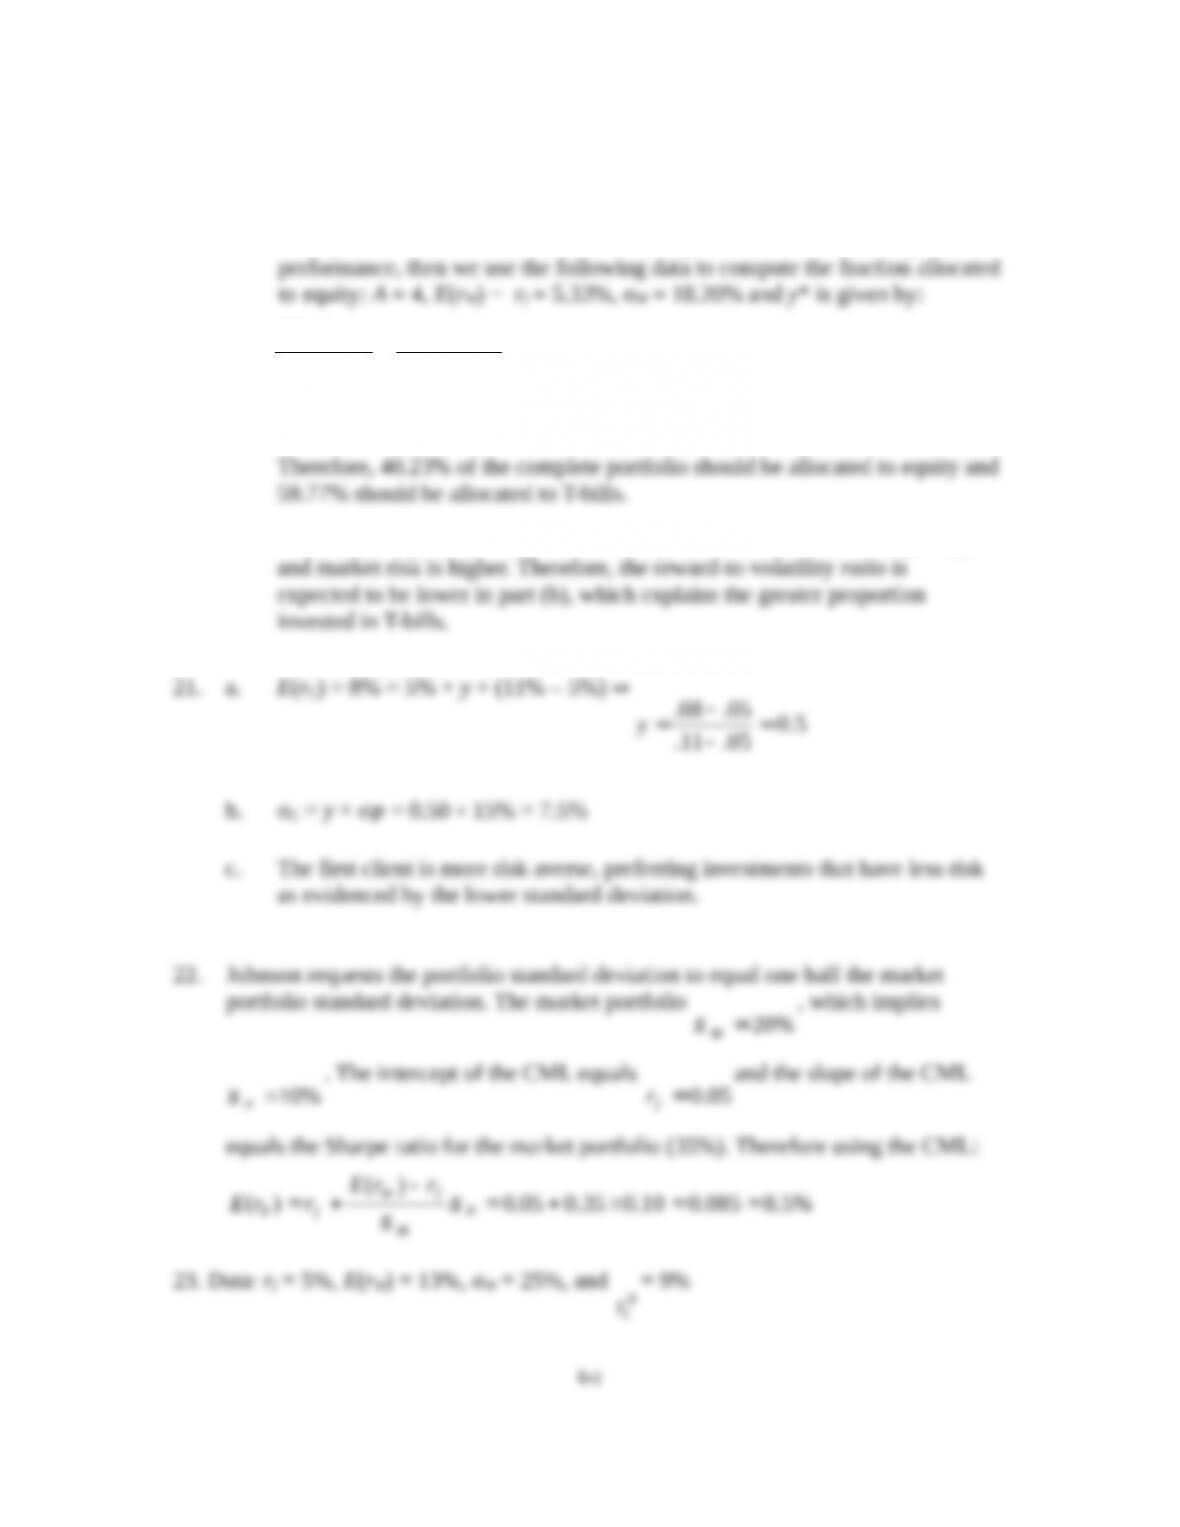
Therefore, 40.23% of the complete portfolio should be allocated to equity and
59.77% should be allocated to T-bills.
c. In part (b), the market risk premium is expected to be lower than in part (a)
CHAPTER 6: RISK AVERSION AND
CAPITAL ALLOCATION TO RISKY ASSETS
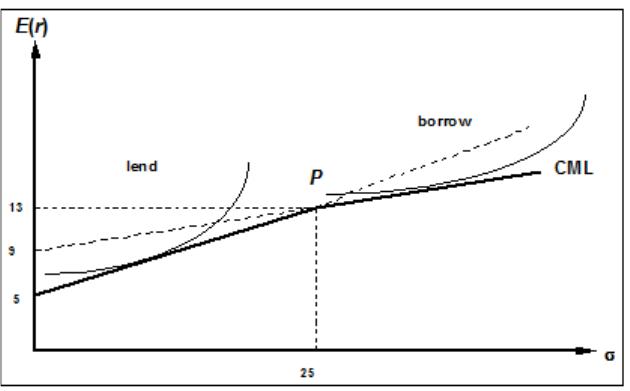
The CML and indifference curves are as follows:
6-D
CHAPTER 6: RISK AVERSION AND
CAPITAL ALLOCATION TO RISKY ASSETS
6-D