Unlock document.
This document is partially blurred.
Unlock all pages and 1 million more documents.
Get Access
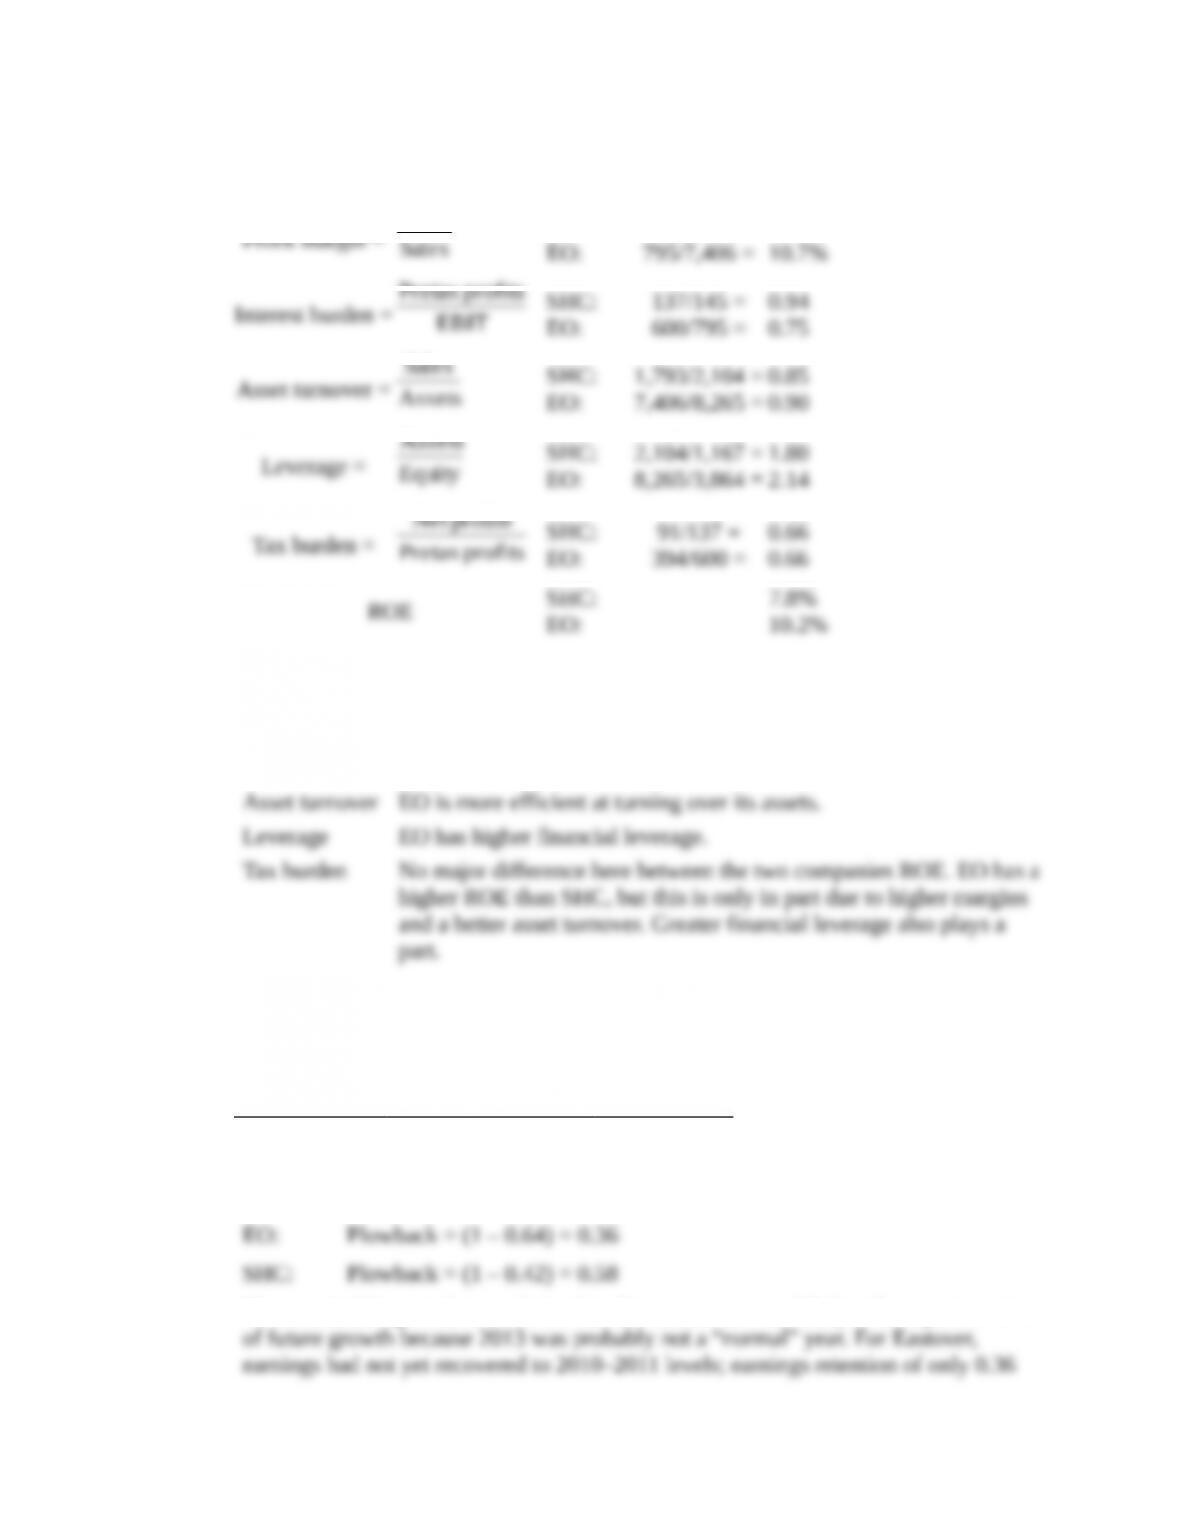
5. a. ROE = Operating margin Interest burden Asset turnover Leverage Tax burden
ROE for Eastover (EO) and for Southampton (SHC) in 2013 is found as follows:
Profit margin =
EBIT
SHC:
145/1,793 =
8.1%
profitsPretax
Sales
Assets
profitsNet
b. The differences in the components of ROE for Eastover and Southampton are:
Profit margin EO has a higher margin.
Interest burden EO has a higher interest burden because its pretax profits are a lower
percentage of EBIT.
b. The sustainable growth rate can be calculated as ROE times plowback ratio. The
sustainable growth rates for Eastover and Southampton are as follows:
ROE
Plowback
Ratio*
Sustainable
Growth Rate
Eastover
10.2%
0.36
3.7%
Southampton 7.8 0.58 4.5
*Plowback = (1 – Payout ratio)
The sustainable growth rates derived in this manner are not likely to be representative
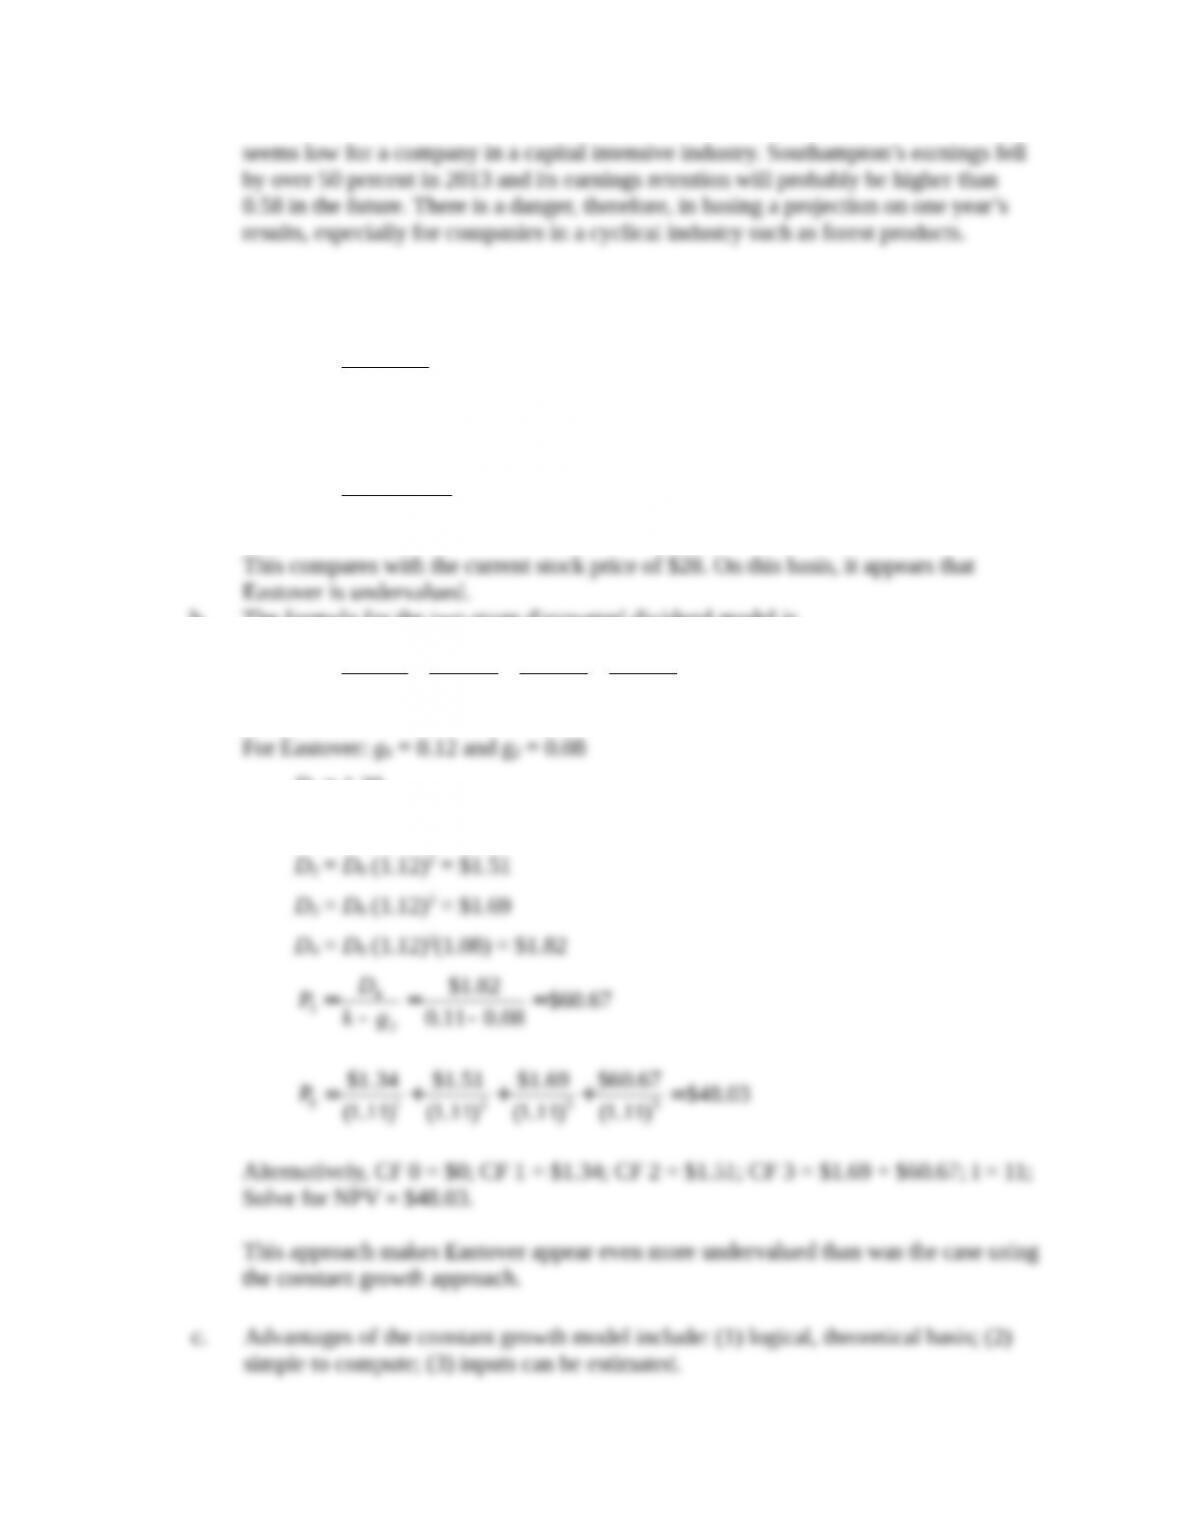
6. a. The formula for the constant growth discounted dividend model is
0
0
(1 )D g
Pk g
+
=-
For Eastover:
0
$1.20 1.08 $43.20
0.11 0.08
P´
= =
-
This compares with the current stock price of $28. On this basis, it appears that
Eastover is undervalued.
b. The formula for the two-stage discounted dividend model is
3 31 2
01 2 3 3
(1 ) (1 ) (1 ) (1 )
D P
D D
Pk k k k
= + + +
+ + + +
D0 = 1.20
D1 = D0 (1.12)1 = $1.34
Disadvantages include: (1) very sensitive to estimates of growth; (2) g and k difficult to
Improvements offered by the two-stage model include:
(1) The two-stage model is more realistic. It accounts for low, high, or zero growth in the
(2) The model can be used to determine stock value when the growth rate in the first
7. a. In order to determine whether a stock is undervalued or overvalued, analysts often
compute price-earnings ratios (P/Es) and price-book ratios (P/Bs); then, these ratios
Relative P/E =
Relative P/B =
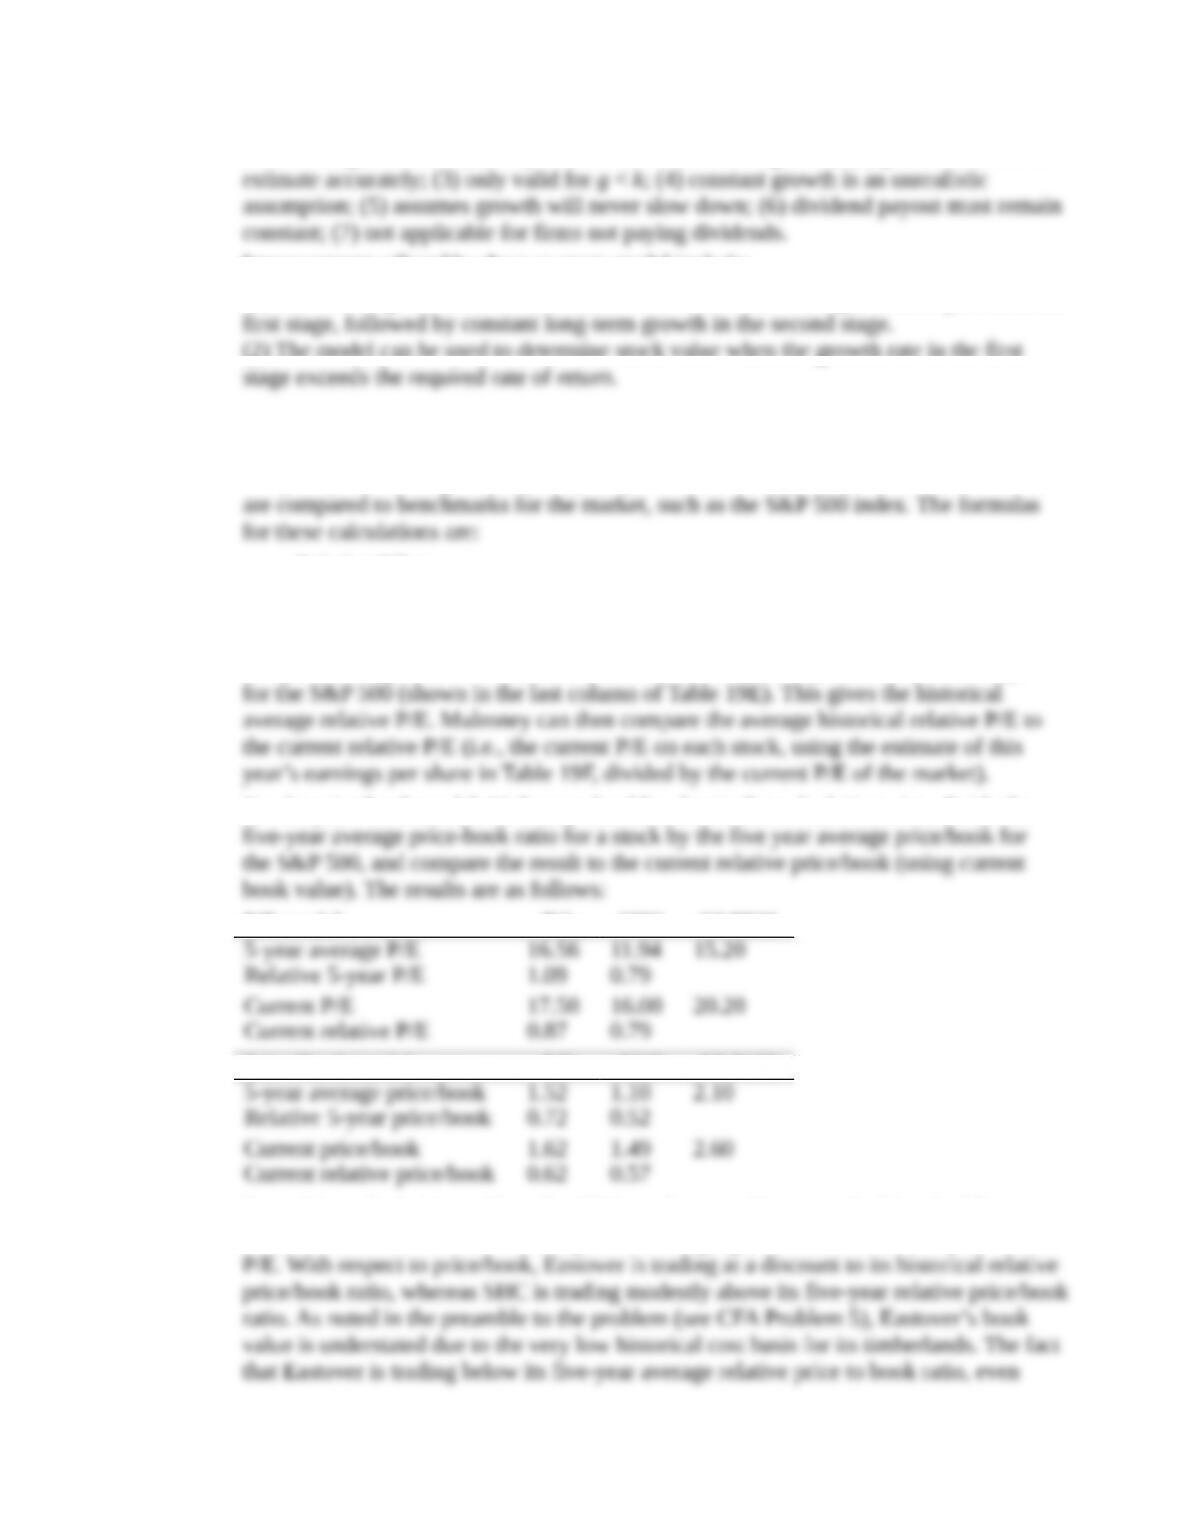
To evaluate EO and SHC using a relative P/E model, Mulroney can calculate the
five-year average P/E for each stock and divide that number by the five-year average P/E
For the price/book model, Mulroney should make similar calculations, i.e., divide the
P/E model EO SHC S&P500
Price/Book model EO SHC S&P500
From this analysis, it is evident that EO is trading at a discount to its historical five-year
relative P/E ratio, whereas Southampton is trading right at its historical five-year relative
b. Disadvantages of the relative P/E model include: (1) the relative P/E measures only
relative, rather than absolute, value; (2) the accounting earnings estimate for the next
Disadvantages of the relative P/B model include: (1) book value may be understated or
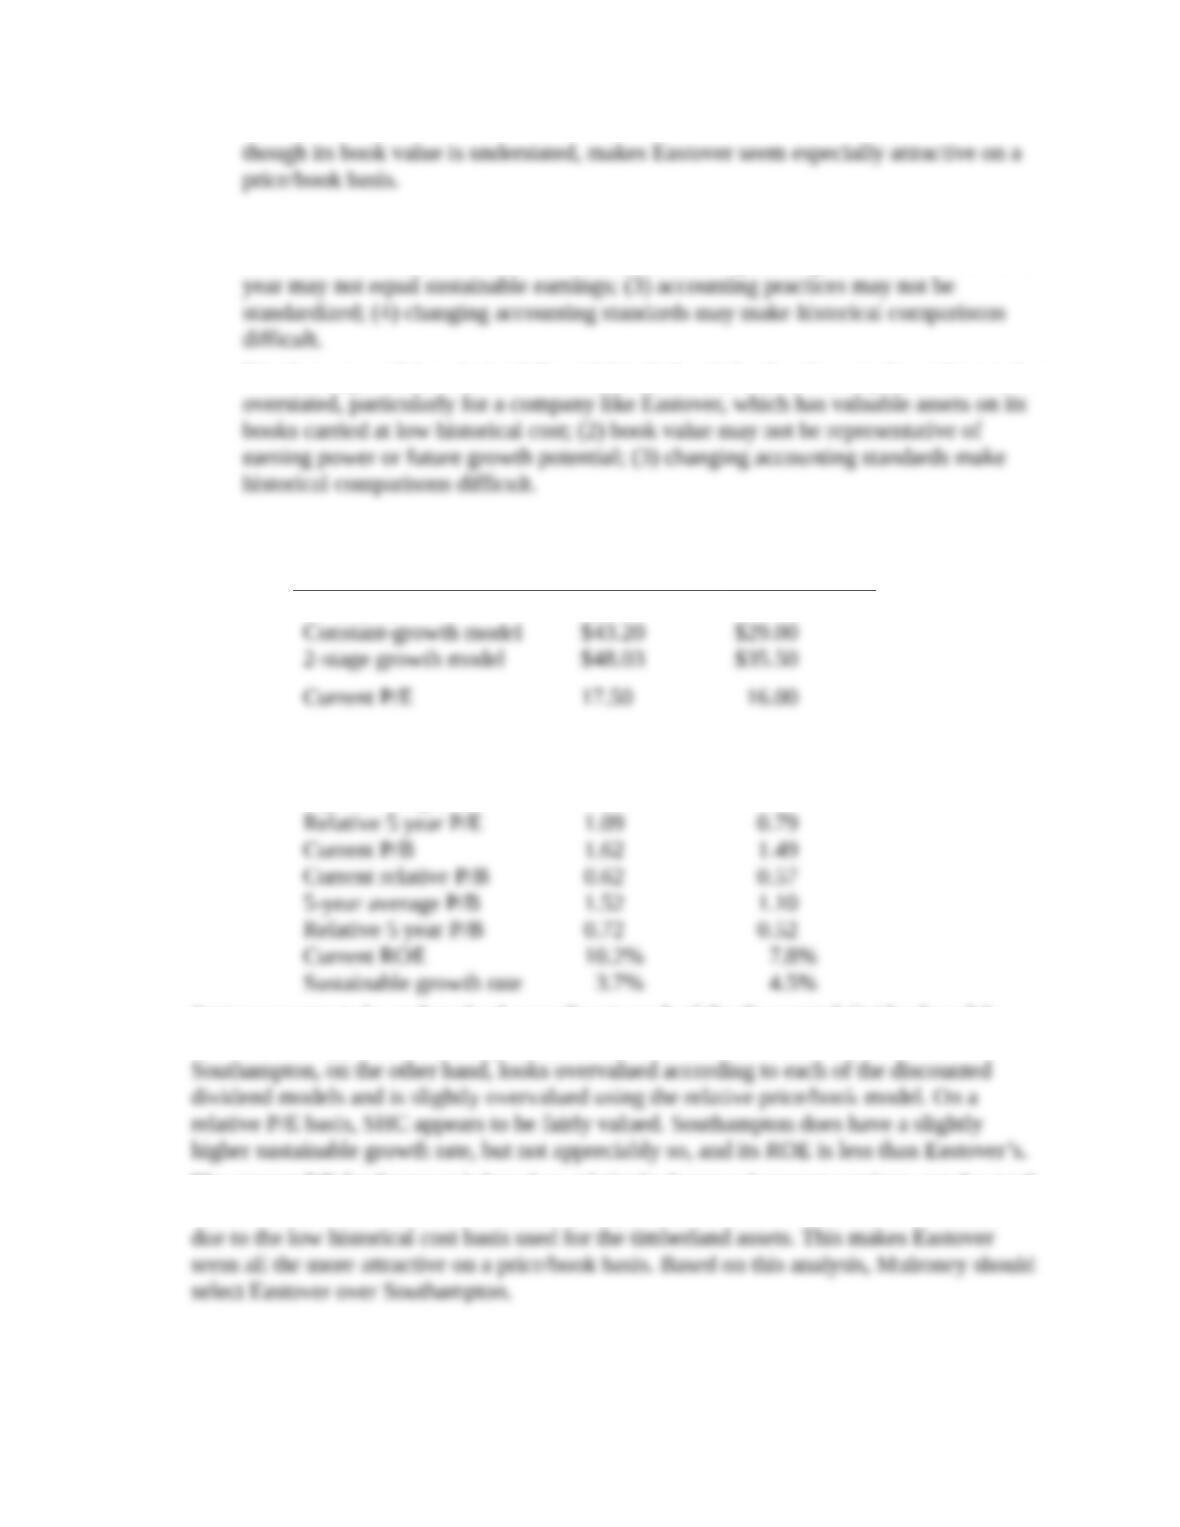
8.The following table summarizes the valuation and ROE for Eastover and Southampton:
Eastover Southampton
Stock price
$28.00
$48.00
Current relative P/E 0.87 0.79
5-year average P/E 16.56 11.94
Eastover seems to be undervalued according to each of the discounted dividend models.
Eastover also appears to be cheap on both a relative P/E and a relative P/B basis.
The current P/E for Eastover is based on relatively depressed current earnings, yet the stock
is still attractive on this basis. In addition, the price/book ratio for Eastover is overstated
9. a. Net income can increase even while cash flow from operations decreases. This can
occur if there is a buildup in net working capital—for example, increases in accounts
b. Cash flow from operations might be a good indicator of a firm's quality of earnings
Cash flow from operations = Sales – Cash expenses – Increase in A/R
11. Both current assets and current liabilities will decrease by equal amounts. But this is a
2. Another offset to declining operating income could have been declining interest rates on any
3. Leverage could have increased as a result of a decline in equity from: (a) writing down an
4. An increase in asset turnover could also offset a decline in operating income. Asset turnover
5. If the effective tax rate declined, the resulting increase in earnings after tax could offset a
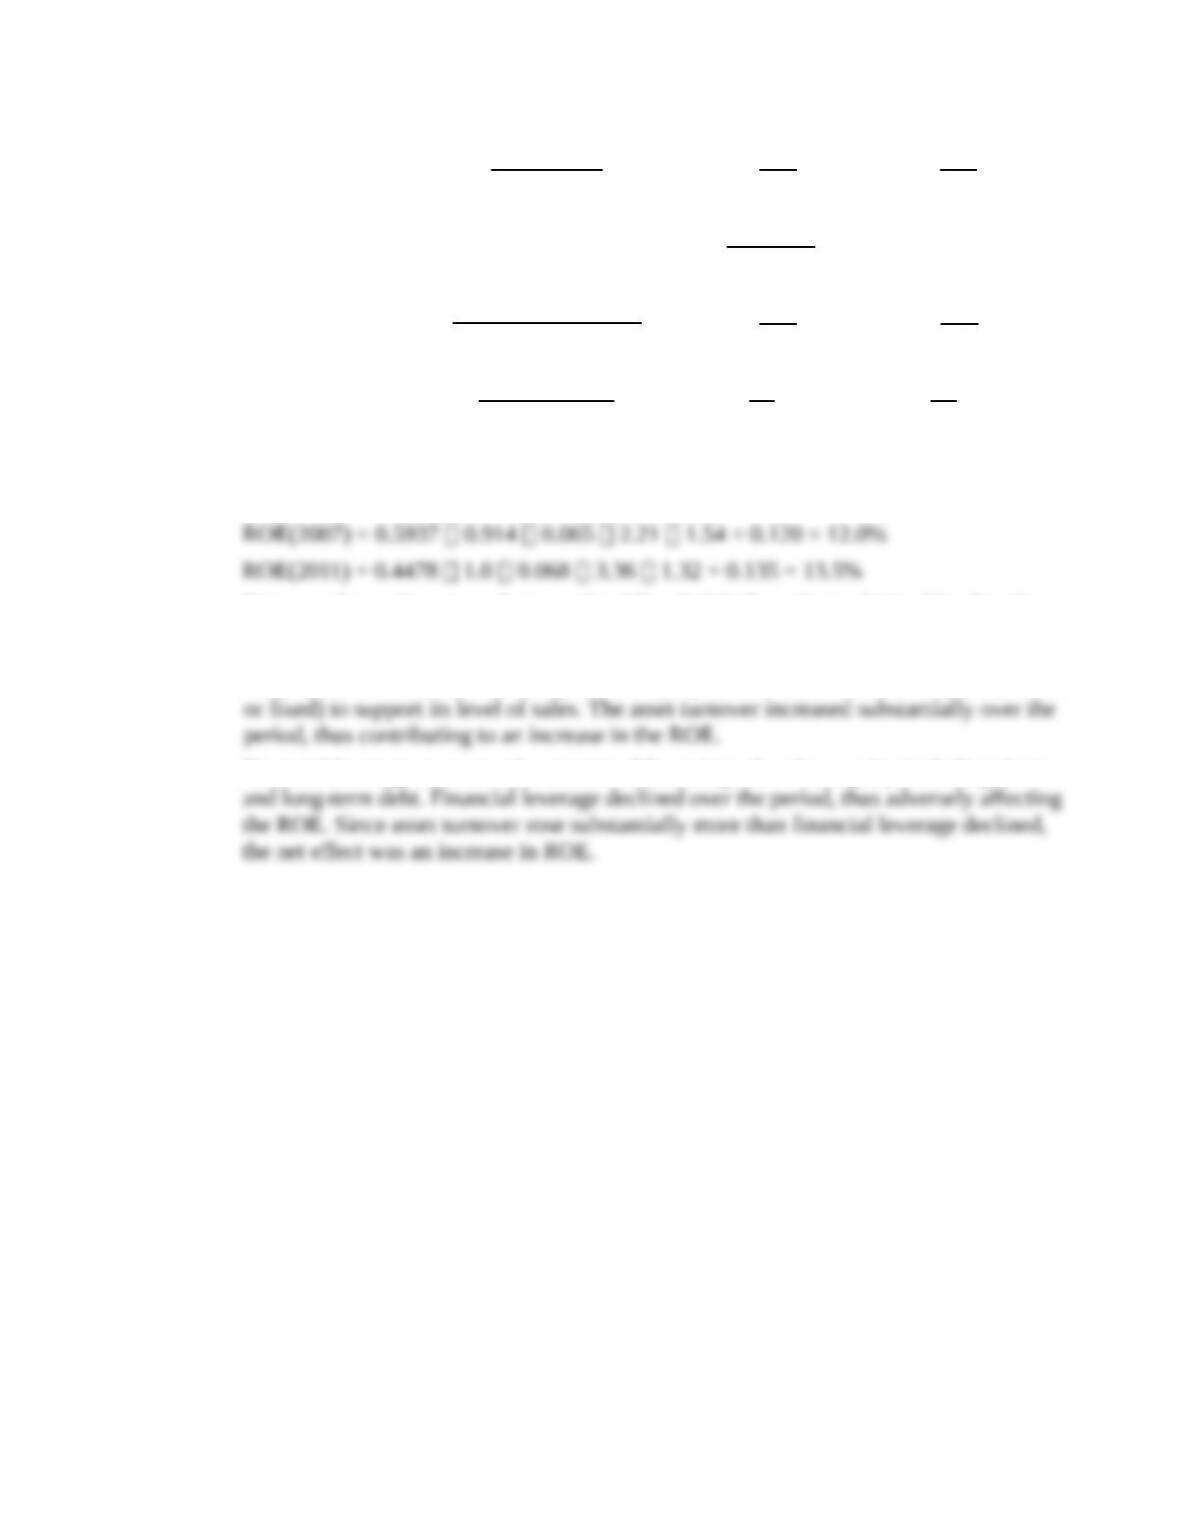
13. a.
2010 2014
(1) Operating margin =
Operating income - Depreciation
Sales
%5.6
542
338
%8.6
979
976
Sales
21.2
542
36.3
979


