
CHAPTER 19: FINANCIAL STATEMENT ANALYSIS
CHAPTER 19: FINANCIAL STATEMENT ANALYSIS
PROBLEM SETS
1. a.
Inventory Turnover Ratio:
$2,850,000 5.88
($480, 000 $490, 000) / 2
Average
COGS
Inventory = =
+
b.
2017
2017
Debt/Equity Ratio in 2017:
$3,340,000 3.48
$960,000
Debt
Equity = =
c.
Cash flow from operating activities in 2017:
Net Income = $ 410,000
+ Depreciation = $ 280,000
– Increase (decrease) in Accounts Receivable = ($ 660,000 – 690,000)
– Increase (decrease) in Inventories = ($ 490,000 – 480,000)
+ Increase (decrease) in Accounts Payable = $ 340,000 – 450,000
Cash Flow from Operator in 2017= $600,000
d.
Average Collection Period:
Receivables ($660,000 $690,000) / 2 44.80 Days
/ 365 $5,500,000 / 365
Average
Sales
+
= =
e.
Asset Turnover Ratio:
$5,500,000 1.32
($4,300,000 4,010,00) / 2
Average
Sales
Assets = =
+
CHAPTER 19: FINANCIAL STATEMENT ANALYSIS
f.
Interest Coverage Ratio:
$870,000 6.69
$130,000
EBIT
Interest Expense = =
g.
Operating Profit Margin or Return on Sales:
$870,000 .16
$5,500,000
EBIT
Sales = =
h.
Return on Equity:
$410,000 .46
‘ ($960,000 810,000) / 2
Average
Net Income
Shareholders Equity = =
+
i.
P/E Ratio:
Price Insufficient Information, unable to calculate
Earnings
share
share
=
j.
Compound Leverage Ratio (CLR)
CLR
$870,000 130,000 ($4,300,000 4,010,000) / 2
$870,000 ($960,000 810,000) / 2
0.8506 4.6949 3.99
Average
Average
Interest Burden Leverage
Assets
EBIT Interest Expense
EBIT Equity
= ´
–
= ´
– +
= ´ +
= ´ =
k.
Net Cash Flow from Operations:
$600,000 (from part c.)
2. The major difference in approach of international financial reporting standards and
U.S. GAAP accounting stems from the difference between principles and rules.
CHAPTER 19: FINANCIAL STATEMENT ANALYSIS
3. Earnings management should not matter in a truly efficient market, where all
publicly available information is reflected in the price of a share of stock. Investors
4. Both credit rating agencies and stock market analysts are likely to be more or less
interested in all of the ratios discussed in this chapter (as well as many other ratios
5. ROA = ROS ATO
The only way that Crusty Pie can have an ROS higher than the industry average
7.
Debt
ROE (1 Tax rate)[ROA (ROA Interest rate) ]
Equity
= – + –
ROEA > ROEB
Firms A and B have the same ROA. Assuming the same tax rate and assuming
19-3
CHAPTER 19: FINANCIAL STATEMENT ANALYSIS
8.
Net income Net income Sales Assets
ROE= = × ×
Equity Sales Assets Equity
= Net profit margin Asset turnover Leverage ratio
9. a. Lower bad debt expense will result in higher operating income.
10. A. Certain GAAP rules can be exploited by companies in order to achieve specific
11. A. Off-balance-sheet financing through the use of operating leases is acceptable
12. A. A warning sign of accounting manipulation is abnormal inventory growth as
13.
14.
Debt
ROE (1 ) [ROA (ROA-Interest rate) ]
Equity
0.03 (0.65) [ROA (ROA 0.06) 0.5]
0.03 0.975 ROA 0.0195
0.975 ROA 0.0495
ROA 0.0508 5.08%
t= – ´ + ´
= ´ + – ´
= ´ –
´ =
= =
Net income Net income Taxable income EBIT Sales Assets
ROE= = × × × ×
Equity Taxable income EBIT Sales Assets Equity
ROE 0.75 0.6 0.1 2.40 1.25 .135 13.5%= ´ ´ ´ ´ = =
CHAPTER 19: FINANCIAL STATEMENT ANALYSIS
15.
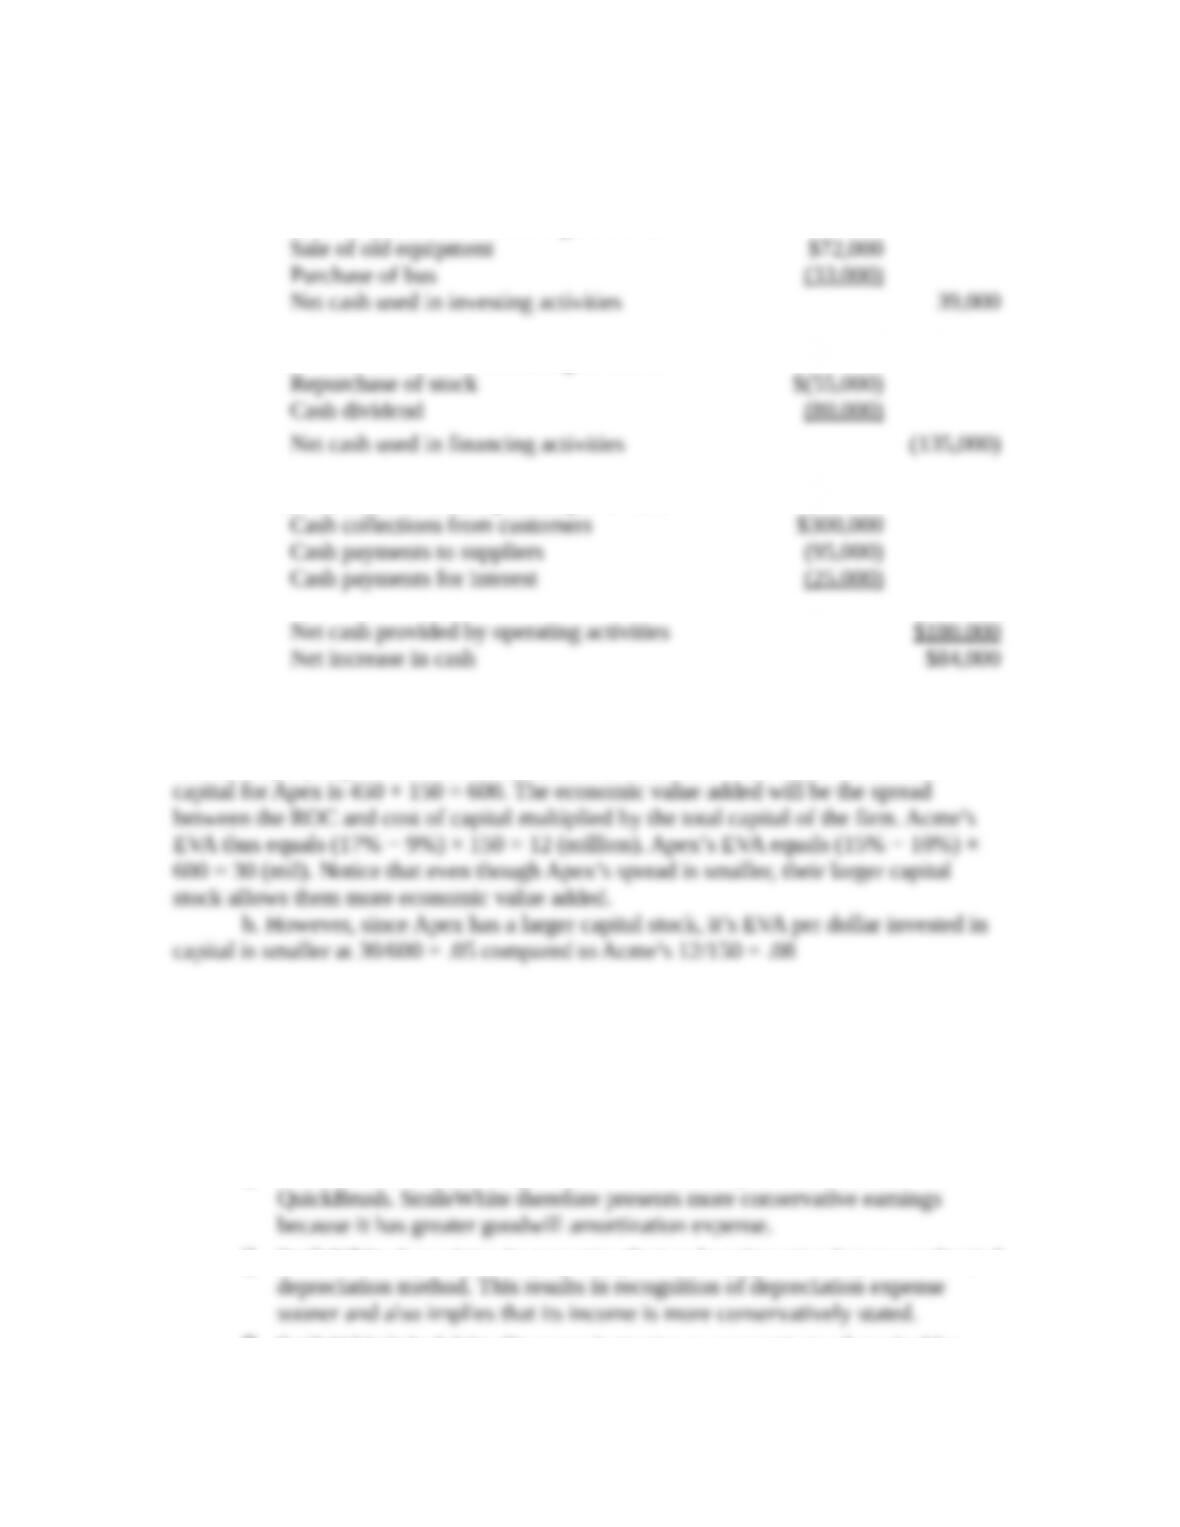
a. Cash flows from investing activities
b. Cash flows from financing activities
c. Cash flows from operating activities
16. a. The total capital of the firms must first be calculated by adding their respective
debt and equity together. The total capital for Acme is 100 + 50 = 150, and the total
CFA PROBLEMS
1. SmileWhite has higher quality of earnings for the following reasons:
SmileWhite amortizes its goodwill over a shorter period than does
SmileWhite depreciates its property, plant and equipment using an accelerated
SmileWhite’s bad debt allowance is greater as a percentage of receivables.
SmileWhite is recognizing greater bad-debt expense than QuickBrush. If
19-5
CHAPTER 19: FINANCIAL STATEMENT ANALYSIS
2. a.
Equity
Assets
Assets
Sales
Sales
profitsNet
Equity
profitsNet
ROE
= Net profit margin Total asset turnover Assets/equity
b.
475 4,750 2,950
ROE 10% 1.61 1.40 .2262, or 22.62%
4,750 2,950 2,100
= ´ ´ = ´ ´ =
c. g = ROE Plowback
1.79 0.55
22.62% 15.67%
1.79
–
= ´ =
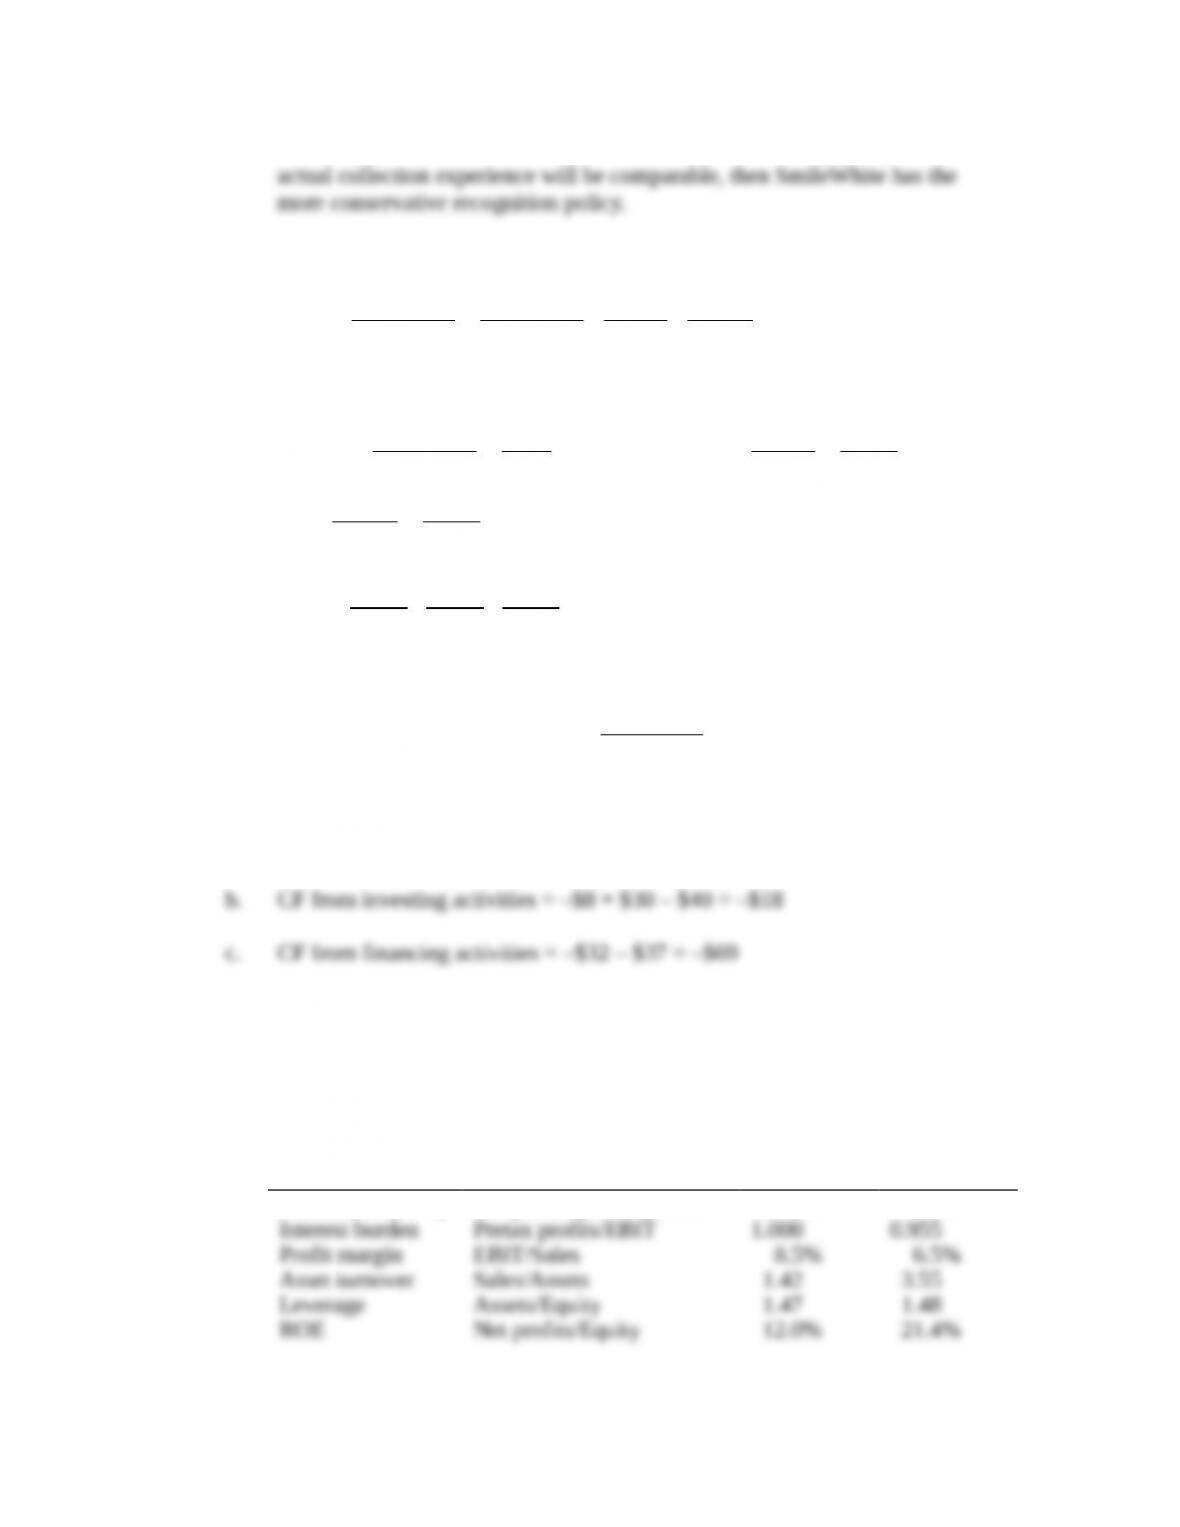
3. a. CF from operating activities = $260 – $85 – $12 – $35 = $128
4. a. QuickBrush has had higher sales and earnings growth (per share) than
SmileWhite. Margins are also higher. But this does not mean that QuickBrush
is necessarily a better investment. SmileWhite has a higher ROE, which has
been stable, while QuickBrush’s ROE has been declining. We can see the
source of the difference in ROE using DuPont analysis:
Component Definition QuickBrush SmileWhite
Tax burden (1 – t) Net profits/pretax profits 67.4% 66.0%
19-6
Sales 4,750 1.61
Assets 2,950
= =
Net profits 475 0.100 10%
Sales 4750
= = =
Assets 2,950 1.40
Equity 2,100
= =
CHAPTER 19: FINANCIAL STATEMENT ANALYSIS
While tax burden, interest burden, and leverage are similar, profit margin and
asset turnover differ. Although SmileWhite has a lower profit margin, it has a far
higher asset turnover.
Sustainable growth = ROE Plowback ratio
ROE
Plowback
Ratio
Sustainable
Growth
Rate
Ludlow’s
Estimate of
Growth
Rate
QuickBrush
12.0%
1.00
12.0%
30%
SmileWhite 21.4 0.34 7.3 10
Ludlow has overestimated the sustainable growth rate for both companies.
b. QuickBrush’s recent EPS growth has been achieved by increasing book value
Book value per share can increase either by retaining earnings or by issuing new
19-7