CFA PROBLEMS
1. a. This director is confused. In the context of the constant growth model
[i.e., P0 = D1/ k – g)], it is true that price is higher when dividends are higher holding
b. (i) An increase in dividend payout will reduce the sustainable growth rate as less
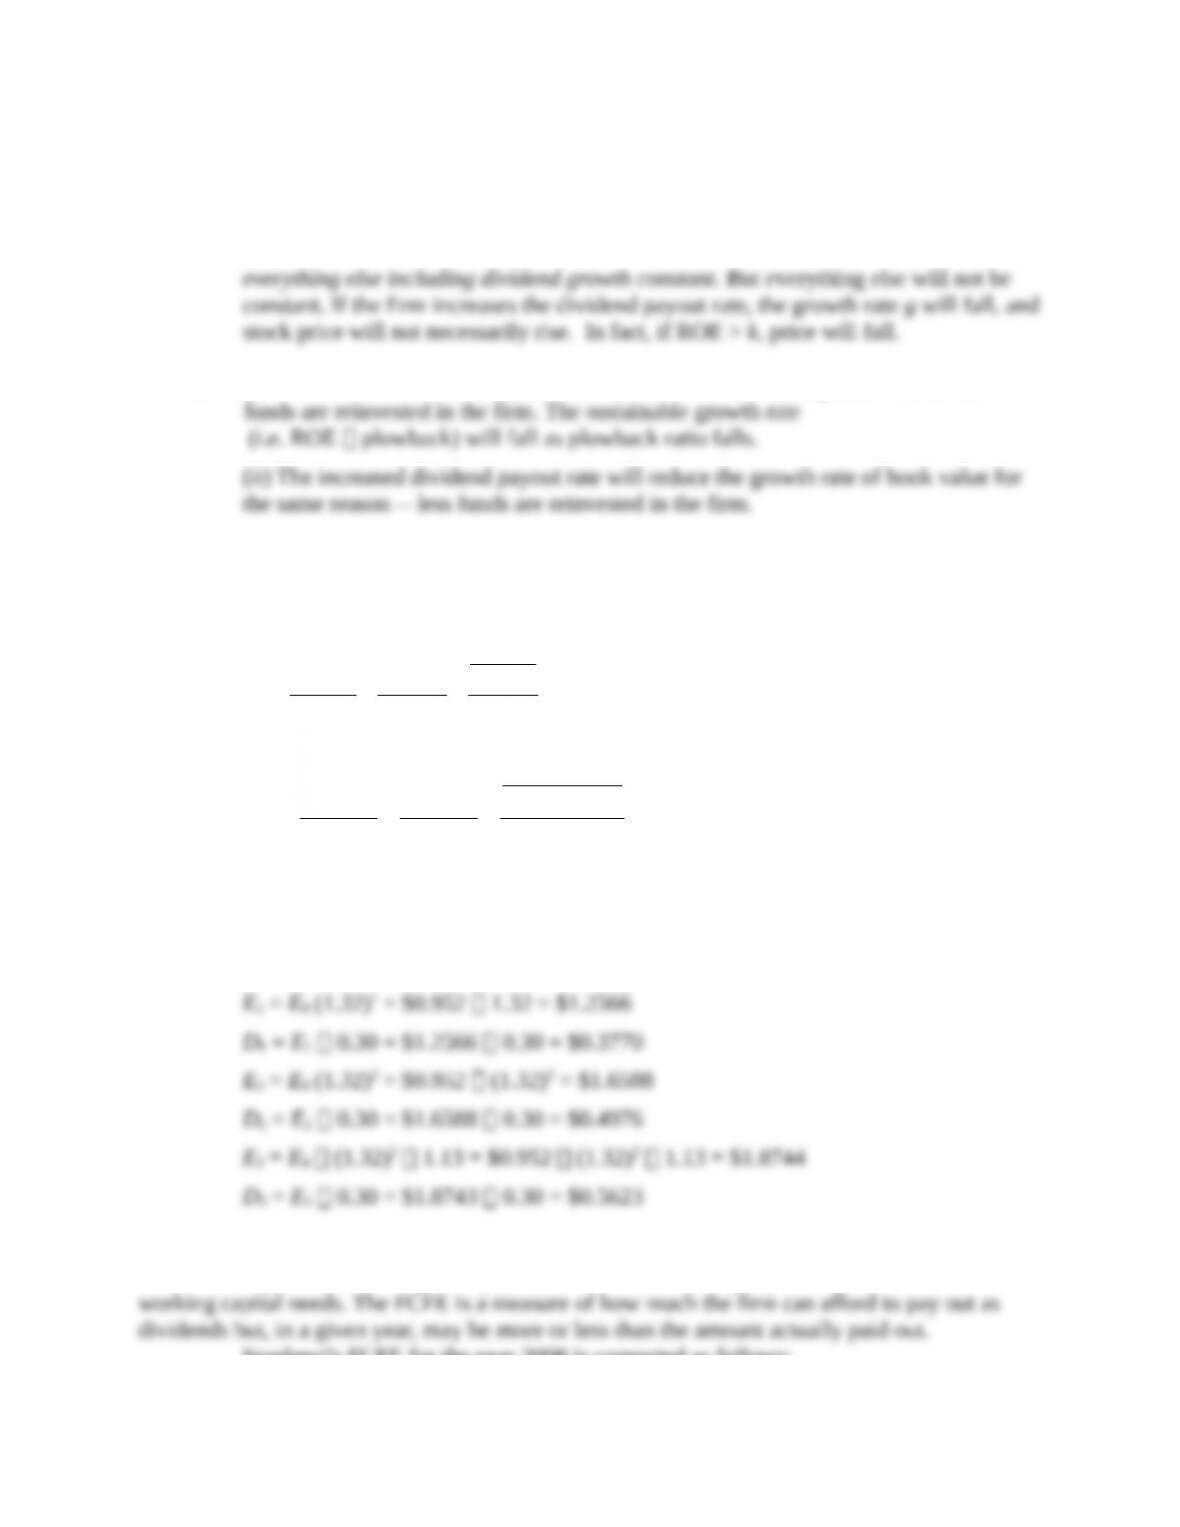
2. Using a two-stage dividend discount model, the current value of a share of Sundanci is
calculated as follows.
3
1 2
01 2 2
( )
(1 ) (1 ) (1 )
D
D D k g
Vk k k
–
= + +
+ + +
98.43$
14.1
)13.014.0(
5623.0$
14.1
4976.0$
14.1
3770.0$
221
where:
E0 = $0.952
D0 = $0.286
3. a.Free cash flow to equity (FCFE) is defined as the cash flow remaining after meeting all
financial obligations (including debt payment) and after covering capital expenditure and
Sundanci’s FCFE for the year 2008 is computed as follows:
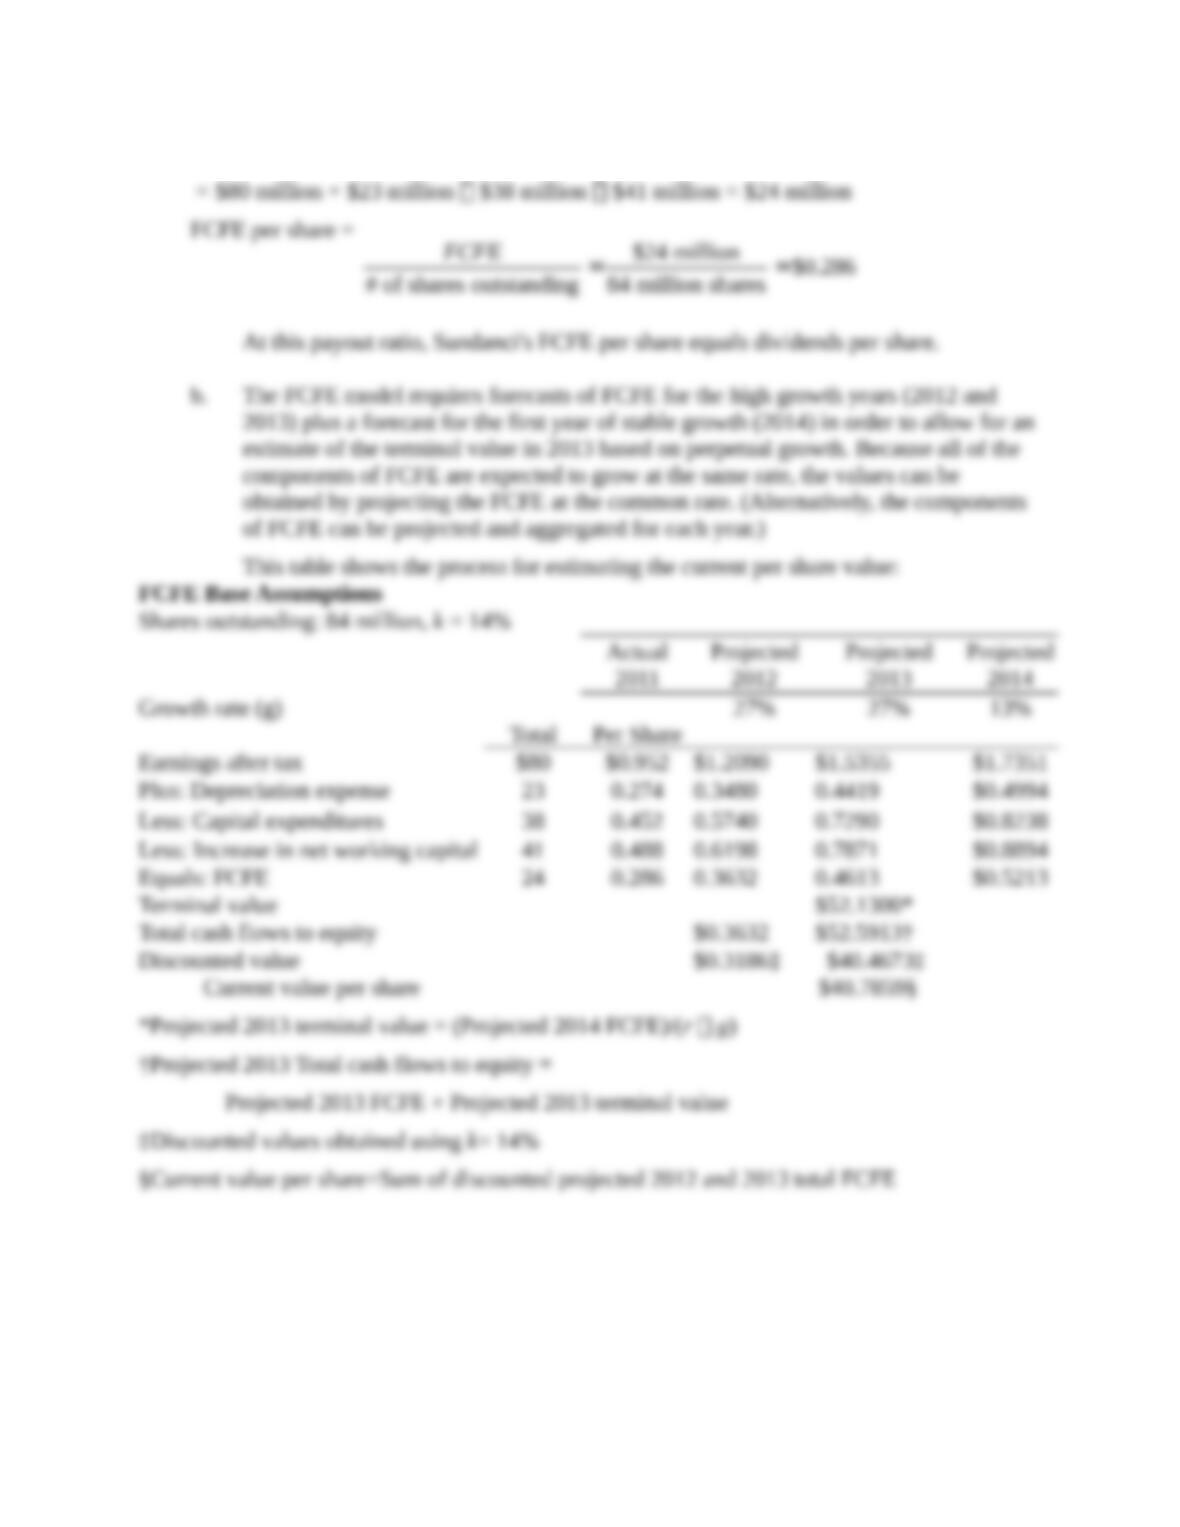
FCFE = Earnings + Depreciation Capital expenditures Increase in NWC
c. i. The DDM uses a strict definition of cash flows to equity, i.e. the expected dividends on
the common stock. In fact, taken to its extreme, the DDM cannot be used to estimate the
value of a stock that pays no dividends. The FCFE model expands the definition of cash
flows to include the balance of residual cash flows after all financial obligations and
ii. Both two-stage valuation models allow for two distinct phases of growth, an initial
finite period where the growth rate is abnormal, followed by a stable growth period that is
expected to last indefinitely. These two-stage models share the same limitations with
respect to the growth assumptions. First, there is the difficulty of defining the duration of
4. a. The formula for calculating a price earnings ratio (P/E) for a stable growth firm is the
dividend payout ratio divided by the difference between the required rate of return
and the growth rate of dividends. If the P/E is calculated based on trailing earnings
(year 0), the payout ratio is increased by the growth rate. If the P/E is calculated based
on next year’s earnings (year 1), the numerator is the payout ratio.
P/E on trailing earnings:
P/E on next year’s earnings:
b. The P/E ratio is a decreasing function of riskiness; as risk increases, the P/E ratio
The P/E ratio is an increasing function of the growth rate of the firm; the higher the
The P/E ratio is a decreasing function of the market risk premium. An increased market
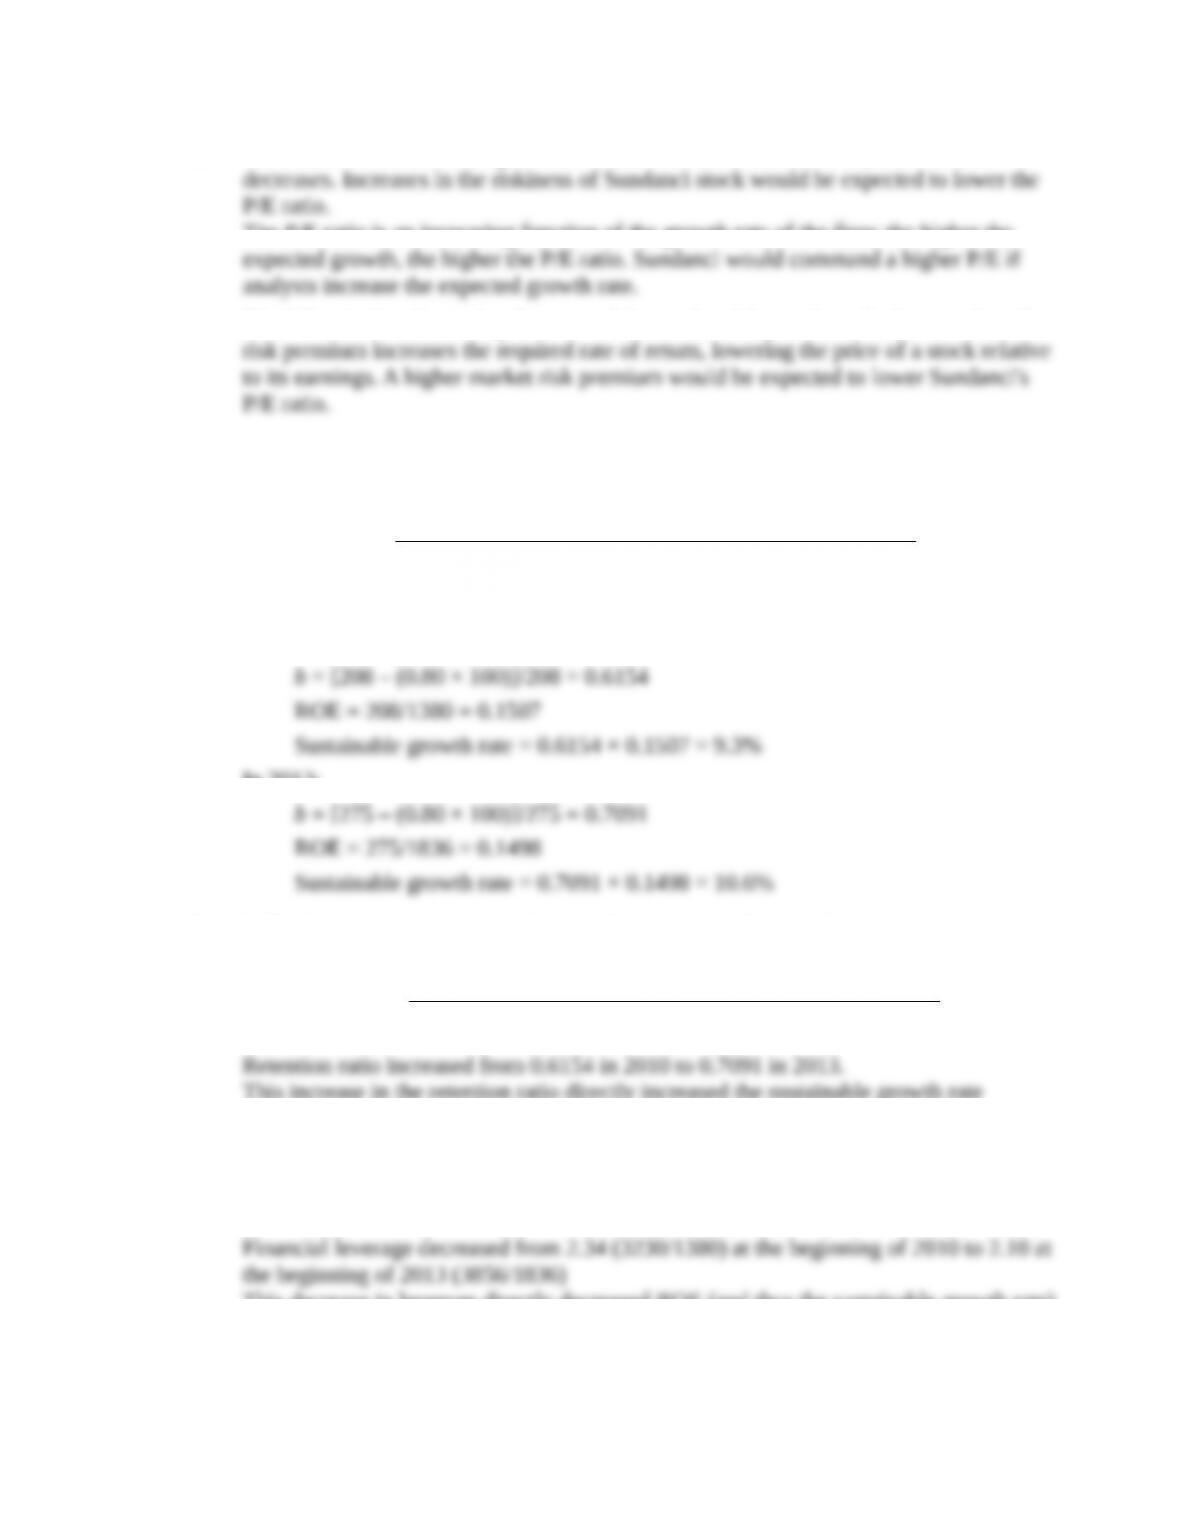
5. a. The sustainable growth rate is equal to:
Plowback ratio × Return on equity = b × ROE
Net income – (Dividends per share Shares outstanding)
where Net income
b´
=
ROE = Net income/Beginning of year equity
In 2010:
In 2013:
b. i. The increased retention ratio increased the sustainable growth rate.
Retention ratio =
[Net income – (Dividend per share Shares outstanding)]
Net income
´
This increase in the retention ratio directly increased the sustainable growth rate
because the retention ratio is one of the two factors determining the sustainable growth
rate.
ii. The decrease in leverage reduced the sustainable growth rate.
Financial leverage = (Total assets/Beginning of year equity)
This decrease in leverage directly decreased ROE (and thus the sustainable growth rate)
because financial leverage is one of the factors determining ROE (and ROE is one of the
two factors determining the sustainable growth rate).
6. a. The formula for the Gordon model is
0
0
(1 )D g
Vk g
´ +
=–
where:
D0 = Dividend paid at time of valuation
g = Annual growth rate of dividends
k = Required rate of return for equity
In the above formula, P0, the market price of the common stock, substitutes for V0 and
g becomes the dividend growth rate implied by the market:
P0 = [D0 × (1 + g)]/(k – g)
Substituting, we have:
b. Use of the Gordon growth model would be inappropriate to value Dynamic’s
common stock, for the following reasons:
i. The Gordon growth model assumes a set of relationships about the growth rate for
dividends, earnings, and stock values. Specifically, the model assumes that dividends,
earnings, and stock values will grow at the same constant rate. In valuing Dynamic’s
ii. It could also be argued that use of the Gordon model, given Dynamic’s current
7. a. The industry’s estimated P/E can be computed using the following model:
0
1
Payout ratio
P
E k g
=–
However, since k and g are not explicitly given, they must be computed using the
following formulas:
kind = Government bond yield + ( Industry beta Equity risk premium)
Therefore:
0
1
0.60 30.0
0.12 0.10
P
E= =
–
b. i. Forecast growth in real GDP would cause P/E ratios to be generally higher for
ii. Government bond yield would cause P/E ratios to be generally higher for Country
iii. Equity risk premium would cause P/E ratios to be generally higher for Country B.
A lower equity risk premium implies a lower required return and a higher P/E.
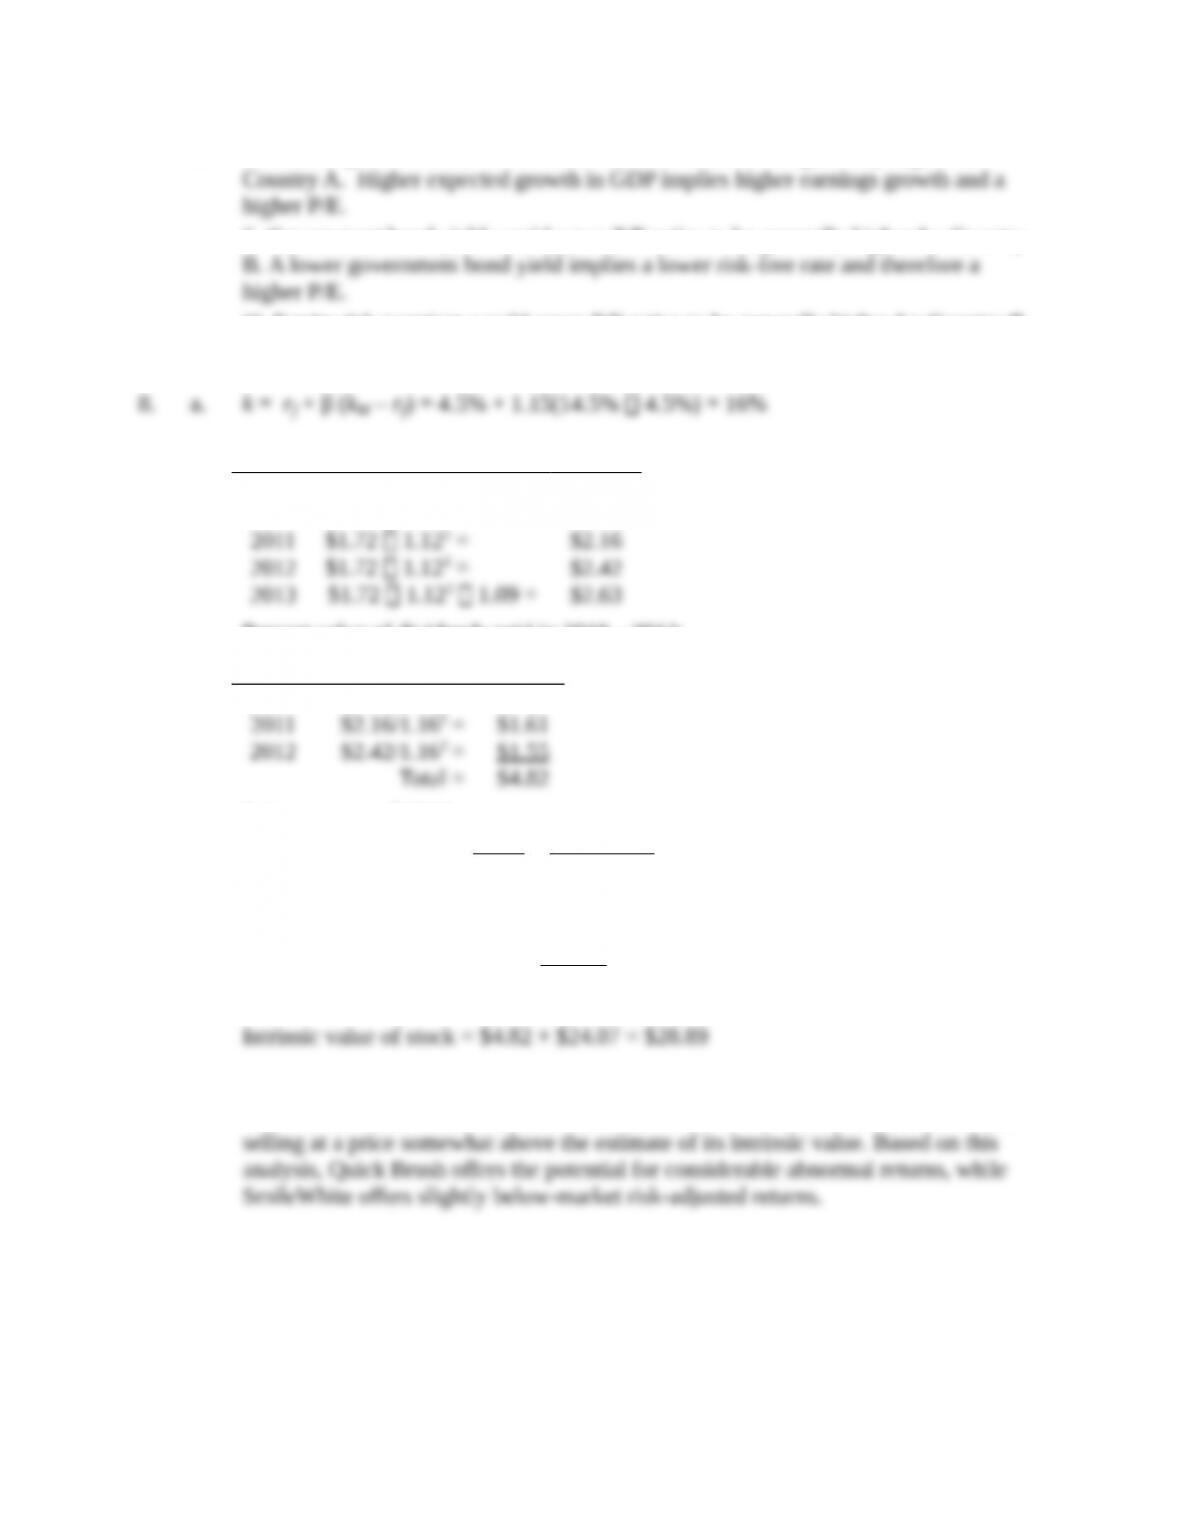
b. Year Dividend
2009
$1.72
2010 $1.72 1.12 = $1.93
Present value of dividends paid in 2010 – 2012:
Year PV of Dividend
2010
$1.93/1.161 =
$1.66
Price at year-end 2012
57.37$
09.016.0
63.2$2013
gk
D
PV in 2009 of this stock price
07.24$
16.1
57.37$
3
Intrinsic value of stock = $4.82 + $24.07 = $28.89
c. The data in the problem indicate that Quick Brush is selling at a price substantially
below its intrinsic value, while the calculations above demonstrate that SmileWhite is
d. Strengths of two-stage versus constant growth DDM:
Two-stage model allows for separate valuation of two distinct periods in a
Two-stage model allows for initial period of above-sustainable growth. It allows the
A weakness of all DDMs is that they are very sensitive to input values. Small changes
9. a. The value of a share of Rio National equity using the Gordon growth model and the
Calculate the required rate of return using the capital asset pricing model:
Calculate the share value using the Gordon growth model:
o
0
(1 ) $0.20 (1 0.12) $22.40
0.13 0.12
D g
Pk g
´ + ´ +
= = =
– –
b. The sustainable growth rate of Rio National is 9.97%, calculated as follows:
g = b × ROE = Earnings retention rate × ROE = (1 – Payout ratio) × ROE =
Dividends Net income $3.20 $30.16
1 1 0.0997 9.97%
Net income Beginning equity $30.16 $270.35
æ ö æ ö
– ´ = – ´ = =
ç ÷ ç ÷
è ø è ø
10. a. To obtain free cash flow to equity (FCFE), the two adjustments that Shaar should
make to cash flow from operations (CFO) are:
1. Subtract investment in fixed capital: CFO does not take into account the investing
2. Add net borrowing: CFO does not take into account the amount of capital supplied
b. Note 1: Rio National had $75 million in capital expenditures during the year.
Adjustment: negative $75 million
Note 2: A piece of equipment that was originally purchased for $10 million was sold for
Adjustment: positive $3 million
In calculating FCFE, only cash flow investments in fixed capital should be considered.
The $7 million sale price of equipment is a cash inflow now available to equity holders
Note 3: The decrease in long-term debt represents an unscheduled principal
repayment; there was no new borrowing during the year.
Note 4: On January 1, 2013, the company received cash from issuing 400,000
shares of common equity at a price of $25 per share.
Note 5: A new appraisal during the year increased the estimated market value of land
held for investment by $2 million, which was not recognized in 2013 income.
c. Free cash flow to equity (FCFE) is calculated as follows:
FCFE = NI + NCC – FCINV – WCINV + Net borrowing
where:
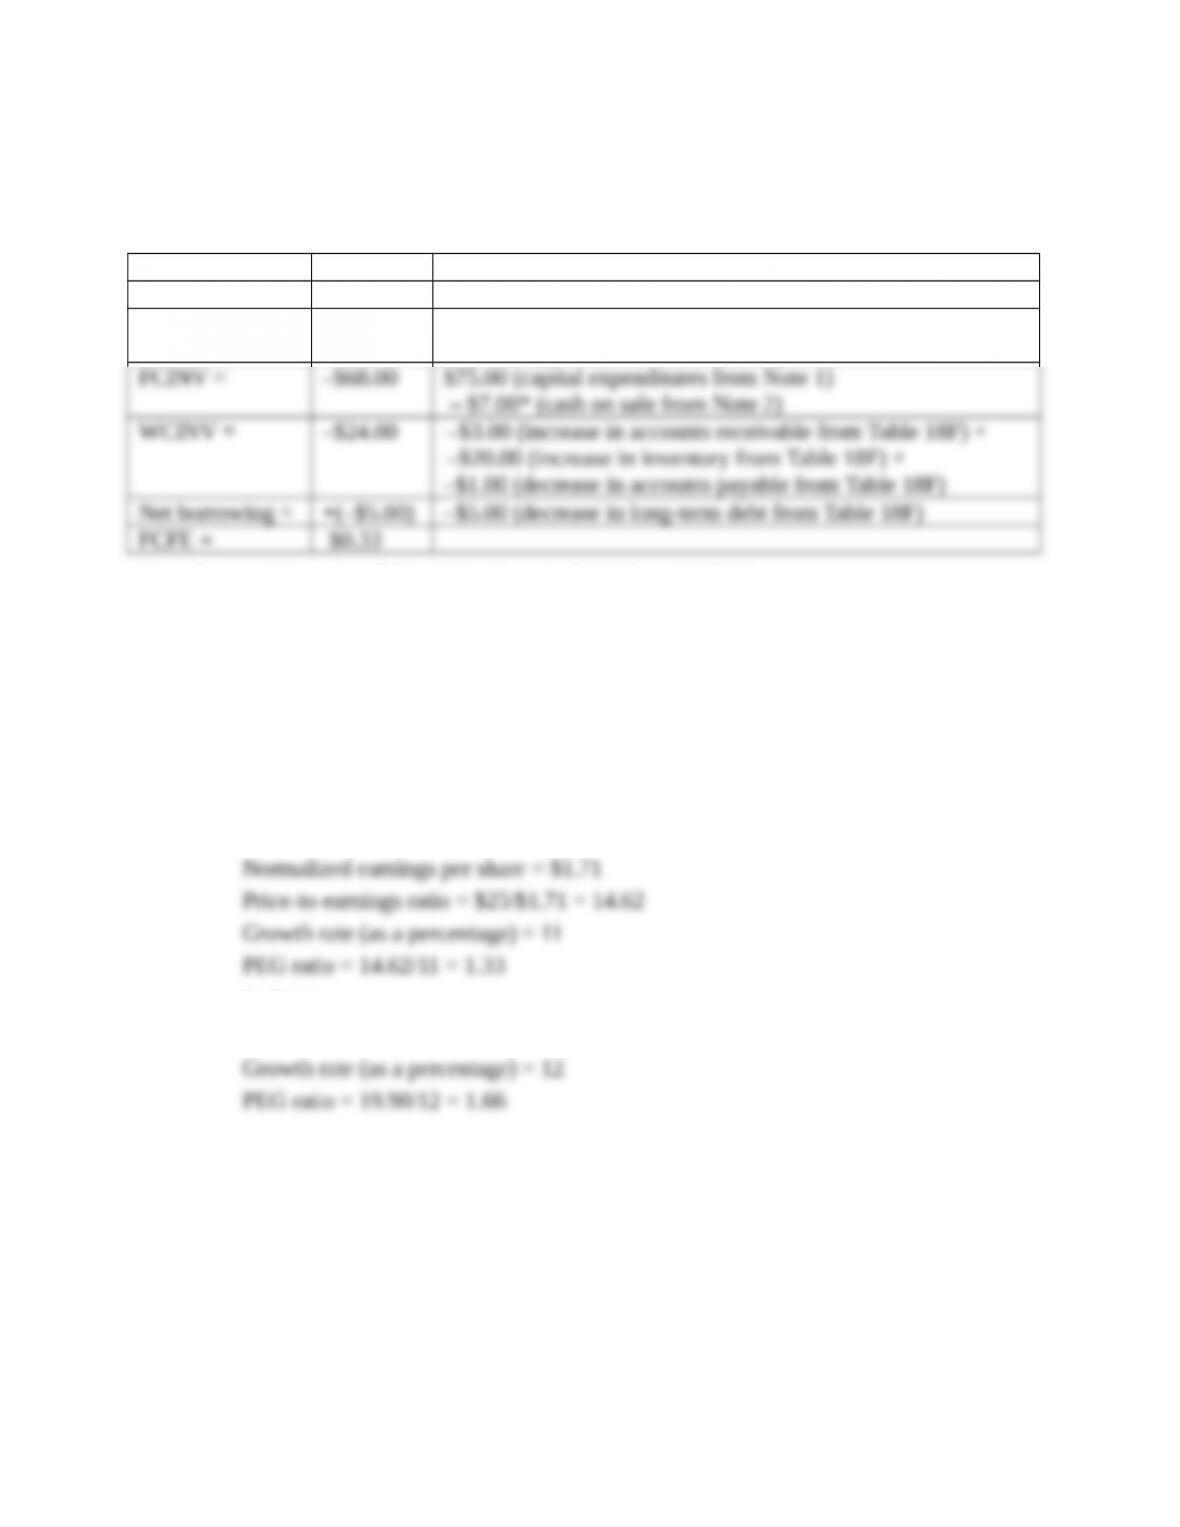
NCC = Noncash charges
FCINV = Investment in fixed capital
WCINV = Investment in working capital
Million $ Explanation
NI = $30.16 From Table 18G
NCC = +$67.17 $71.17 (depreciation and amortization from Table 18G)
– $4.00* (gain on sale from Note 2)
*Supplemental Note 2 in Table 18H affects both NCC and FCINV.
11. Rio National’s equity is relatively undervalued compared to the industry on a P/E-to-growth
(PEG) basis. Rio National’s PEG ratio of 1.33 is below the industry PEG ratio of 1.66. The
lower PEG ratio is attractive because it implies that the growth rate at Rio National is available
at a relatively lower price than is the case for the industry. The PEG ratios for Rio National and
the industry are calculated below:
Rio National
Current price = $25.00
Industry
Price-to-earnings ratio = 19.90