
CHAPTER 12: BEHAVIORAL FINANCE AND TECHNICAL ANALYSIS
CHAPTER 12: BEHAVIORAL FINANCE
AND TECHNICAL ANALYSIS
PROBLEM SETS
1. Technical analysis can generally be viewed as a search for trends or patterns in
market prices. Technical analysts tend to view these trends as momentum, or
gradual adjustments to ‘correct’ prices, or, alternatively, reversals of trends. A
number of the behavioral biases discussed in the chapter might contribute to such
2. Even if many investors exhibit behavioral biases, security prices might still be set
efficiently if the actions of arbitrageurs move prices to their intrinsic values.
Arbitrageurs who observe mispricing in the securities markets would buy
3. One of the major factors limiting the ability of rational investors to take advantage
of any ‘pricing errors’ that result from the actions of behavioral investors is the fact
that a mispricing can get worse over time. An example of this fundamental risk is
the apparent ongoing overpricing of the NASDAQ index in the late 1990s. Related
12-1

CHAPTER 12: BEHAVIORAL FINANCE AND TECHNICAL ANALYSIS
4. There are two reasons why behavioral biases might not affect equilibrium asset
prices: first, behavioral biases might contribute to the success of technical trading
In addition, an investor should be aware of his personal behavioral biases, even if
5. Efficient market advocates believe that publicly available information (and, for
advocates of strong-form efficiency, even insider information) is, at any point in
time, reflected in securities prices, and that price adjustments to new information
occur very quickly. Consequently, prices are at fair levels so that active
6. a. Davis uses loss aversion as the basis for her decision making. She holds on to
7. a. Shrum refuses to follow a stock after she sells it because she does not want to
8. a. Investors attempt to avoid regret by holding on to losers hoping the stocks will
12-2

CHAPTER 12: BEHAVIORAL FINANCE AND TECHNICAL ANALYSIS
9. a. iv
10. Underlying risks still exist even during a mispricing event. The market mispricing
11. Data mining is the process by which patterns are pulled from data. Technical
12. Even if prices follow a random walk, the existence of irrational investors combined
with the limits to arbitrage by arbitrageurs may allow persistent mispricings to be
13. Trin =
advancing Number/advancing Volume
declining Number/declining Volume
=
388, 278 / 896 0.77
1,075,611/1905 =
14. Breadth:
Breadth is positive—bullish signal (no one would actually use a one-day measure).
12-3
Advances Declines Net Advances
2,070
1,003
1,067

CHAPTER 12: BEHAVIORAL FINANCE AND TECHNICAL ANALYSIS
15. This exercise is left to the student; answers will vary, but successful students should
16. The confidence index increases from (5%/6%) = 0.833 to (6%/7%) = 0.857.
This indicates slightly higher confidence which would be interpreted by
17. At the beginning of the period, the price of Computers, Inc. divided by the industry
index was 0.39; by the end of the period, the ratio had increased to 0.50. As the ratio
18. Five day moving averages:
Days 2 – 6 = 21.13
Days 3 – 7 = 21.50
Days 4 – 8 = 21.90
Days 5 – 9 = 22.13
Days 6 – 10 = 22.68
Days 7 – 11 = 23.18
Days 9 – 13 = 23.38
Days 10 – 14 = 23.15
Days 11 – 15 = 22.50
Days 12 – 16 = 21.65
Days 13 – 17 = 20.95
Days 14 – 18 = 20.28
Days 15 – 19 = 19.38
Days 16 – 20 = 19.05
Days 18 – 22 = 19.28
Days 19 – 23 = 19.93
Days 20 – 24 = 21.05
12-4

CHAPTER 12: BEHAVIORAL FINANCE AND TECHNICAL ANALYSIS
Days 30 – 34 = 28.20
Days 31 – 35 = 28.45
19. This pattern shows a lack of breadth. Even though the index is up, more stocks
declined than advanced, which indicates a “lack of broad-based support” for the rise
in the index.
20.
Day Advances Declines
Net
Advances
Cumulative
Breadth
1
906
704
202
202
2 653 986 -333 -131
The signal is bearish as cumulative breadth is negative; however, the negative
number is declining in magnitude, indicative of improvement. Perhaps the worst
of the bear market has passed.
21. Trin =
/ 440 million / 704 1.07
/ 530 million / 906
Volume declining Number declining
Volume advancing Number advancing = =
This is a slightly bearish indicator, with average volume in advancing issues a bit
smaller than average volume in declining issues.
22. Confidence Index =
bonds corporate grade-teintermediaon Yield
bonds corporate rated-on top Yield
12-5

CHAPTER 12: BEHAVIORAL FINANCE AND TECHNICAL ANALYSIS
Thus, the confidence index is decreasing.
12-6
CHAPTER 12: BEHAVIORAL FINANCE AND TECHNICAL ANALYSIS
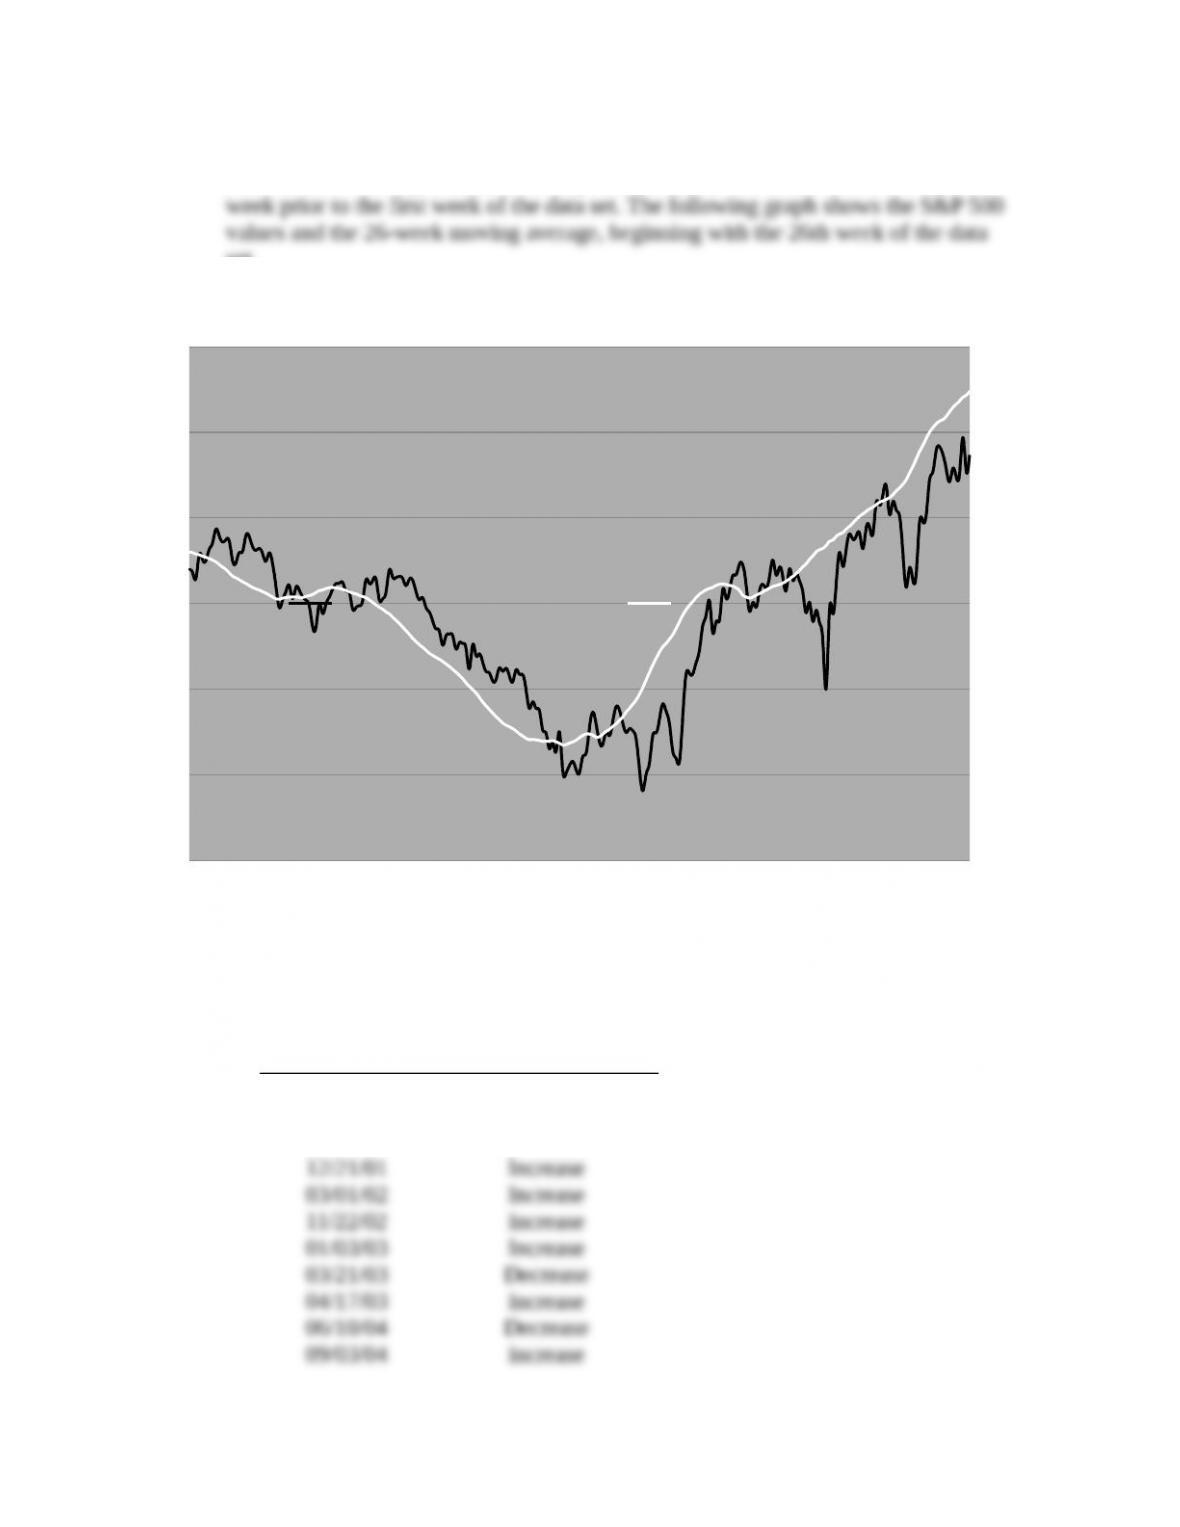
23. Note: In order to create the 26-week moving average for the S&P 500, we
converted the weekly returns to weekly index values, with a base of 100 for the
set.
a. The graph summarizes the data for the 26-week moving average. The graph
also shows the values of the S&P 500 index.
S&P 500 Index Values 26 Week Moving Average
b. The S&P 500 crosses through its moving average from below 14 times, as
indicated in the table below. The index increases seven times in weeks
following a cross-through and decreases seven times.
Date of
Cross-Through
Direction of S&P 500
in Subsequent Week
05/18/01 Decrease
06/08/01 Decrease
12/07/01 Decrease
12-7

CHAPTER 12: BEHAVIORAL FINANCE AND TECHNICAL ANALYSIS
12-8
CHAPTER 12: BEHAVIORAL FINANCE AND TECHNICAL ANALYSIS
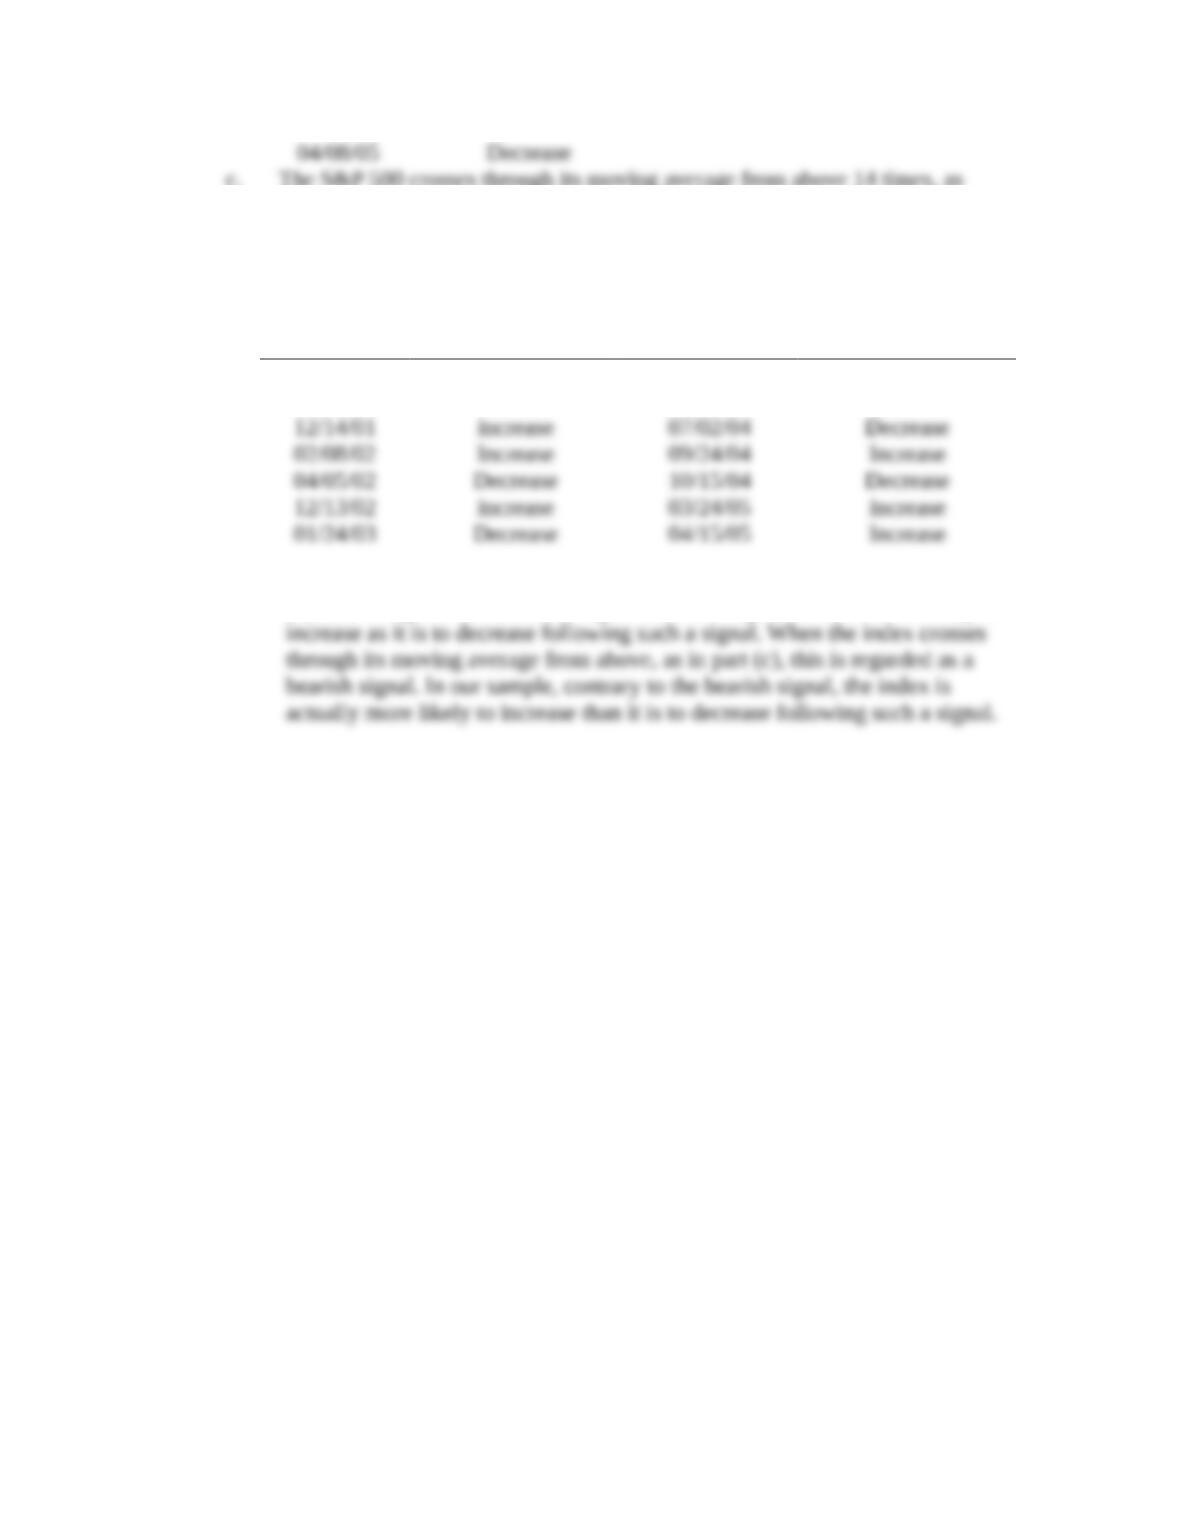
c. The S&P 500 crosses through its moving average from above 14 times, as
indicated in the table below. The index increases nine times in weeks
following a cross-through and decreases five times.
Date of
Cross-Throug
h
Direction of S&P
500 in Subsequent
Week
Date of
Cross-
Through
Direction of S&P
500 in Subsequent
Week
06/01/01 Increase 03/28/03 Increase
06/15/01 Increase 04/30/04 Decrease
d. When the index crosses through its moving average from below, as in part
(b), this is regarded as a bullish signal. In our sample, the index is as likely to
12-9