
Chapter 03: Financial Analysis
COMPREHENSIVE PROBLEM
Comprehensive Problem 1.
Lamar Swimwear (trend analysis and industry comparisons)(LO3) Bob Adkins has recently
been approached by his first cousin, Ed Lamar, with a proposal to buy a 15 percent interest in
Lamar Swimwear. The firm manufactures stylish bathing suits and sunscreen products.
Mr. Lamar is quick to point out the increase in sales that has taken place over the last three years
as indicated in the income statement, Exhibit 1. The annual growth rate is 25 percent. A balance
sheet for a similar time period is shown in Exhibit 2, and selected industry ratios are presented in
Exhibit 3. Note the industry growth rate in sales is only 10 to 12 percent per year.
There was a steady real growth of 3 to 4 percent in gross domestic product during the period
under study.
Comprehensive Problem 1 (Continued)
Exhibit 1
LAMAR SWIMWEAR
Income Sheet
20X1 20X2 20X3
Sales (all on credit)……………………………………… $1,200,000 $1,500,000 $1,875,000
Cost of goods sold……………………………………….. 800,000 1,040,000 1,310,000
Gross profit………………………………………………… $ 400,000 $ 460,000 $ 565,000
Selling and administrative expense*………………. 239,900 274,000 304,700
Operating profit (EBIT)……………………………….. $ 160,100 $ 186,000 $ 260,300
Interest expense…………………………………………… 35,000 45,000 85,000
Net income before taxes………………………………. $ 125,100 $ 141,000 $ 175,300
Taxes…………………………………………………………. 36,900 49,200 55,600
Net income…………………………………………………. $ 88,200 $ 91,800 $ 119,700
Shares………………………………………………………… 30,000 30,000 38,000
Earnings per share……………………………………….. $ 2.94 $ 3.06 $ 3.15
*Includes $15,000 in lease payments for each year.
Exhibit 2
LAMAR SWIMWEAR
Balance Sheet
Assets 20X1 20X2 20X3
Cash………………………………………………………….. $ 30,000 $ 40,000 $ 30,000
Marketable securities…………………………………… 20,000 25,000 30,000
Accounts receivable…………………………………….. 170,000 259,000 360,000
Inventory……………………………………………………. 230,000 261,000 290,000
Total current assets…………………………………… $ 450,000 $ 585,000 $ 710,000
Net plant and equipment………………………………. 650,000 765,000 1,390,000
Copyright © 2017 McGraw-Hill Education. All rights reserved. No reproduction or distribution without the prior written consent
of McGraw-Hill Education.

Chapter 03: Financial Analysis
Total assets…………………………………………………. $1,100,000 $1,350,000 $ 2,100,000
Liabilities and Stockholders’ Equity
Accounts payable………………………………………… $ 200,000 $ 310,000 $ 505,000
Accrued expenses……………………………………….. 20,400 30,000 35,000
Total current liabilities……………………………… $ 220,400 $ 340,000 $ 540,000
Long-term liabilities……………………………………. 325,000 363,600 703,900
Total liabilities………………………………………… $ 545,400 $ 703,600 $ 1,243,900
Common stock ($2 par)……………………………….. 60,000 60,000 76,000
Capital paid in excess of par…………………………. 190,000 190,000 264,000
Retained earnings………………………………………… 304,600 396,400 516,100
Total stockholders’ equity…………………………. $ 554,600 $ 646,400 $ 856,100
Total liabilities and stockholders’ equity………… $1,100,000 $1,350,000 $2, 100,000
Exhibit 3
Selected Industry Ratios
20X1 20X2 20X3
Growth in sales…………………………….. — 10.00% 12.00%
Profit margin………………………………… 7.71% 7.82% 7.96%
Return on assets (investment)…………. 7.94% 8.86% 8.95%
Return on equity……………………………. 14.31% 15.26% 16.01%
Receivable turnover………………………. 9.02x 8.86x 9.31x
Average collection period………………. 39.9 days 40.6 days 38.7 days
Inventory turnover………………………… 4.24x 5.10x 5.11x
Fixed asset turnover………………………. 1.60x 1.64x 1.75x
Total asset turnover……………………….. 1.05x 1.10x 1.12x
Current ratio…………………………………. 1.96x 2.25x 2.40x
Quick ratio…………………………………… 1.37x 1.41x 1.38x
Debt to total assets………………………… 43.47% 43.11% 44.10%
Times interest earned…………………….. 6.50x 5.99x 6.61x
Fixed charge coverage…………………… 4.70x 4.69x 4.73x
Growth in EPS……………………………… — 10.10% 13.30%
The stock in the corporation has become available due to the ill health of a current stockholder,
who is in need of cash. The issue here is not to determine the exact price for the stock, but rather
whether Lamar Swimwear represents an attractive investment situation. Although Mr. Adkins has
a primary interest in the profitability ratios, he will take a close look at all the ratios. He has no
fast and firm rules about required return on investment, but rather wishes to analyze the overall
condition of the firm. The firm does not currently pay a cash dividend, and return to the investor
must come from selling the stock in the future. After doing a thorough analysis (including ratios
for each year and comparisons to the industry), what comments and recommendations do you
offer to Mr. Adkins?
CP 3-1. Solution:
Lamar Swimwear
Copyright © 2017 McGraw-Hill Education. All rights reserved. No reproduction or distribution without the prior written consent
of McGraw-Hill Education.
Chapter 03: Financial Analysis
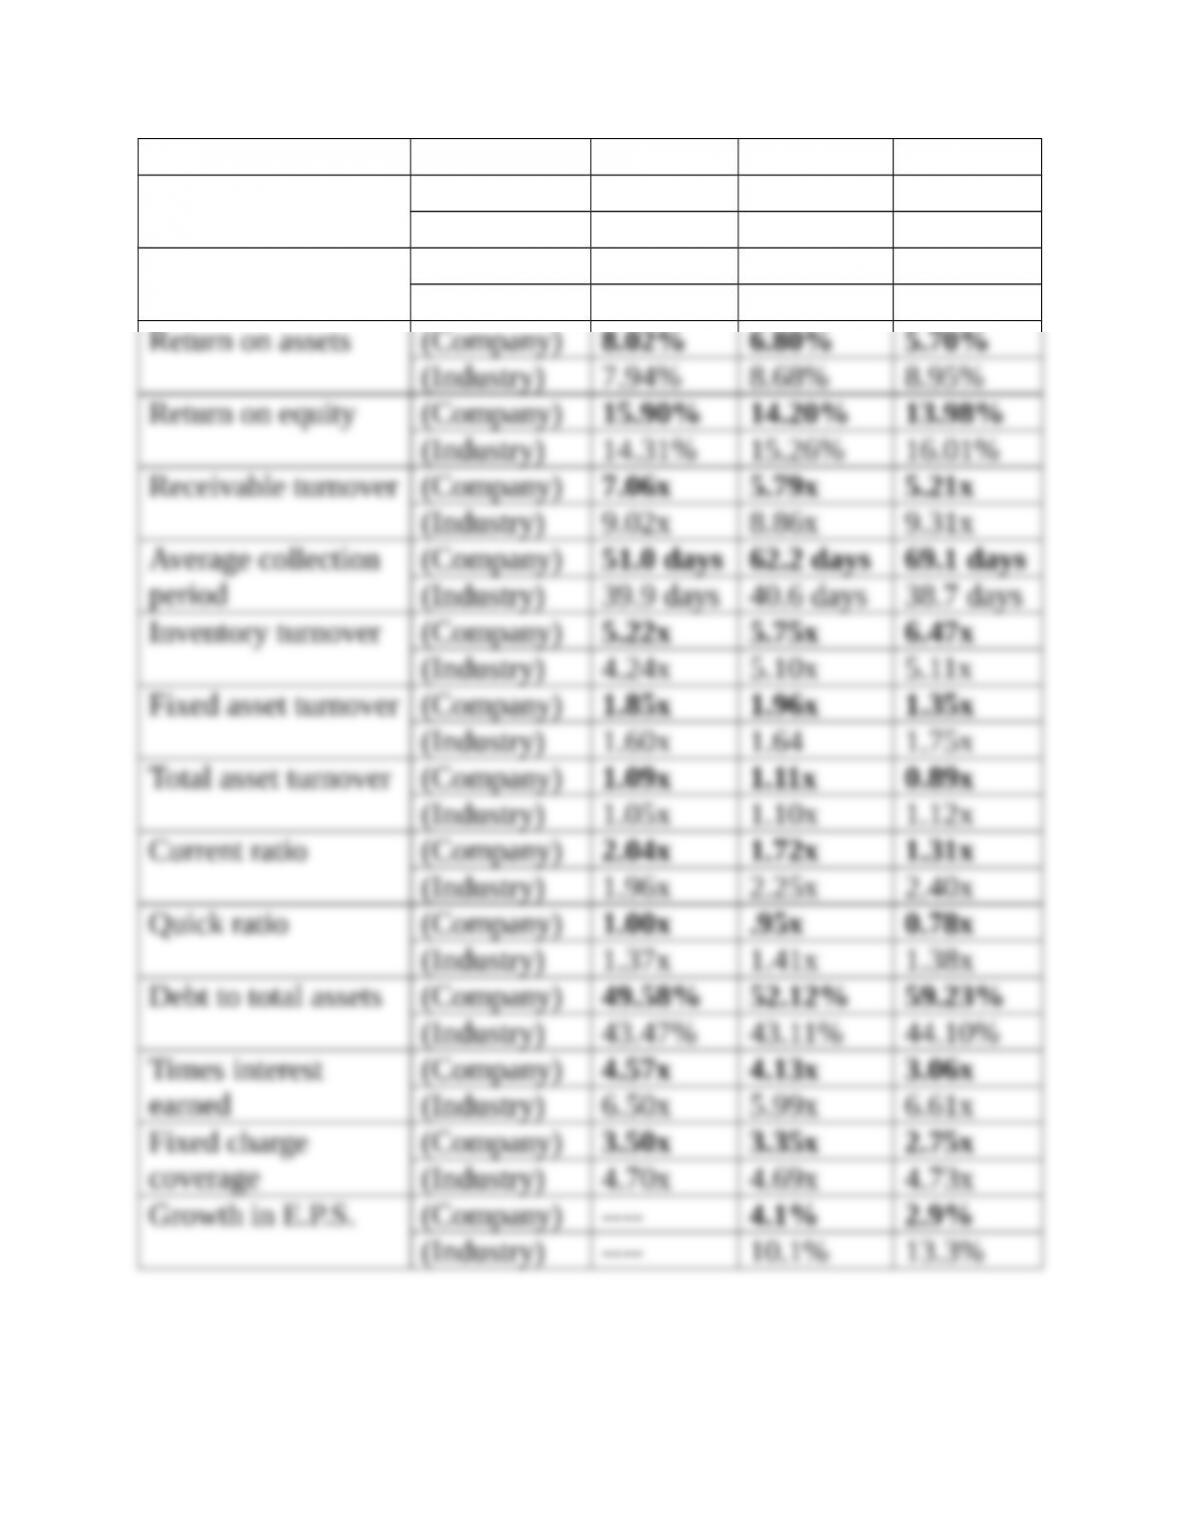
20X1 20X2 20X3
Growth in sales (Company) 25% 25%
(Industry) 10% 12%
Profit margin (Company) 7.35% 6.12% 6.38%
(Industry) 7.71% 7.82% 7.96%
CP 3-1. (Continued)
Copyright © 2017 McGraw-Hill Education. All rights reserved. No reproduction or distribution without the prior written consent
of McGraw-Hill Education.
Chapter 03: Financial Analysis
Discussion of Ratios
While Lamar Swimwear is expanding its sales much more rapidly than
others in the industry, there are some clear deficiencies in their
In terms of profitability, the profit margin is declining over time. This is
surprising in light of the 56.25 percent increase in sales over two years
(25 percent per year). There obviously are no economies of scale for this
firm. Higher costs of goods sold and interest expense appear to be
Return on equity is higher than the industry average the first year, and
then also falls far below it. This decline is particularly significant in light
The previously mentioned slower turnover of assets can be analyzed
This can also be stated in terms of an average collection period that has
increased from 51 days to 69.1 days. While inventory turnover has been
We can summarize the discussion of the turnover ratios by saying that
Copyright © 2017 McGraw-Hill Education. All rights reserved. No reproduction or distribution without the prior written consent
of McGraw-Hill Education.
Chapter 03: Financial Analysis
CP 3-1. (Continued)
The liquidity ratios also are not encouraging. Both the current and quick
The debt-to-total-assets ratio is particularly noticeable in regard to
industry comparisons. Lamar Swimwear has gone from being only 6.11
percent over the industry average to 15.13 percent above the norm
Finally, we see that the firm has a slower growth rate in earnings per
share than the industry. This is a function of less rapid growth in
earnings as well as an increase in shares outstanding (with the sale of
Investment Comments:
He would probably have difficulty justifying such an investment based
on the performance of the firm. There are no dividend payouts, so return
to the investor would have to come in the form of capital appreciation if
Comprehensive Problem 2
Sun Microsystems (trends, ratios stock performance) (LO3) Sun Microsystems is a leading
supplier of computer-related products, including servers, workstations, storage devices, and
network switches.
In 2009, Sun Microsystems was acquired by Oracle Corporation.
Copyright © 2017 McGraw-Hill Education. All rights reserved. No reproduction or distribution without the prior written consent
of McGraw-Hill Education.
Chapter 03: Financial Analysis
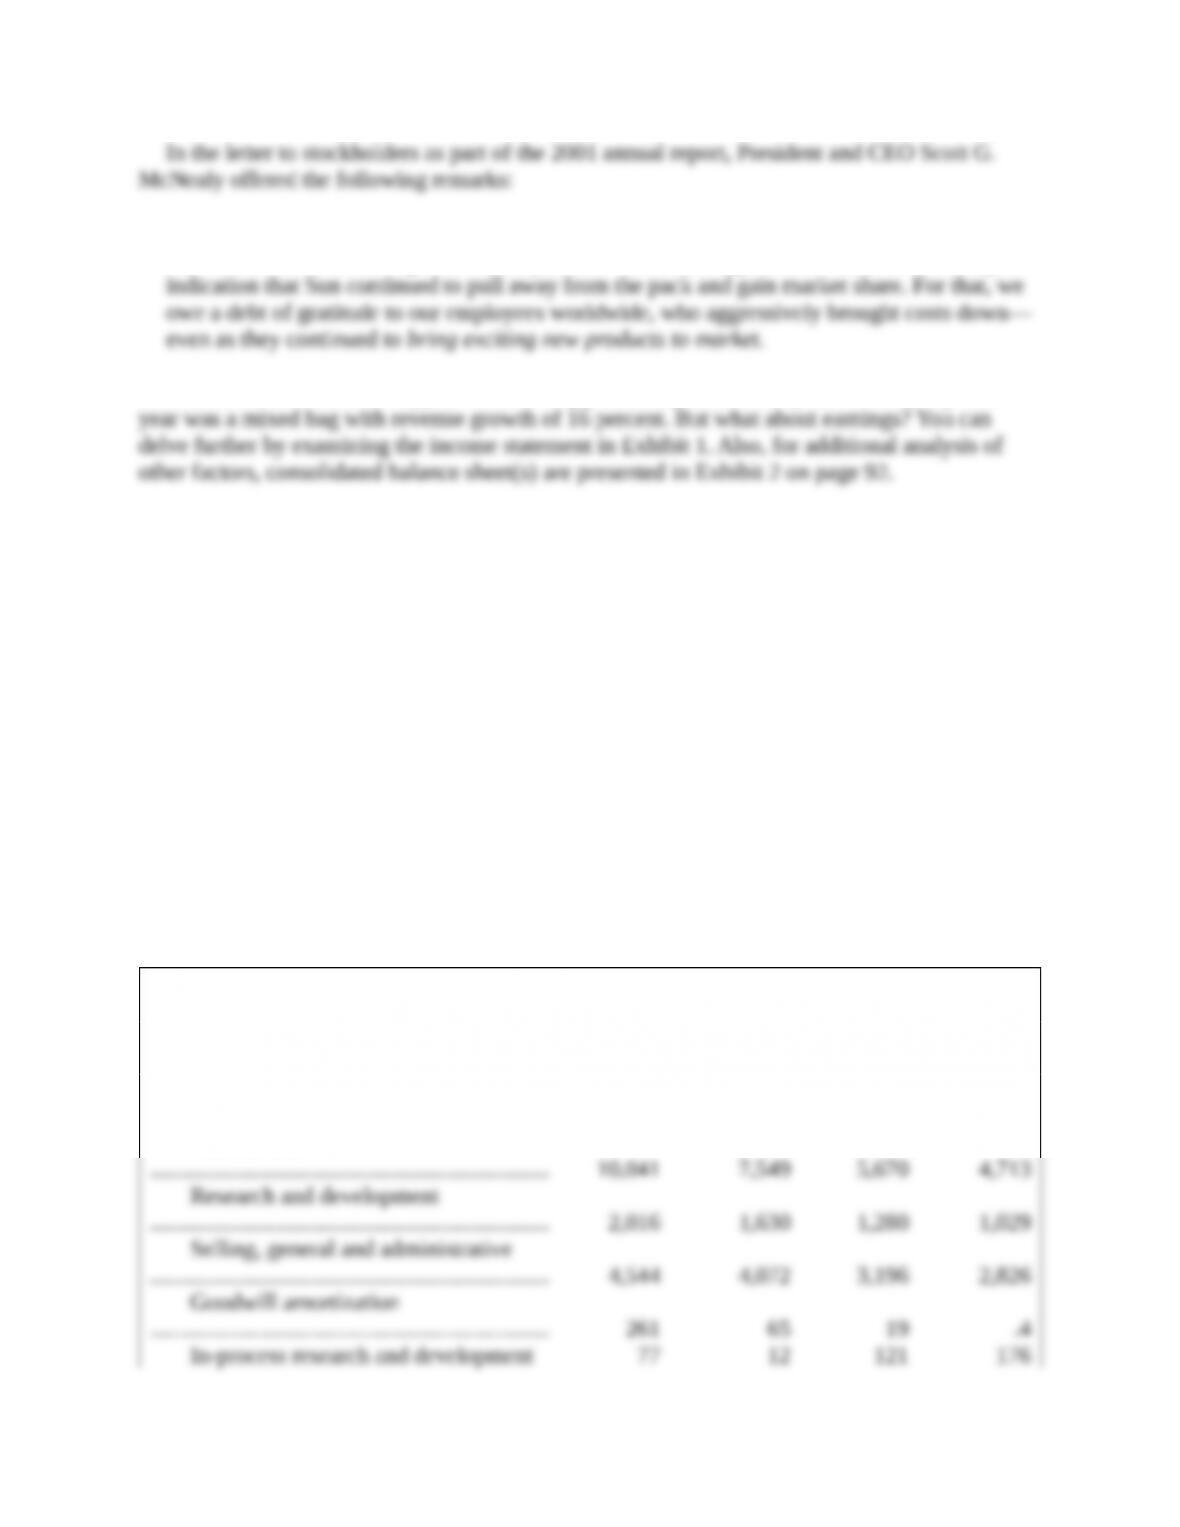
Fiscal 2001 was clearly a mixed bag for Sun, the industry, and the economy as a whole. Still,
we finished with revenue growth of 16 percent—and that’s significant. We believe it’s a good
The statement would not appear to be telling you enough. For example, McNealy says the
1. Referring to Exhibit 1, compute the annual percentage change in net income per common
share-diluted (second numerical line from the bottom) for 1998–1999, 1999–2000, and
2000–2001.
2. Also in Exhibit 1, compute net income/net revenue (sales) for each of the four years.
Begin with 1998.
3. What is the major reason for the change in the answer for Question 2 between 2000 and
2001? To answer this question for each of the two years, take the ratio of the major
income statement accounts to net revenues (sales).
Cost of sales
Research and development
Selling, general and administrative expense
Provision for income tax
4. Compute return on stockholders’ equity for 2000 and 2001 using data from Exhibits 1
and 2.
Comprehensive Problem 2 (Continued)
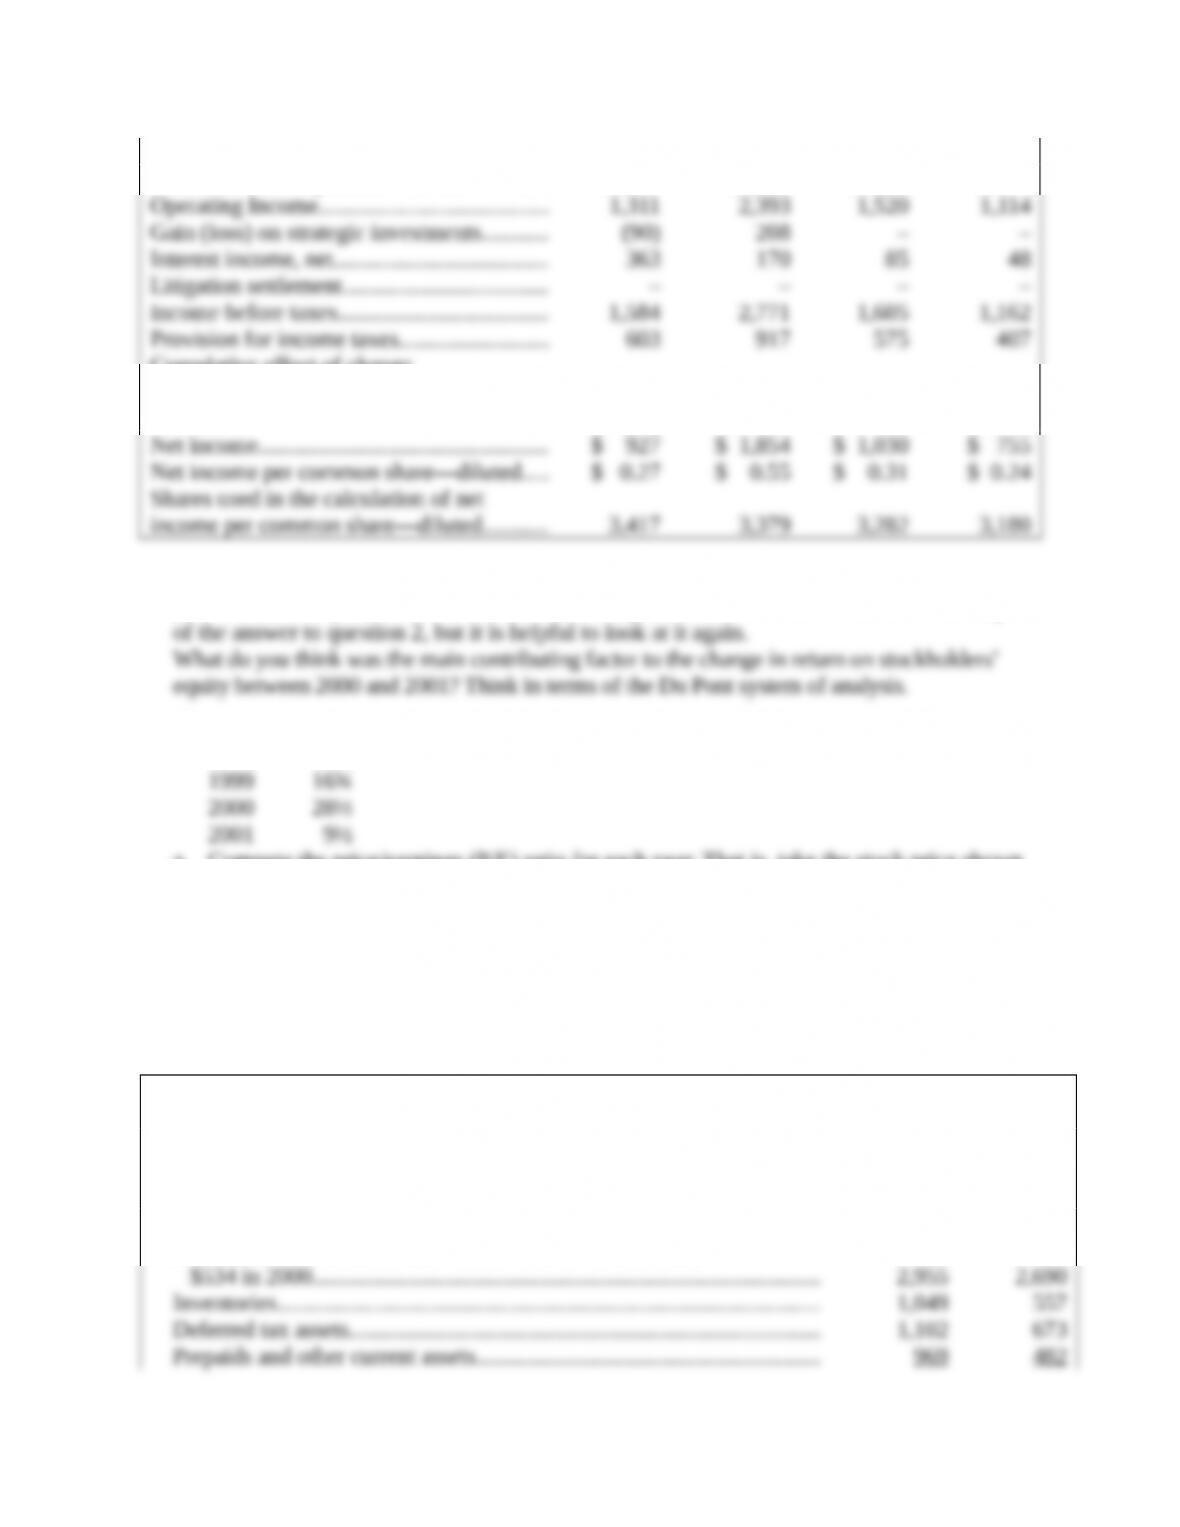
Exhibit 1
SUN MICROSYSTEMS INC.
Summary Consolidated Statement of Income (in millions)
2001 2000 1999 1998
Dollars Dollars Dollars Dollars
Net revenues………………………………………… $18,250 $15,721 $11,806 $9,862
Costs and expenses:
Cost of sales
Copyright © 2017 McGraw-Hill Education. All rights reserved. No reproduction or distribution without the prior written consent
of McGraw-Hill Education.
Chapter 03: Financial Analysis
……………………………………………………………
Total costs and expenses……………………….. 16,939 13,328 10,286 8,748
Cumulative effect of change
in accounting principle, net
……………………………………………………….. (54) – – –
5. Analyze your results to Question 4 more completely by computing ratios 1, 2a, 2b, and 3b
(all from this chapter) for 2000 and 2001. Actually, the answer to ratio 1 can be found as part
6. The average stock prices for each of the four years shown in Exhibit 1 were as follows:
1998 11¼
a. Compute the price/earnings (P/E) ratio for each year. That is, take the stock price shown
above and divide by net income per common stock-dilution from Exhibit 1.
b. Why do you think the P/E has changed from its 2000 level to its 2001 level?
A brief review of P/E ratios can be found under the topic of Price-Earnings Ratio
Applied to Earnings per Share in Chapter 2.
Comprehensive Problem 2 (Continued)
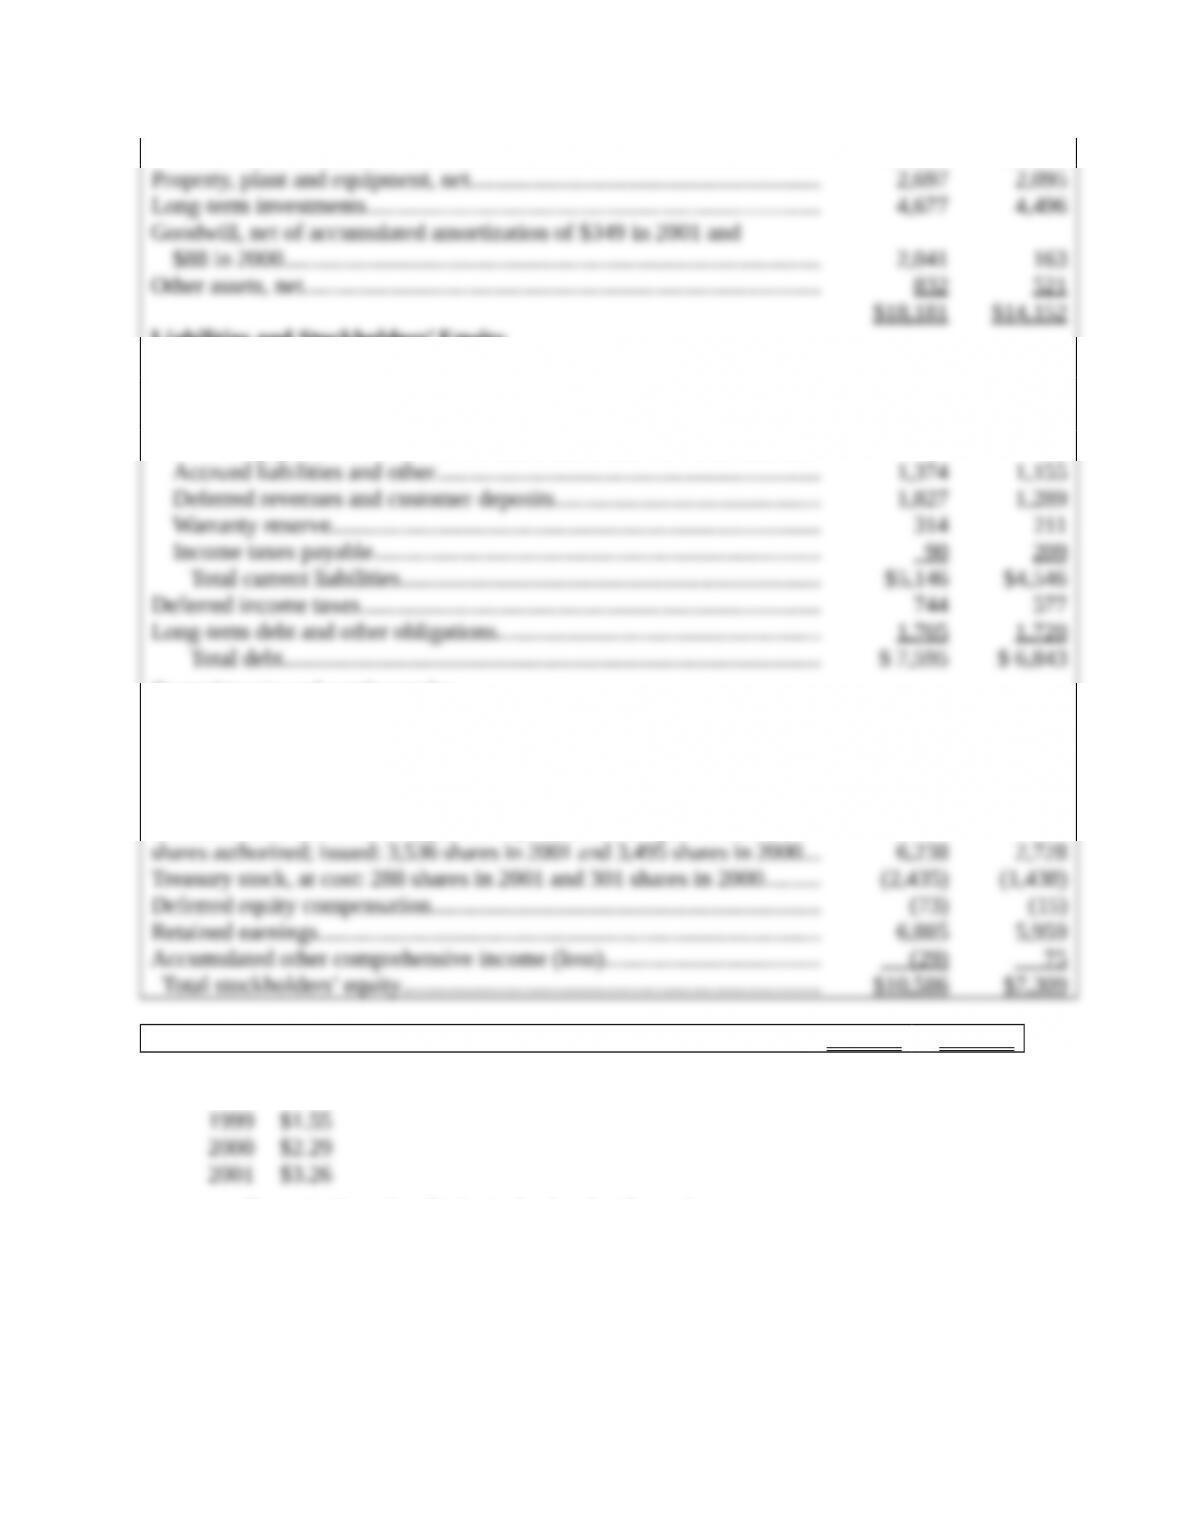
Exhibit 2
SUN MICROSYSTEMS, INC
Consolidated Balance Sheets (in millions)
Assets 2001 2000
Current assets:
Cash and cash equivalents……………………………………………………………. $ 1,472 $ 1,849
Short-term investments……………………………………………………………….. 387 626
Accounts receivable, net allowances of $410 in 2001 and
Copyright © 2017 McGraw-Hill Education. All rights reserved. No reproduction or distribution without the prior written consent
of McGraw-Hill Education.
Chapter 03: Financial Analysis
Total current assets…………………………………………………………………… $7,934 $6,877
Liabilities and Stockholders’ Equity
Current liabilities:
Short-term borrowings………………………………………………………………… $ 3 $ 7
Accounts payable……………………………………………………………………….. 1,050 924
Accrued payroll-related liabilities…………………………………………………. 488 751
Commitments and contingencies
Stockholders’ equity:
Preferred stock, $0.001 par value, 10 shares authorized (1 share which
has been designated as Series A Preferred participating stock): no
shares issued and outstanding…………………………………………………….
– –
Common stock and additional paid-in-capital, $0.00067 par value, 7,200
$18,181 $14,152
7. The book values per share for the same four years discussed in the preceding question were:
1998 $1.18
a. Compute the ratio of price to book value for each year.
b. Is there any dramatic shift in the ratios worthy of note?
CP 3-2. Solution
Sun Microsystems
Copyright © 2017 McGraw-Hill Education. All rights reserved. No reproduction or distribution without the prior written consent
of McGraw-Hill Education.
Chapter 03: Financial Analysis
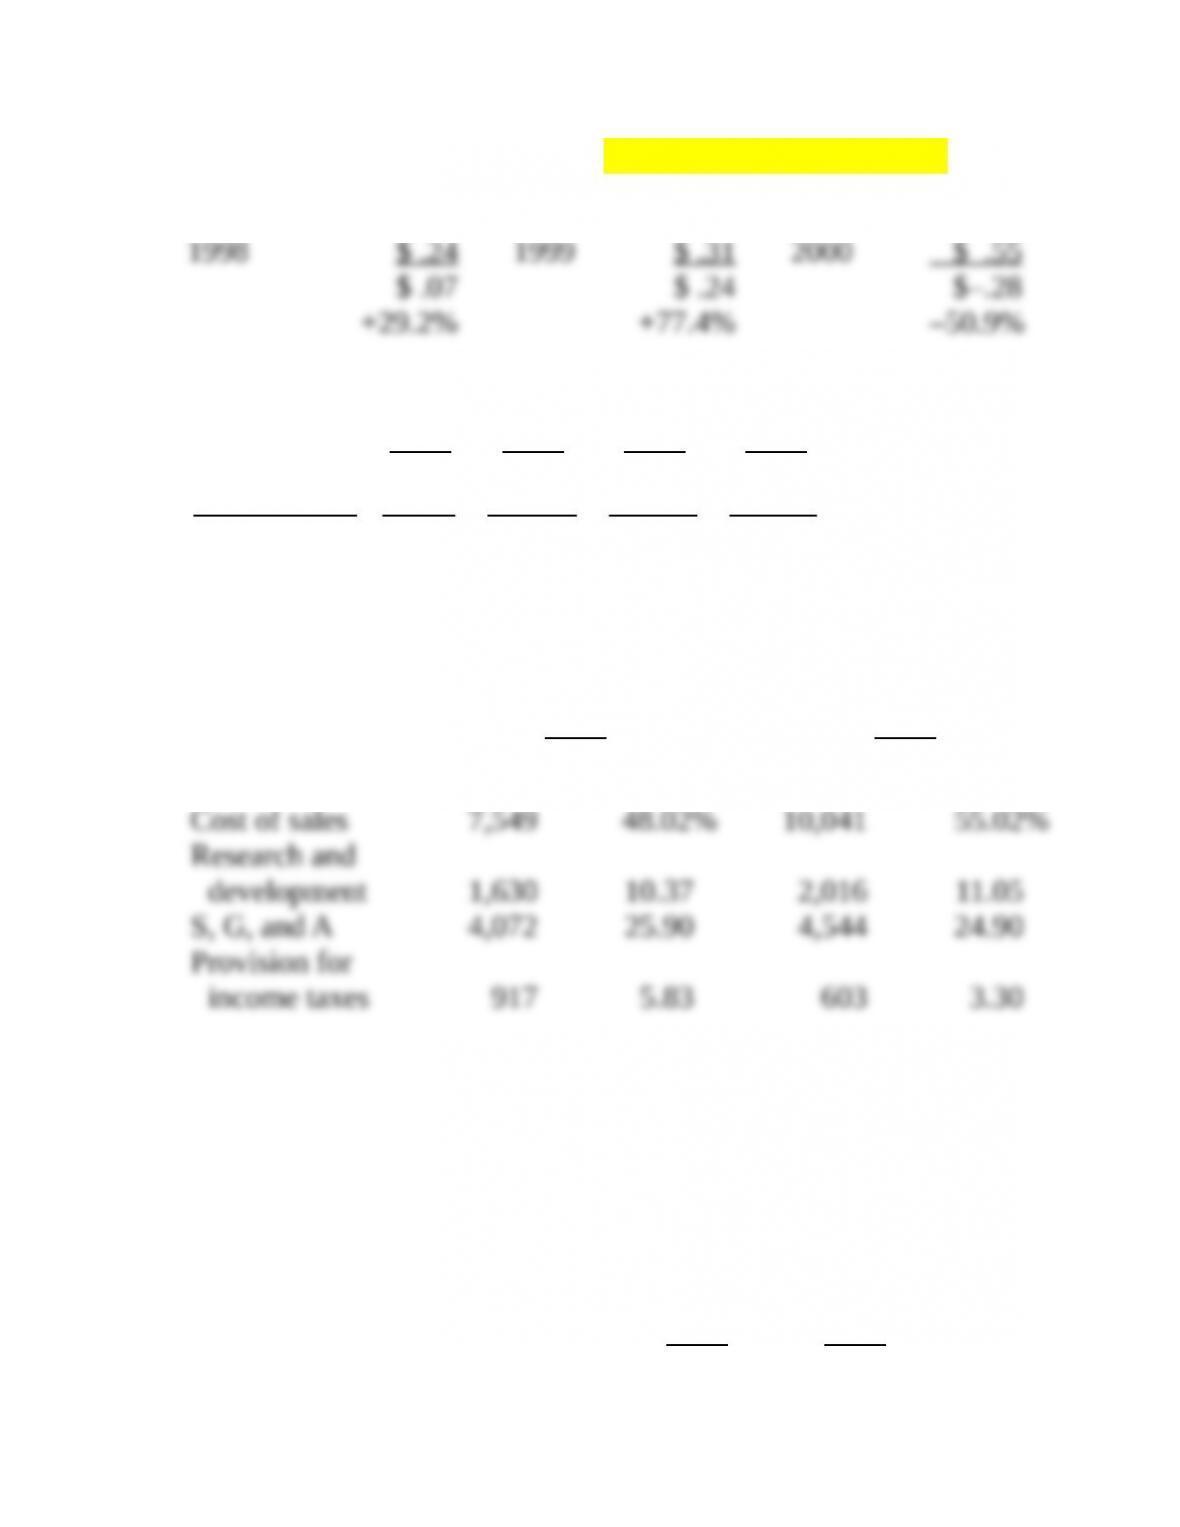
1. Percentage change in net income per common share—diluted
1999 $ .31 2000 $ .55 2001 $ .27
2. Profit margin
1998 1999 2000 2001
Net income $755 $1,030 $1,854 $927
=
Net revenues 9,862 11,806 15,721 18,250
7.66% 8.72% 11.79% 5.08%
3. Percent of net revenue
2000 2001
Net revenues $15,721 $18,250
The main problem between 2000 and 2001 was the increase in cost
of sales as a percentage of net revenue (48.02 percent to 55.02
percent).
CP 3-2. (Continued)
4. Return on stockholders’ equity
2000 2001
Copyright © 2017 McGraw-Hill Education. All rights reserved. No reproduction or distribution without the prior written consent
of McGraw-Hill Education.
Chapter 03: Financial Analysis
Net income $1,854 $ 927
Stockholders’ equity 7,309 10,586
=
25.37% 8.76%
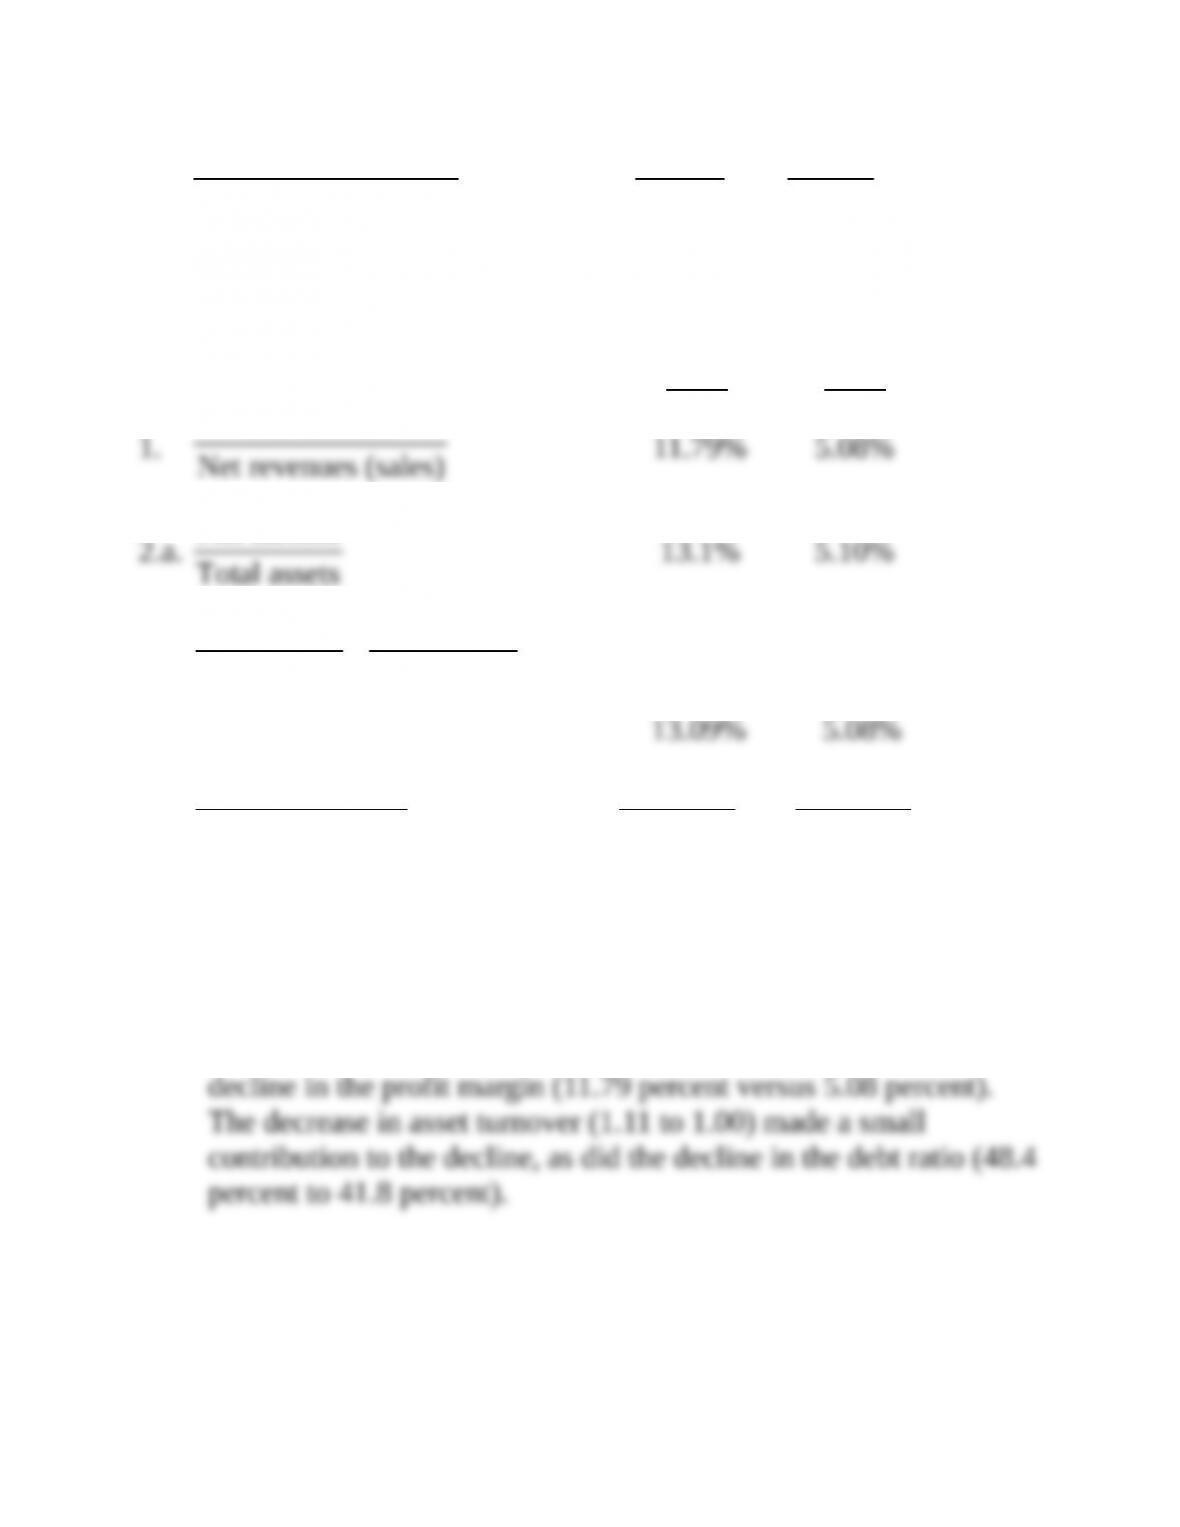
5.
2000 2001
Net income
Net revenues (sales)
Net income
Total assets
2.b.
Net income Sales 11.79% 1.11 5.08% 1.00
Sales Total assets
´ ´ ´
13.09% 5.08%
3.b.
( ) ( ) ( )
Return on assets 13.09% 5.08%
1 Debt/Assets 1 .484 1 .418– – –
25.37% 8.73%
The main contributing factor to the decline in the return on
stockholders’ equity (25.37 percent to 8.73 percent) was the
CP 3-2. (Continued)
6.a. P/E = Stock price/Net income per common share—diluted (EPS)
Copyright © 2017 McGraw-Hill Education. All rights reserved. No reproduction or distribution without the prior written consent
of McGraw-Hill Education.
Chapter 03: Financial Analysis
1998 1999 2000 2001
Share prices $11.25 $16.75 $28.50 $9.50
EPS .24 .31 .55 .27
P/E 46.9 54.0 51.8 35.2
b. The sharp decline in performance caused investors to pay a lower
multiple for the stock.
7.a. Price to book value = Stock price/book value
1998 1999 2000 2001
Share prices $11.25 $16.75 $28.50 $9.50
Book value 1.18 1.55 2.29 3.26
P/BV 9.53 10.81 12.45 2.91
b. Once again, the sharp falloff in price to book value between 2000
and 2001 can be attributed to the decline in performance (and the
Copyright © 2017 McGraw-Hill Education. All rights reserved. No reproduction or distribution without the prior written consent
of McGraw-Hill Education.