
Chapter 12 – Cost Analysis
12-1
Chapter 12
Cost Analysis
Learning Objectives for Chapter 12
• Select the appropriate cost of allocation method for various sales management situations.
• Describe how such methods would be implemented.
• Discuss the importance of return on assets managed (ROAM) and be able to calculate
ROAM.
• Apply financial cost analysis to sales management situations in order to make decisions.
Definition of Key Terms in Chapter 12
• Full cost accounting
o The full cost approach (also known as net profit) takes SALES – COST OF GOODS
SOLD = GROSS MARGIN – OPERATING EXPENSES = SEGMENT NET INCOME.
• Contribution margin accounting
o Contribution margin approach takes SALES – VARIABLE MANUFACTURING
COSTS – OTHER VARIABLES COSTS = CONTRIBUTION MARGIN – FIXED
COSTS = SEGMENT NET INCOME.
• Activity-based costing (ABC) accounting
o This approach allocates fixed costs to products or other unites according to the activity
that creates or drives the cost.
Chapter 12 – Cost Analysis
12-2
• Sales costs
o All costs associated with the selling function (direct and indirect).
o Direct selling

Chapter 12 – Cost Analysis
12-3
A. Full Cost versus Contribution Margin
B. ABC Accounting
II. Procedure
III. The Process Illustrated
A. Direct Selling
B. Advertising
C. Warehousing and Shipping
D. Order Processing
E. Transportation
F. Promise and Problems
G. Return of Assets Managed
IV. Summary
V. Key Terms
VI. Breakout Questions
VII. Leadership Challenge: That Sale Was Expensive, I Think
VIII. Role-Play: CanDo Coffee Service
IX. Minicase: Takamatsu Sports
PowerPoint Program—each chapter of the text has been captured in animated PowerPoint slides.
Chapter Outline with Suggestions for Class Discussions
• Real Cost Analysis Leads to Real Benefits
Suggestion: Start by defining the sales analysis and cost analysis, showing how they differ and how
they complement each other.

Chapter 12 – Cost Analysis
12-4
Suggestion: Next, discuss the slow development of cost analysis in sales management, pointing out
how differences in accounting and marketing costs have contributed to this problem.
Suggestion: If sufficient student interest exists and time is available, you may want to discuss the
different types of cost. For an excellent review, see the classic text: Joel Dean, Managerial Economics,
Englewood Cliffs, N.J.: Prentice-Hall, Inc., 1951, pp. 257–272. For a more recent discussion of
Marketing Costs and their effect on the organization, please refer to Cost Management: A Strategic
Emphasis written by Edward Blocher, University of North Carolina-Chapel Hill, Kung Chen,
University of Nebraska-Lincoln and Thomas Lin, University of Southern California. Chapter 17 of
their book, Managing Marketing Effectiveness, Productivity, and Customer Profitability, provides an
excellent discussion of marketing costs.
The following summarizes Dean’s cost distinctions:
Types of Cost Distinctions*
Opportunity Costs Outlay Costs Nature of the Sacrifice
Past Costs Future Costs Degree of Anticipation
Short-Run Costs Long-run Costs Degree of Adaptation to Present Output
Variable Costs Fixed Costs Degree of Variation with Output Rate
Direct Costs Indirect Costs Traceability to Unit of Operations
Out-of-Pocket Costs Depreciation Immediacy of Expenditure
Incremental Costs Sunk Costs Relation to Added Activity
Escapable Costs Unavoidable Costs Relation to Retrenchment
Controllable Costs Non-controllable Costs Controllability
Replacement Costs Historical Costs Timing of Valuation
Suggestion: Discuss the issue of full-cost versus contribution margin approaches to marketing costs
analysis. If not already covered, distinguish between direct and indirect costs, using the following
scheme from the chapter:
Object of Measurement
Cost Product Territory
Chapter 12 – Cost Analysis
12-5
Sales promotion display Direct Direct
Salesperson compensation Indirect Direct
Product-line manager’s salary Direct Indirect
Chapter 12 – Cost Analysis
o Order Processing
1. Cutting Costs Too Far: The following illustrates the issue presented in the question:
Indeed. After many years of cost cutting, the downside of downsizing is
beginning to take its toll: Decimated sales staffs turn in lousy numbers.
“Survivor syndrome” takes hold, and overburdened staffers go through
12-7
2. Advertising versus Selling. No doubt advertising and other marketing mix expenditures have
3. Product versus Commission. In this situation management has to ask: How does the deluxe
fountain pen model help sales of other Rite-Way products? If it can be ascertained that the deluxe
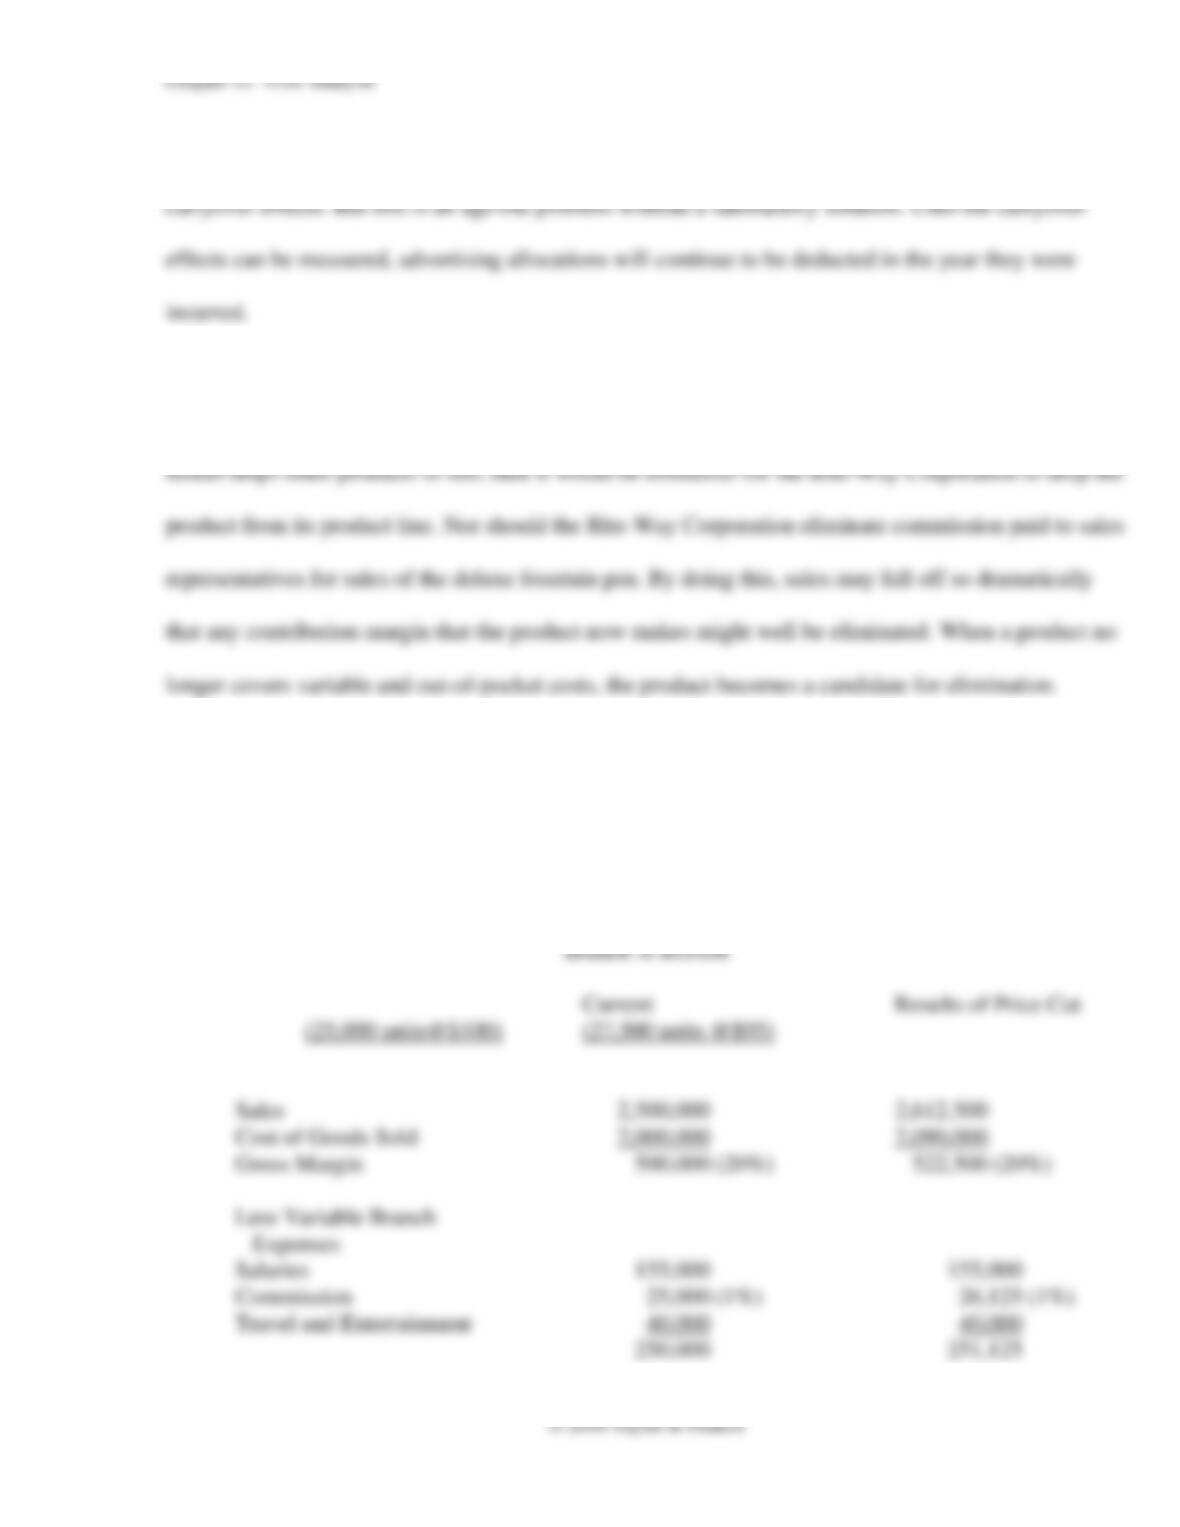
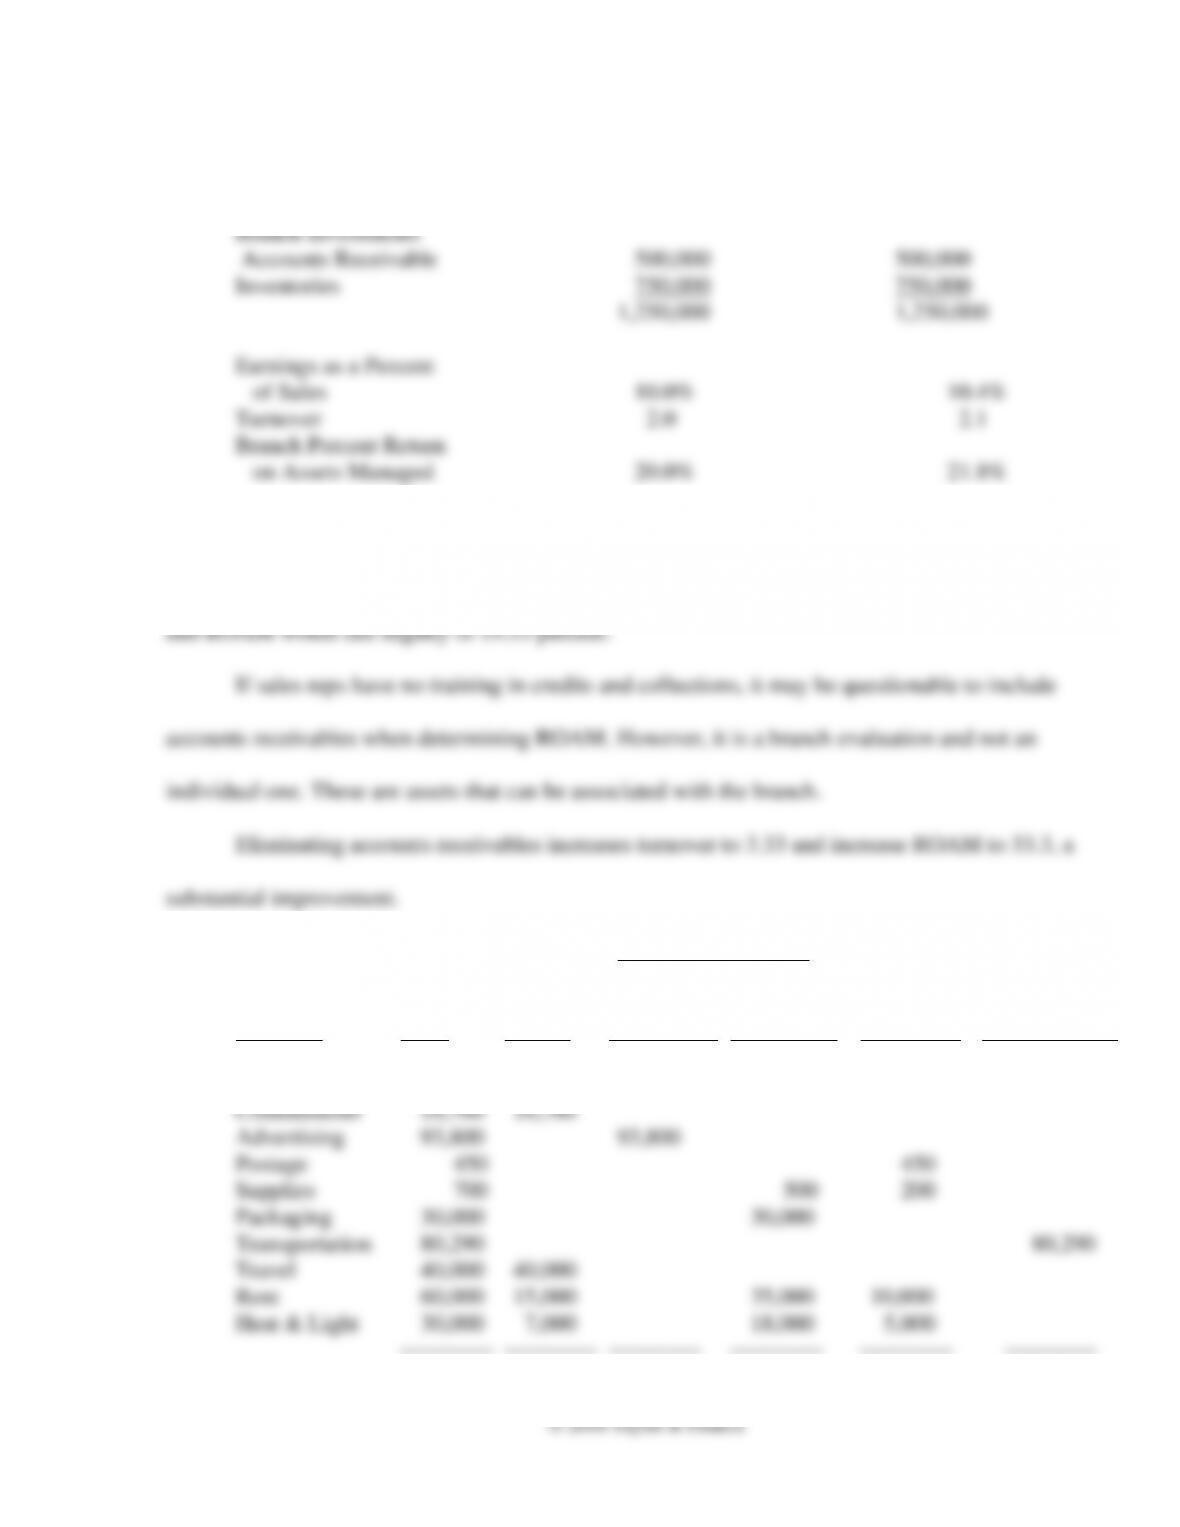
4. There will be a small positive change in ROAM. Assume that the price is $100 per unit and that
a 5 percent cut reduces it to $95. Branch A sold 25,000 units, which will increase by 10 percent to
27,500 units. The 10 percent increase in unit volume is partially offset by the 5 percent cut in price. The
result is a 21.8 percent ROAM. The following illustrates the changes.
Chapter 12 – Cost Analysis
12-8
Branch Contributions
to Profit 250,000 271,375
5. No, this will not be beneficial. Variable branch expenses would rise another $25,000 and branch
assets would fall $100,000. Earnings as a percent of sales would be 9 percent, turnover would be 2.17,
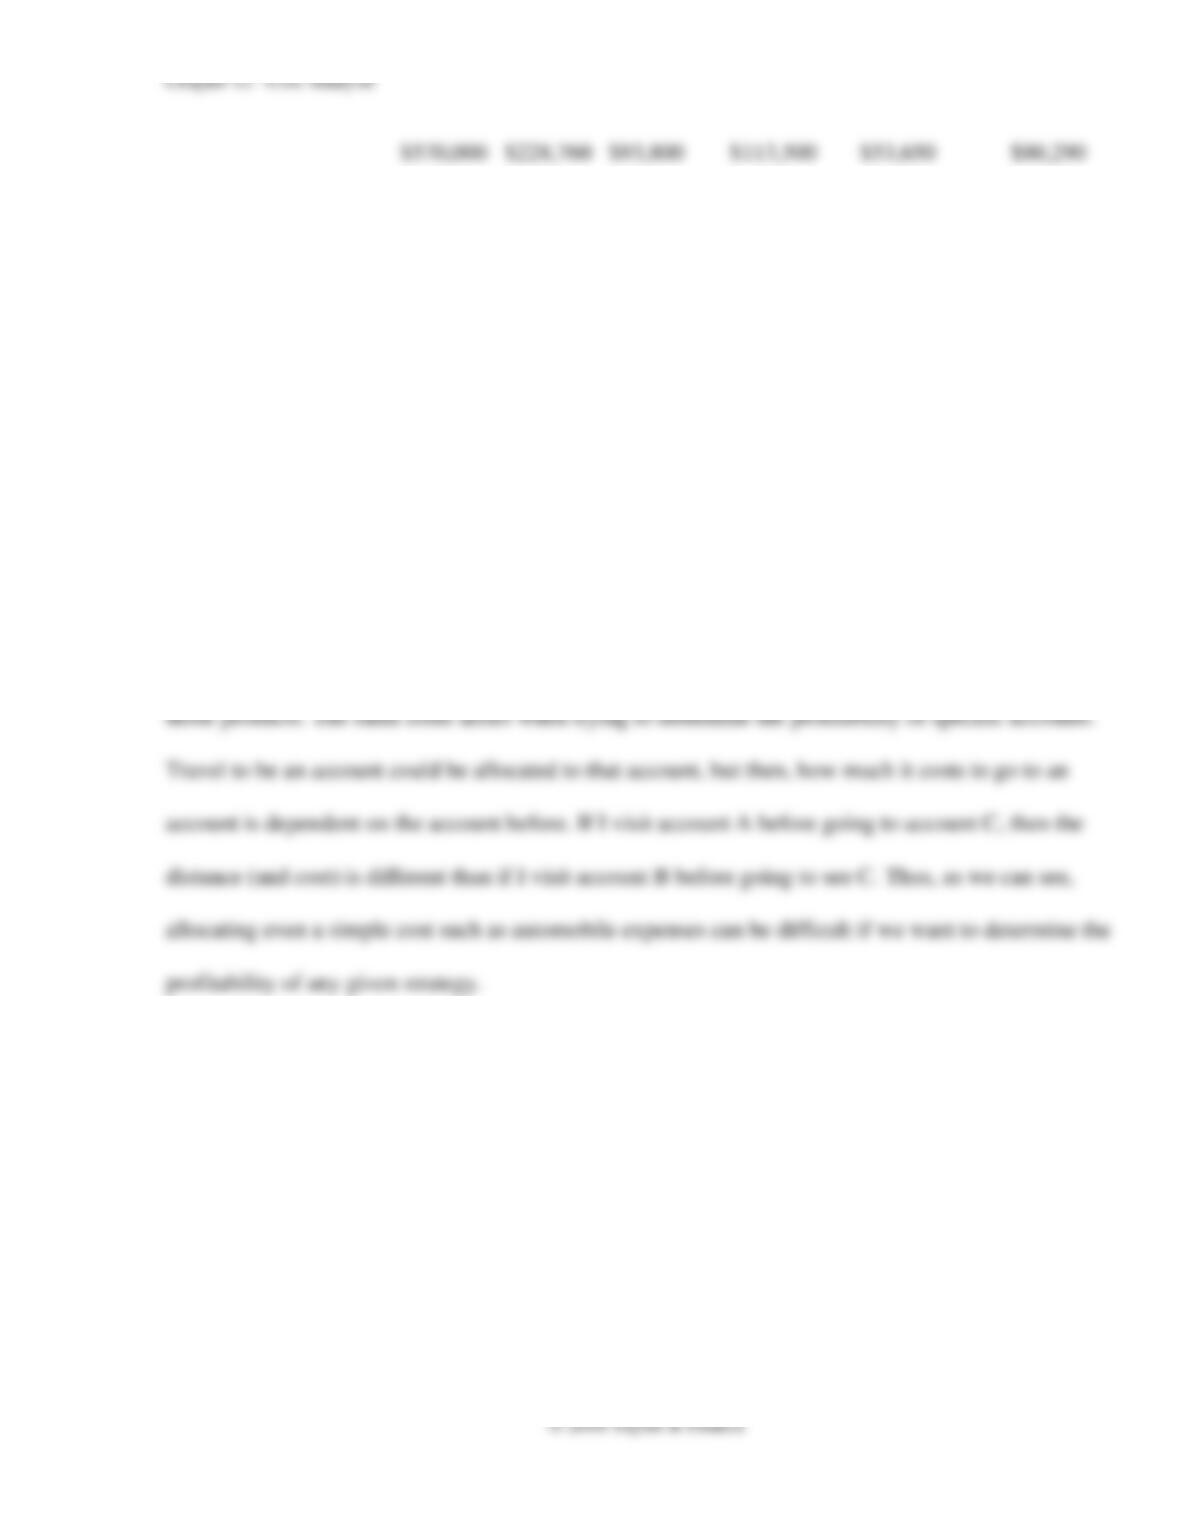
6. Functional Accounts
Natural Direct Warehouse Order
Accounts Total Selling Advertising & Shipping Processing Transportation
Salaries 218,000 150,000 30,000 38,000
12-9
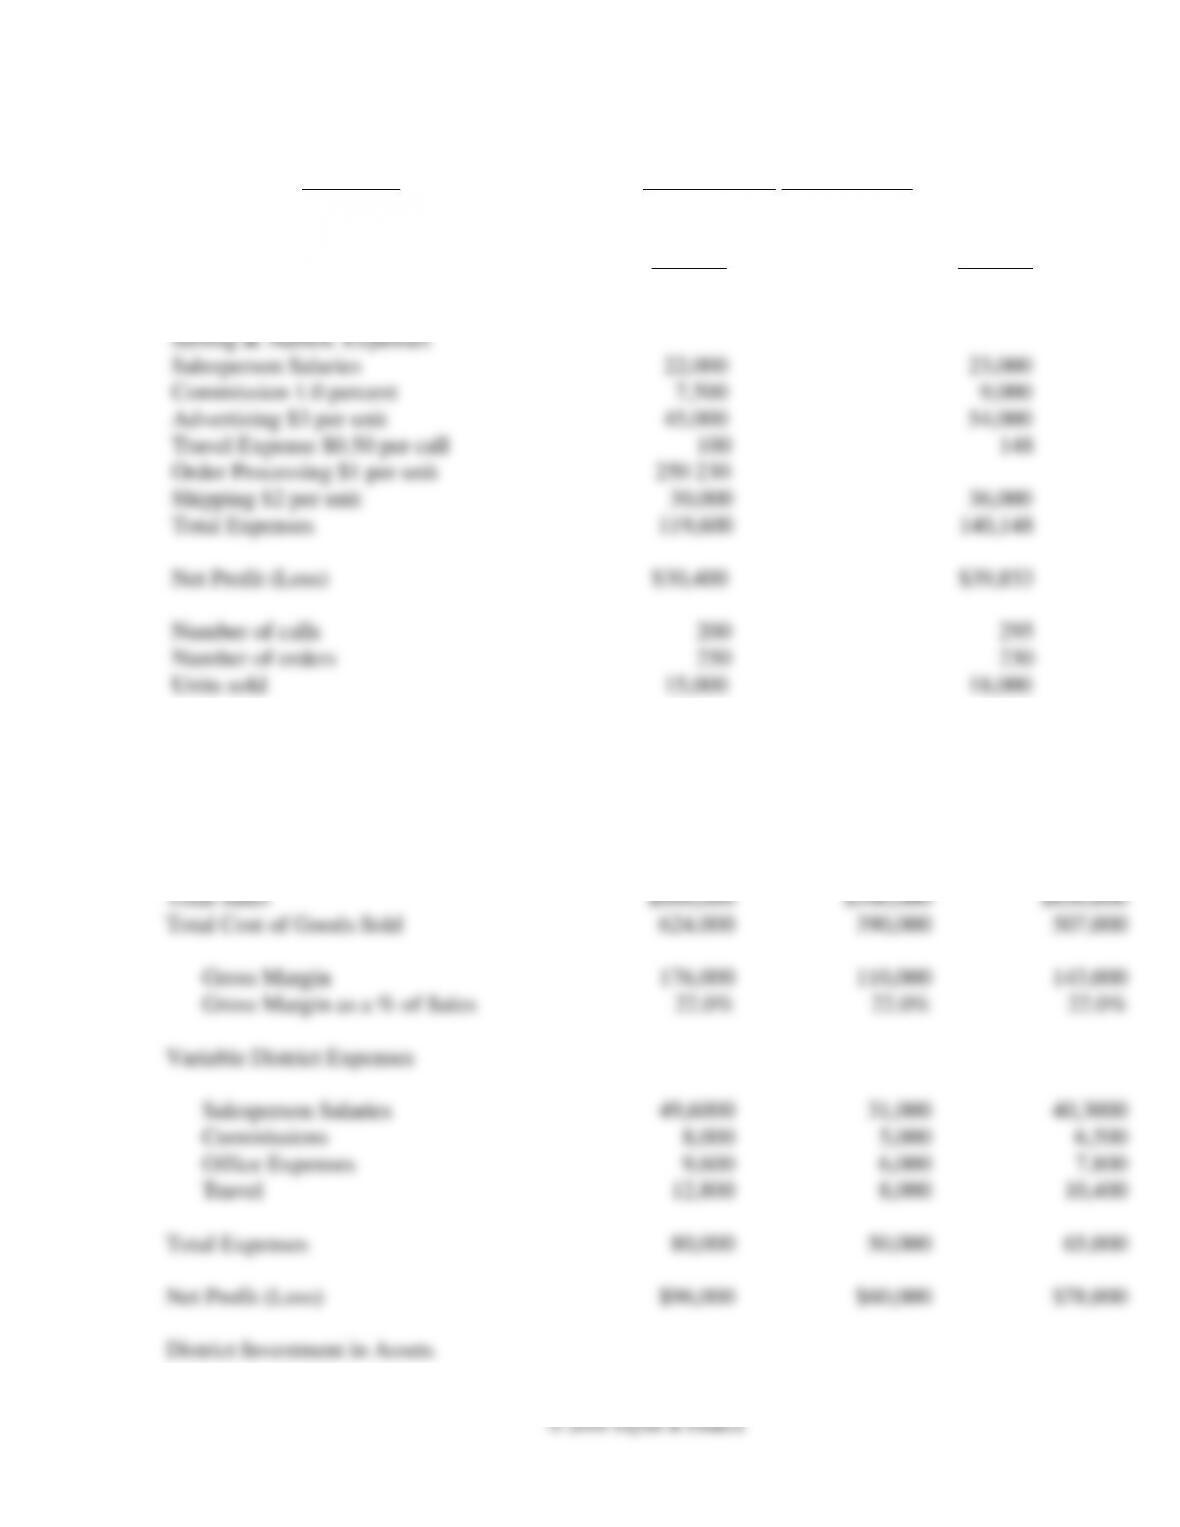
7. Cost Allocation. If the issues were just with the profitability of each salesperson, then travel
costs, including automobile expenses, would be summed by salesperson. There would be no
“allocation” process because the natural collection of the information would be by salesperson (or by
car) as expenses were paid. But calculating profit by product is more difficult. An easy way would be
to divide expenses by eight (the number of product lines) and allocate one-eighth of automobile
expenses to each product line. Another alternative is to allocate expenses on the basis of revenue; for
example, a product that represents 20% of revenue would be allocated 20% of auto expenses. However,
what if calls are specifically related to a particular product? For example, what if some products are
sold only to specific chains? Then the costs associated with those sales calls could be allocated to just
Chapter 12 – Cost Analysis
12–10
8. Cost Basis Salesperson A Salesperson B
Total Sales $750,000 $900,000
Total Cost of Goods Sold 600,000 720,000
Gross Margin $150,000 $180,000
9.
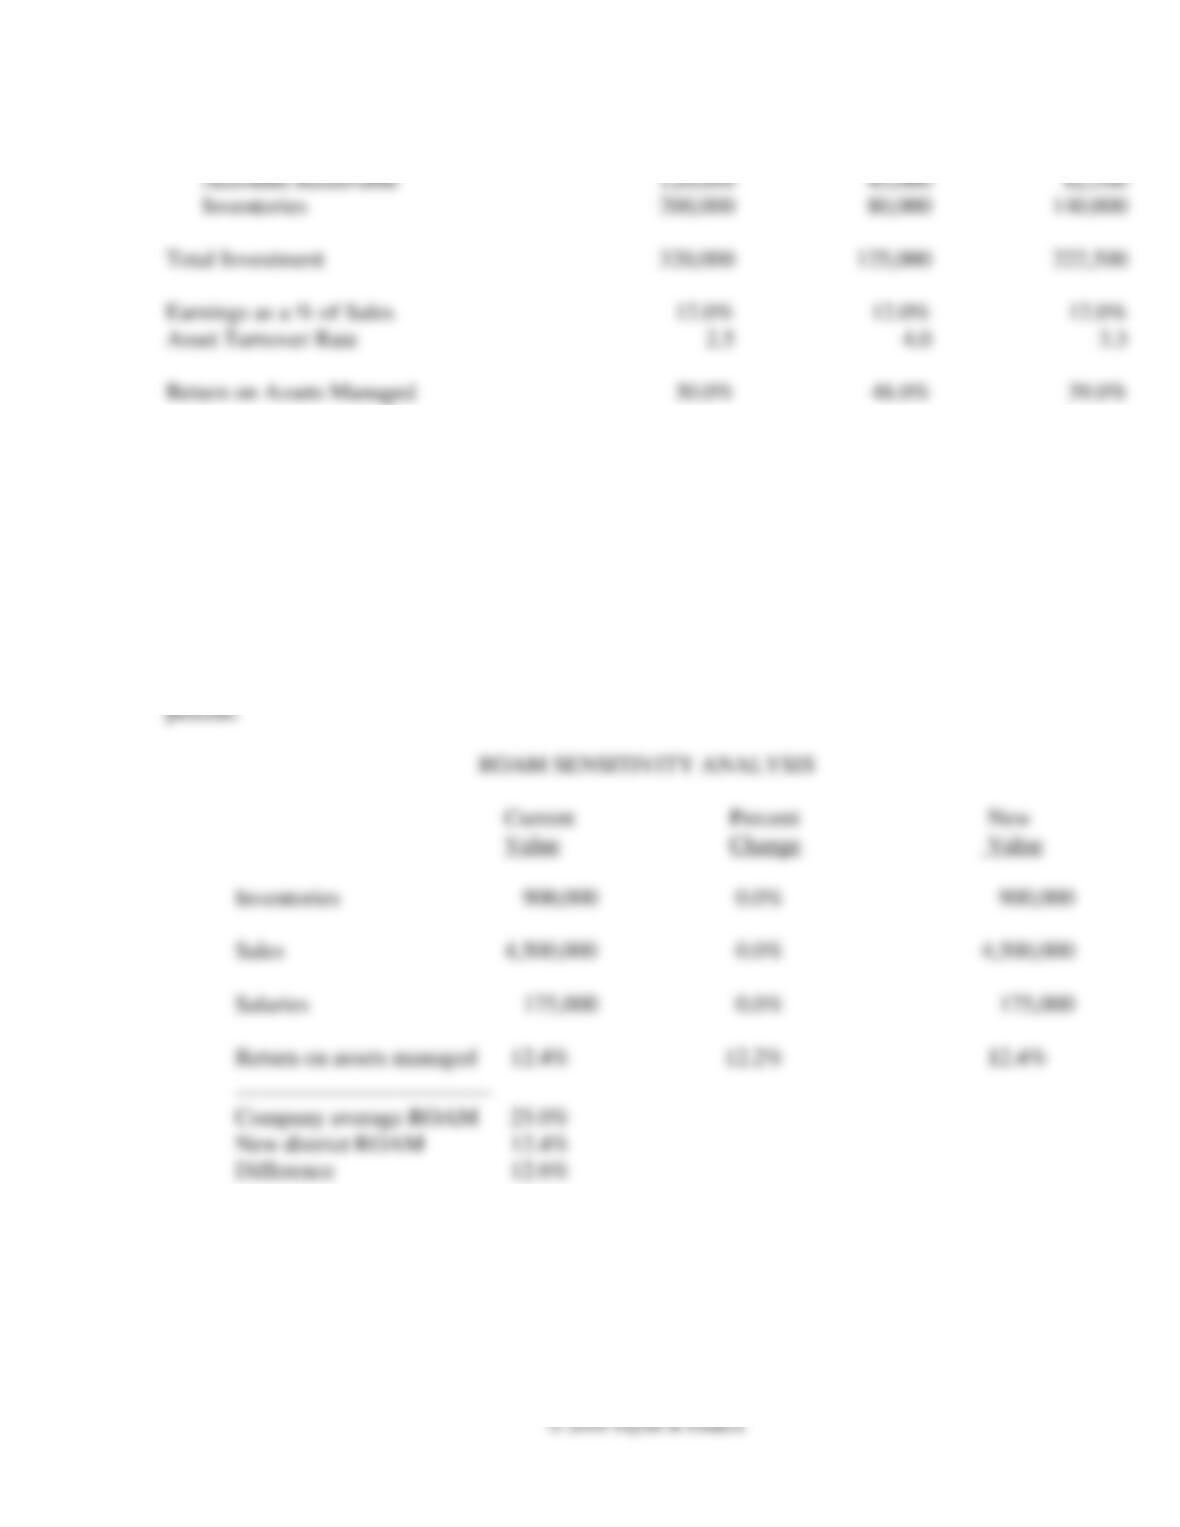
ROAM ANALYSIS
Districts
1
2
Average
Total Sales
$800,000
$500,000
$650,000
Total Cost of Goods Sold
624,000
390,000
507,000
Gross Margin
176,000
110,000
143,000
Gross Margin as a % of Sales
22.0%
22.0%
22.0%
Variable District Expenses
Salesperson Salaries
49,6000
31,000
40,3000
Commissions
8,000
5,000
6,500
Office Expenses
9,600
6,000
7,800
Travel
12,800
8,000
10,400
Total Expenses
80,000
50,000
65,000
Net Profit (Loss)
$96,000
$60,000
$78,000
District Investment in Assets
Chapter 12 – Cost Analysis
12–11
Accounts Receivable
120,000
45,000
82,500
Inventories
200,000
80,000
140,000
Total Investment
320,000
125,000
222,500
Earnings as a % of Sales
12.0%
12.0%
12.0%
Asset Turnover Rate
2.5
4.0
3.3
Return on Assets Managed
30.0%
48.0%
39.0%
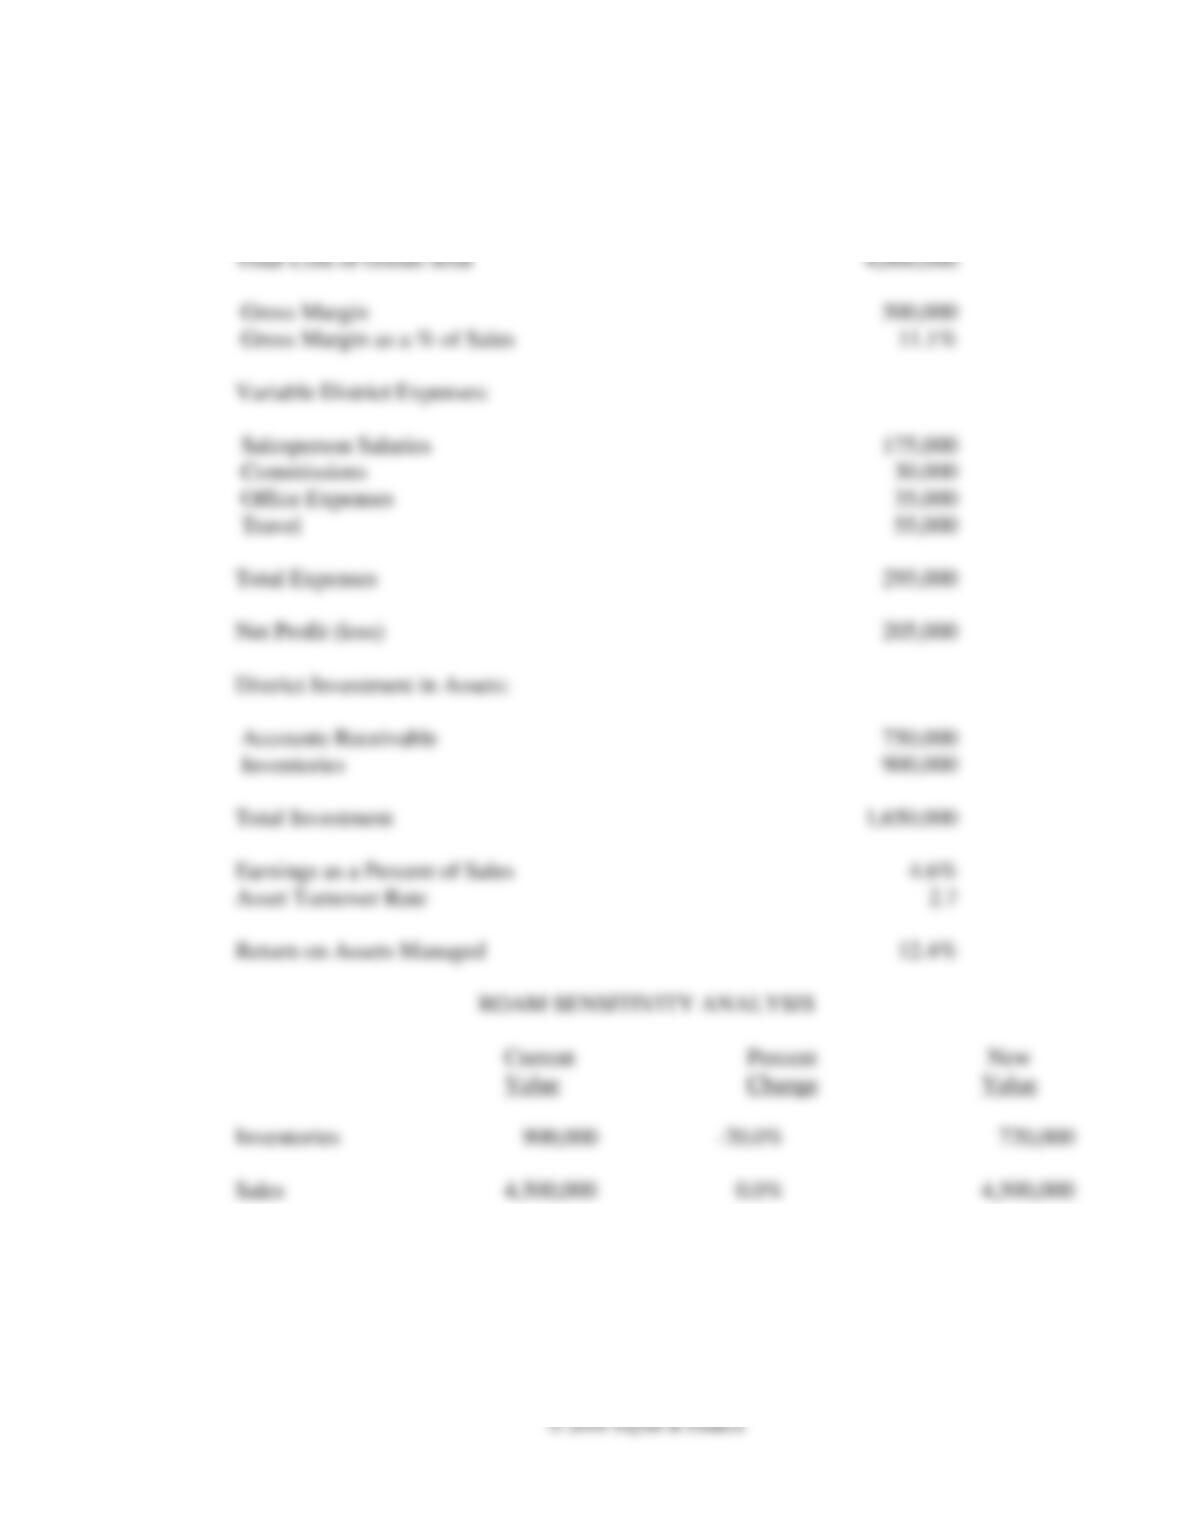
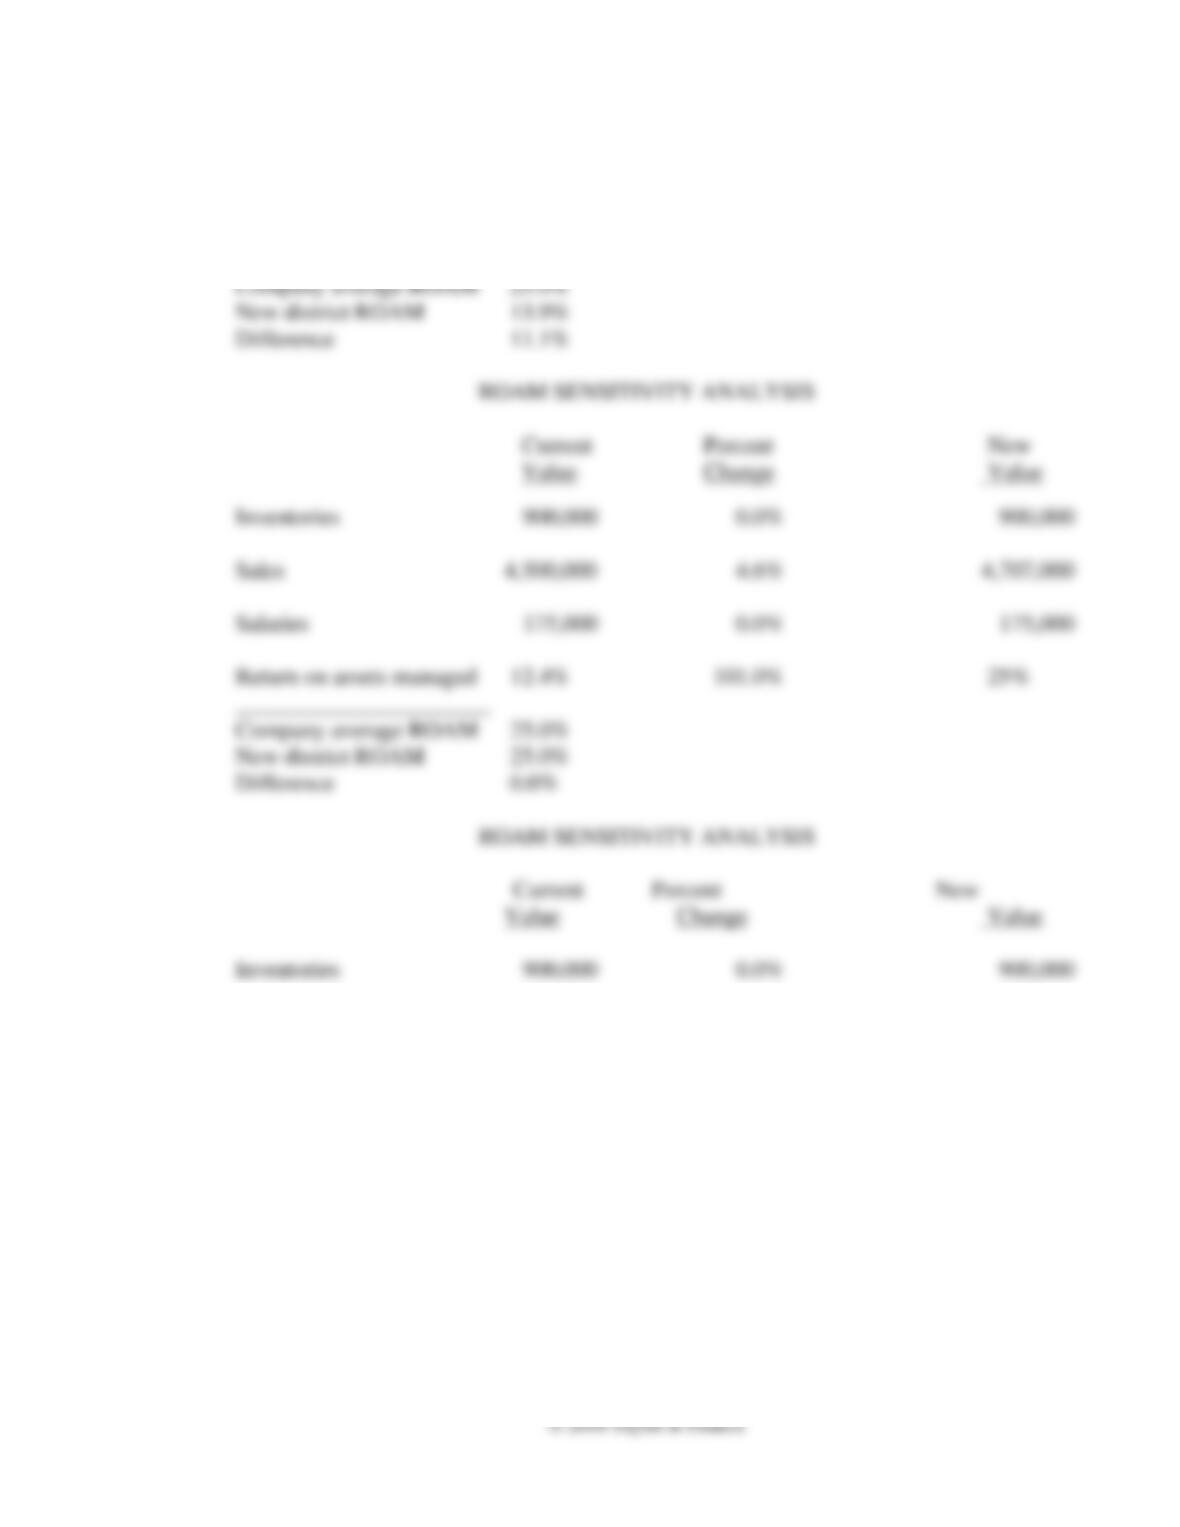
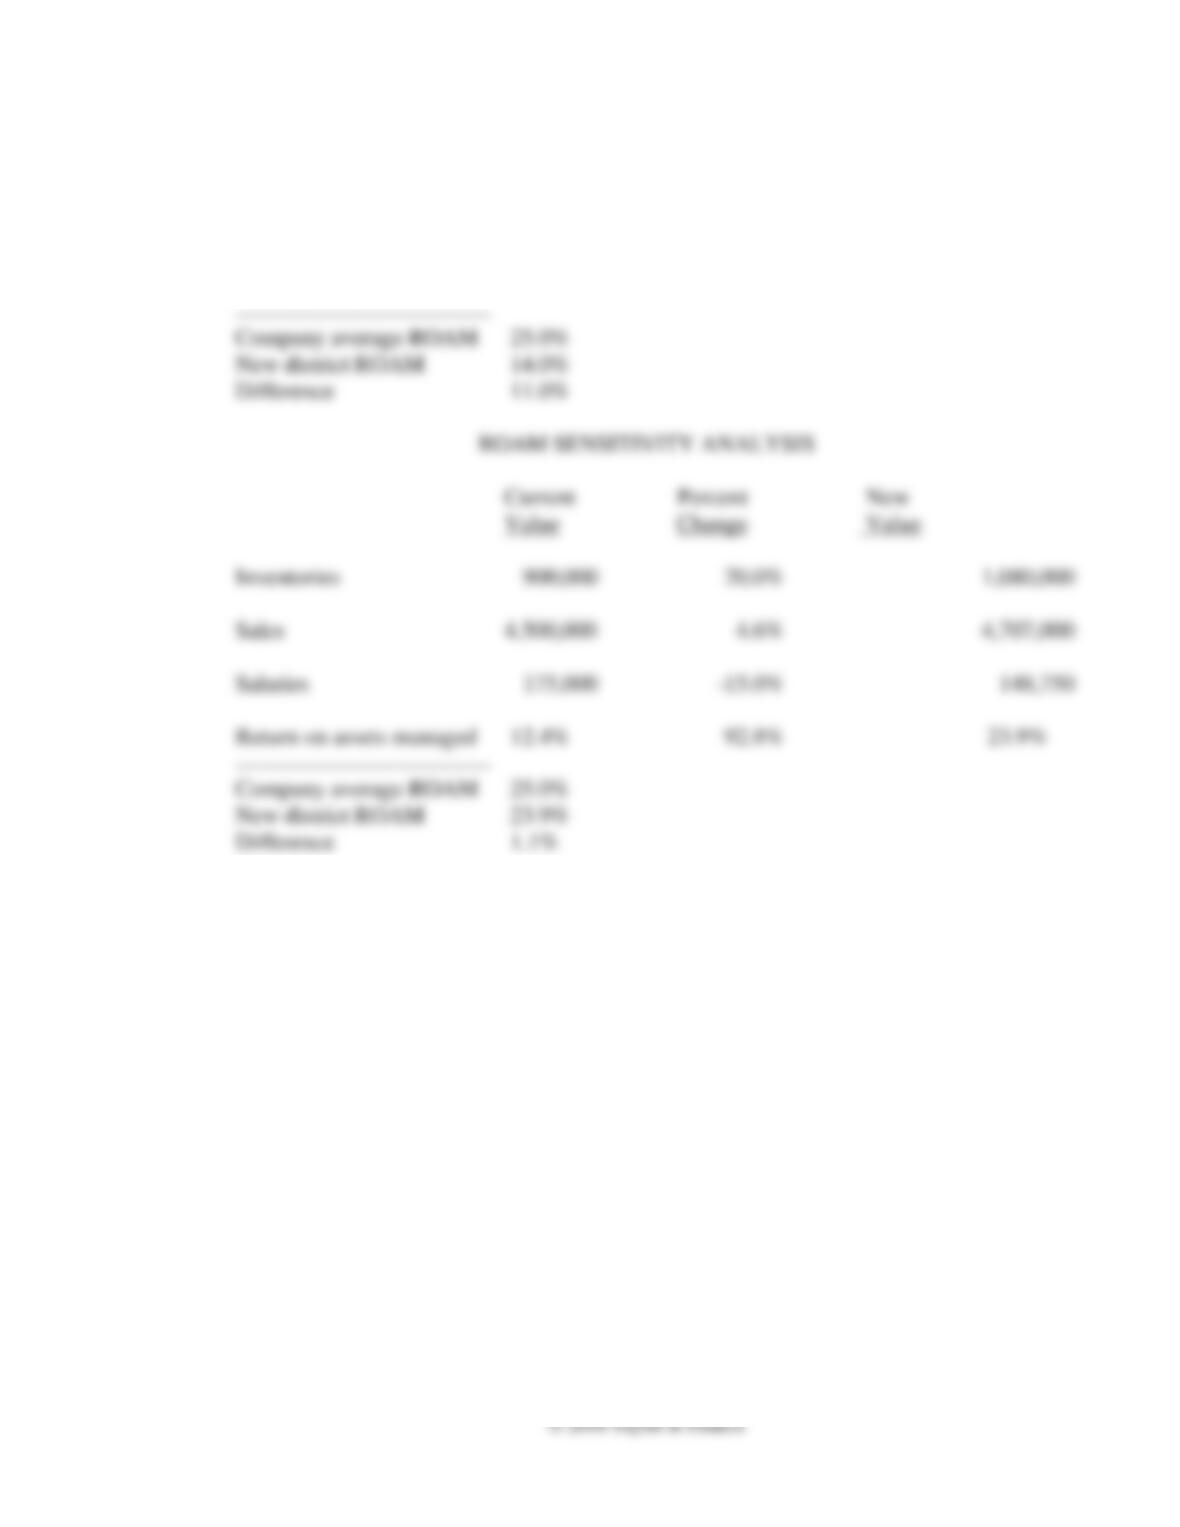
10. Calculating ROAM. Reducing inventories by 20 percent increases ROAM to 13.9 percent,
well below the 25 percent company average. Reducing salaries, which probably will affect sales,
provides a similar ROAM of 14.0 percent. If the company can increase sales then a 4.6 percent increase
will produce a ROAM of 25.0 percent. All three actions taken together will increase ROAM to 23.9
Chapter 12 – Cost Analysis
12–12
CURRENT ROAM ANALYSIS
Southern District
Total Sales 4,500,000
Chapter 12 – Cost Analysis
12–13
Salaries 175,000 0.0% 175,000
Return on assets managed 12.4% 12.2% 12.4%
______________________
Chapter 12 – Cost Analysis
12–14
Sales 4,500,000 0.0% 4,500,000
Salaries 175,000 -15.0% 148,750
Return on assets managed 12.4% 12.8% 14.0%
Chapter 12 – Cost Analysis
12–15
Leadership Challenge: That Sale Was Expensive, I Think
Teaching Notes
What is the real cost of servicing and maintaining a customer? Which of our products is most profitable
once you add the cost of installation and service? Sales Executives look for answers to these and other
1. There are several key points Barry Jefferson may want to convey to Grace Hart. First,
successfully allocating limited sales resources is based on having accurate information about both
Chapter 12 – Cost Analysis
12–16
2. There is a lot of information that could be helpful for a sales executive to know and indeed, you
will undoubtedly identify other data. This list is not meant to be exhaustive:
• Amount of sales person compensation allocated to customer/even down to the sales call per
3. Grace Hart could ask the following questions. Again, this list is not meant to be exhaustive.
• How do you want costs assigned (salesperson, product, customer or something else)?
• How will the company absorb the costs of implementing a cost analysis system?
• How would you intend to use the system (resource allocation, salesperson evaluation)?
Chapter 12 – Cost Analysis
12–17
of the company’s salesperson incentive plan. Before her meeting with sales managers Ryan Roan and
Fernando Perez, players must familiarize themselves with both the contribution margin approach
(which CanDo has used in the past) and with alternative approaches such as activity-based costing. It
12–18
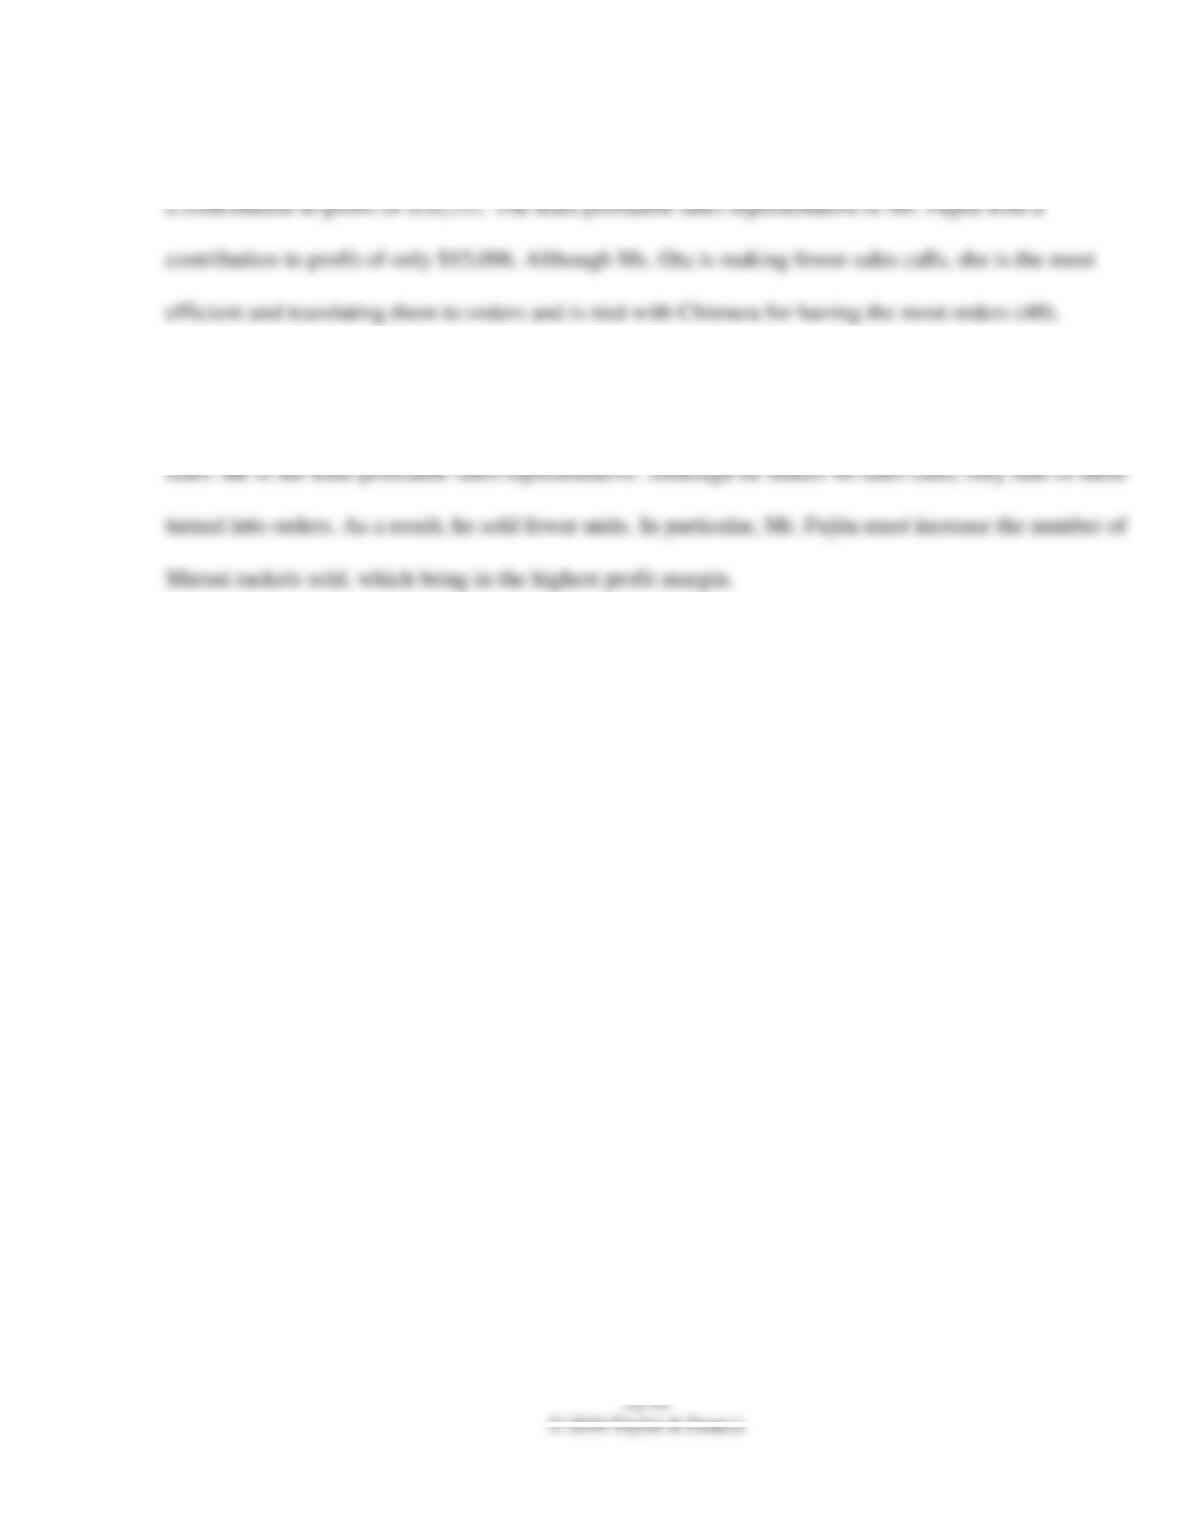
1. Answered in the following table:
Profitability Analysis by Salesperson
Total
Chimura
Fujita
Ota
Sales
Nomo
$753,390
$265,590
$229,500
$258,300
Ichiro
$738,010
$238,630
$245,700
$253,680
Matsui
$761,970
$265,100
$207,900
$288,970
Total Sales
$2,253,370
$769,320
$683,100
$800,950
Cost of Goods Sold
Nomo
$585,970
$206,570
$178,500
$200,900
Ichiro
$579,865
$187,495
$193,050
$199,320
Matsui
$588,795
$204,850
$160,650
$223,295
Total COGS
$1,754,630
$598,915
$532,200
$623,515
Gross Margin
$498,740
$170,405
$150,900
$177,435
Expenses
Direct Selling
Salary
$120,000
$40,000
$40,000
$40,000
Commissions
$22,534
$7,693
$6,831
$8,010
Travel
$42,000
$14,000
$14,000
$14,000
Advertising
Nomo
$29,500
$10,400
$8,986
$10,114
Ichiro
$60,210
$19,468
$20,045
$20,696
Matsui
$87,180
$30,331
$23,787
$33,062
Warehousing and Shipping
$20,527
$7,033
$6,300
$7,195
Order Processing
$342
$117
$105
$120
Transportation
$51,318
$17,582
$15,750
$17,987
Total Expenses
$433,611
$146,624
$135,804
$151,183
Contribution to Profit
(Loss)
$65,129
$23,781
$15,096
$26,252
Chapter 12 – Cost Analysis
2. Contrary to Mr. Takamatsu’s concerns, Ms. Ota is the most profitable sales representative with
3. Based on this analysis, Mr. Takamatsu must either increase sales or decrease expenses. To best
increase sales, Mr. Takamatsu should sit down and have a talk with Mr. Fujita about increasing his