Current
A
sset
s
Current
Liabilities
Working
Ca
p
ital
Current Ratio
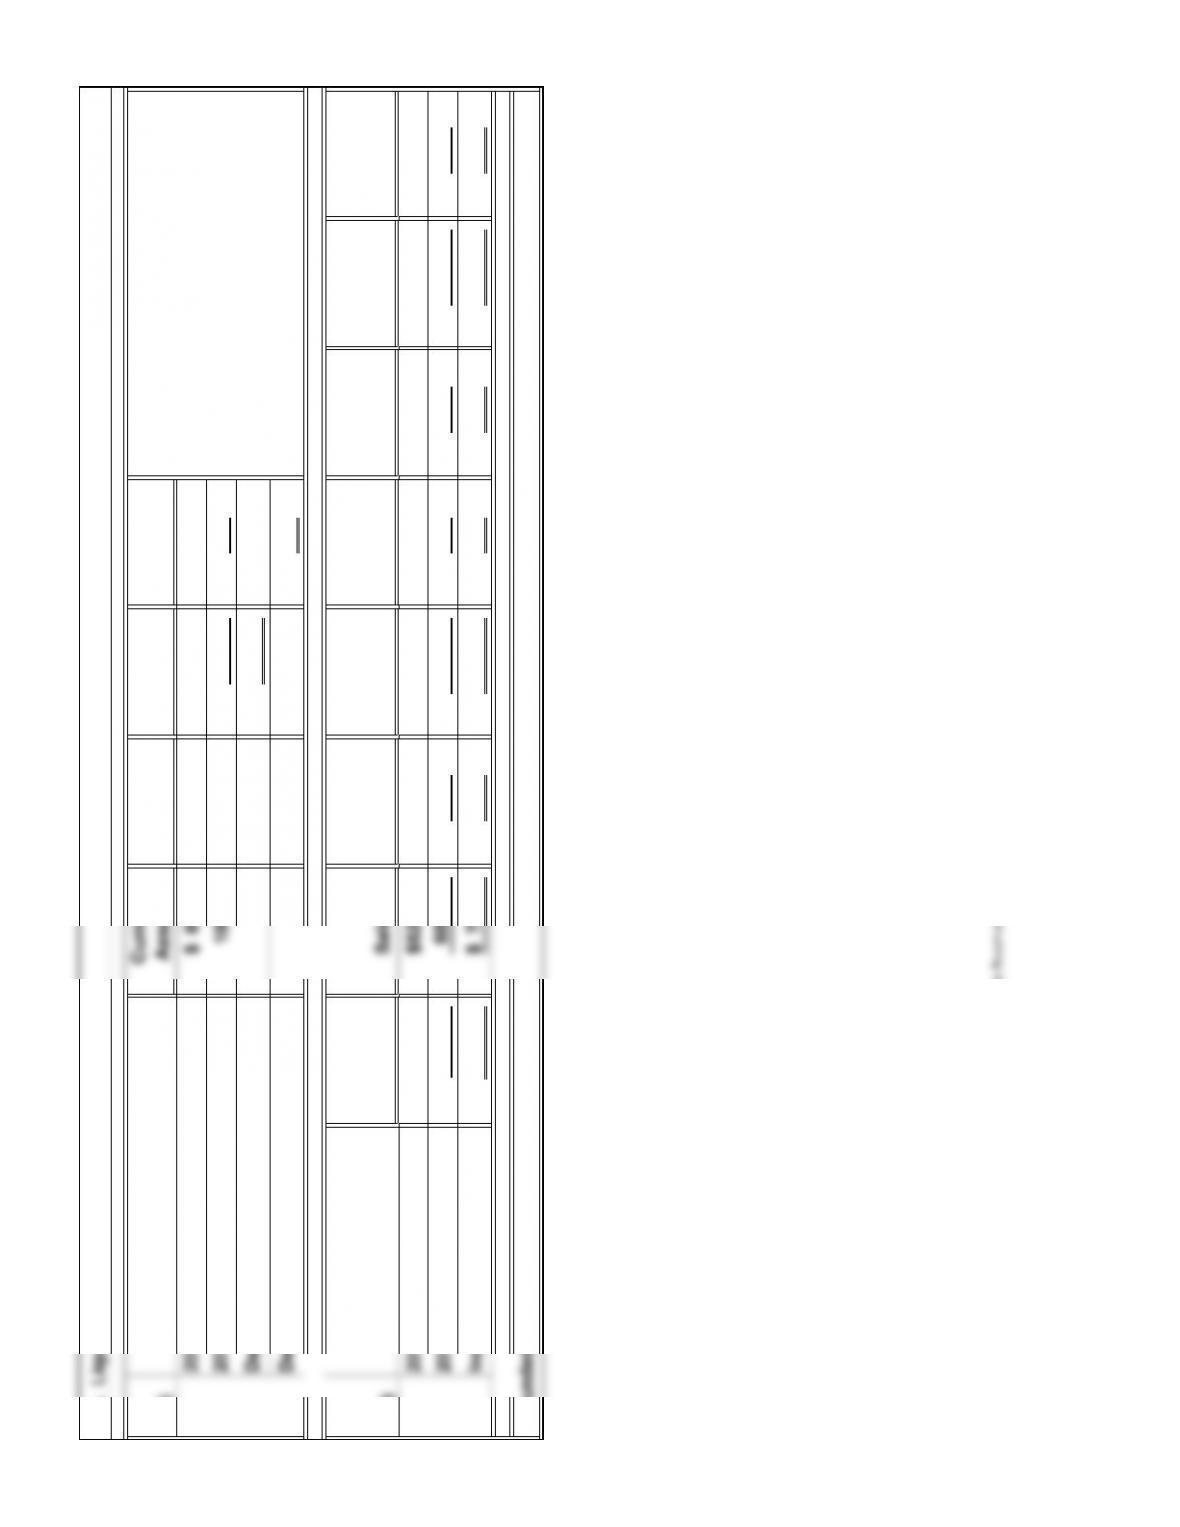
$ 85,000 $25,000 $60,000 3.40
100,000 45,000 55,000 2.22
$ 5,000
1.18
Net
Income Sales Profit Margin
Average
Total Asset
Assets
Turnover
Return on
Assets
A
verage
Owner’s
Equity
Return on
Equity
E8A. Liquidity and Profitability Ratios
*Rounded
1.(b)
1.(a)
*
*
*
*
*
*
5-10
© 2014 Cengage Learning. All Rights Reserved. May not be scanned, copied, duplicated, or posted to a publicly accessible website, in whole or in part.
2.
2013 $ 50,000 $305,000 16.39%
Note to Instructor: Solutions for Exercises: Set B are provided separately on the Instructor’s
Resource CD and website.
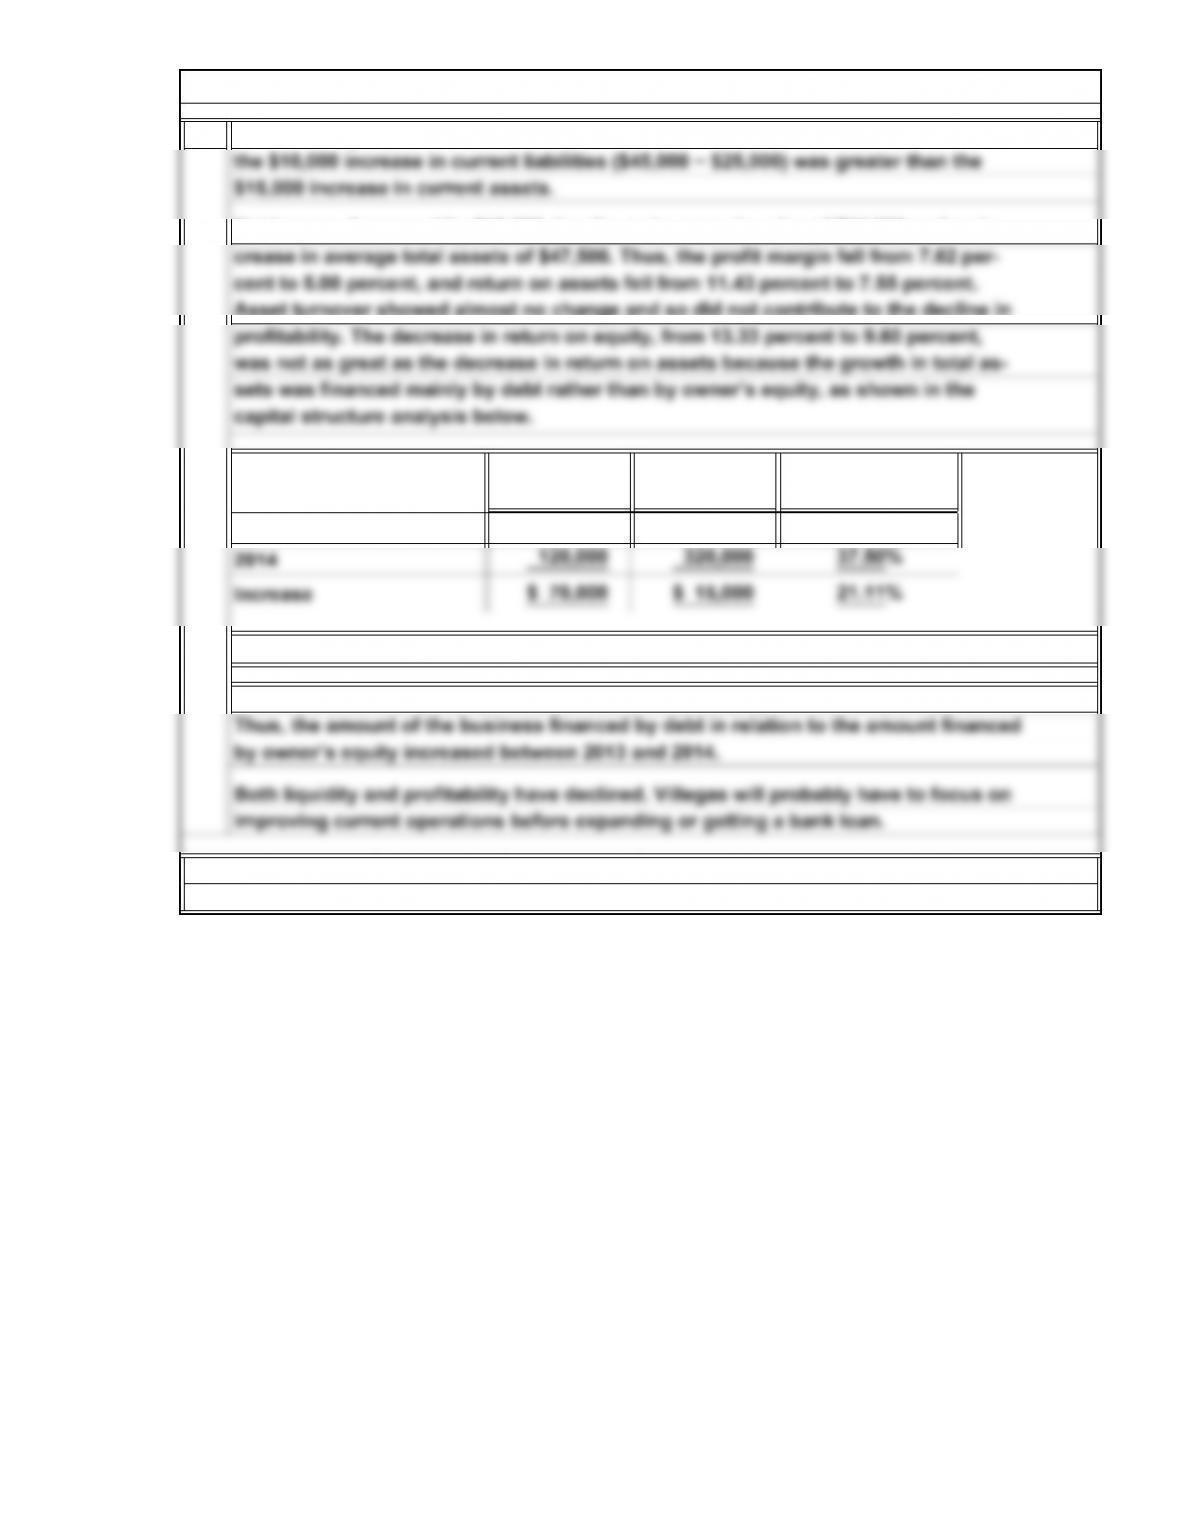
Total liabilities increased by $70,000, while owner’s equity increased by $15,000.
Debt to Equity
Ratio
Owner’s
Equity
Total
Liabilities
Net income decreased by $10,000 despite an increase in sales of $75,000 and an in-
was not as great as the decrease in return on assets because the growth in total as-
sets was financed mainly by debt rather than by owner’s equity, as shown in the
capital structure analysis below.
Asset turnover showed almost no change and so did not contribute to the decline in
profitability. The decrease in return on equity, from 13.33 percent to 9.60 percent,
the $10,000 increase in current liabilities ($45,000 − $25,000) was greater than the
E8A. Liquidity and Profitability Ratios (Concluded)
Both working capital and the current ratio declined between 2013 and 2014 because
*Rounded
*
5-11
© 2014 Cengage Learning. All Rights Reserved. May not be scanned, copied, duplicated, or posted to a publicly accessible website, in whole or in part.
1.
6.
7.
Problems
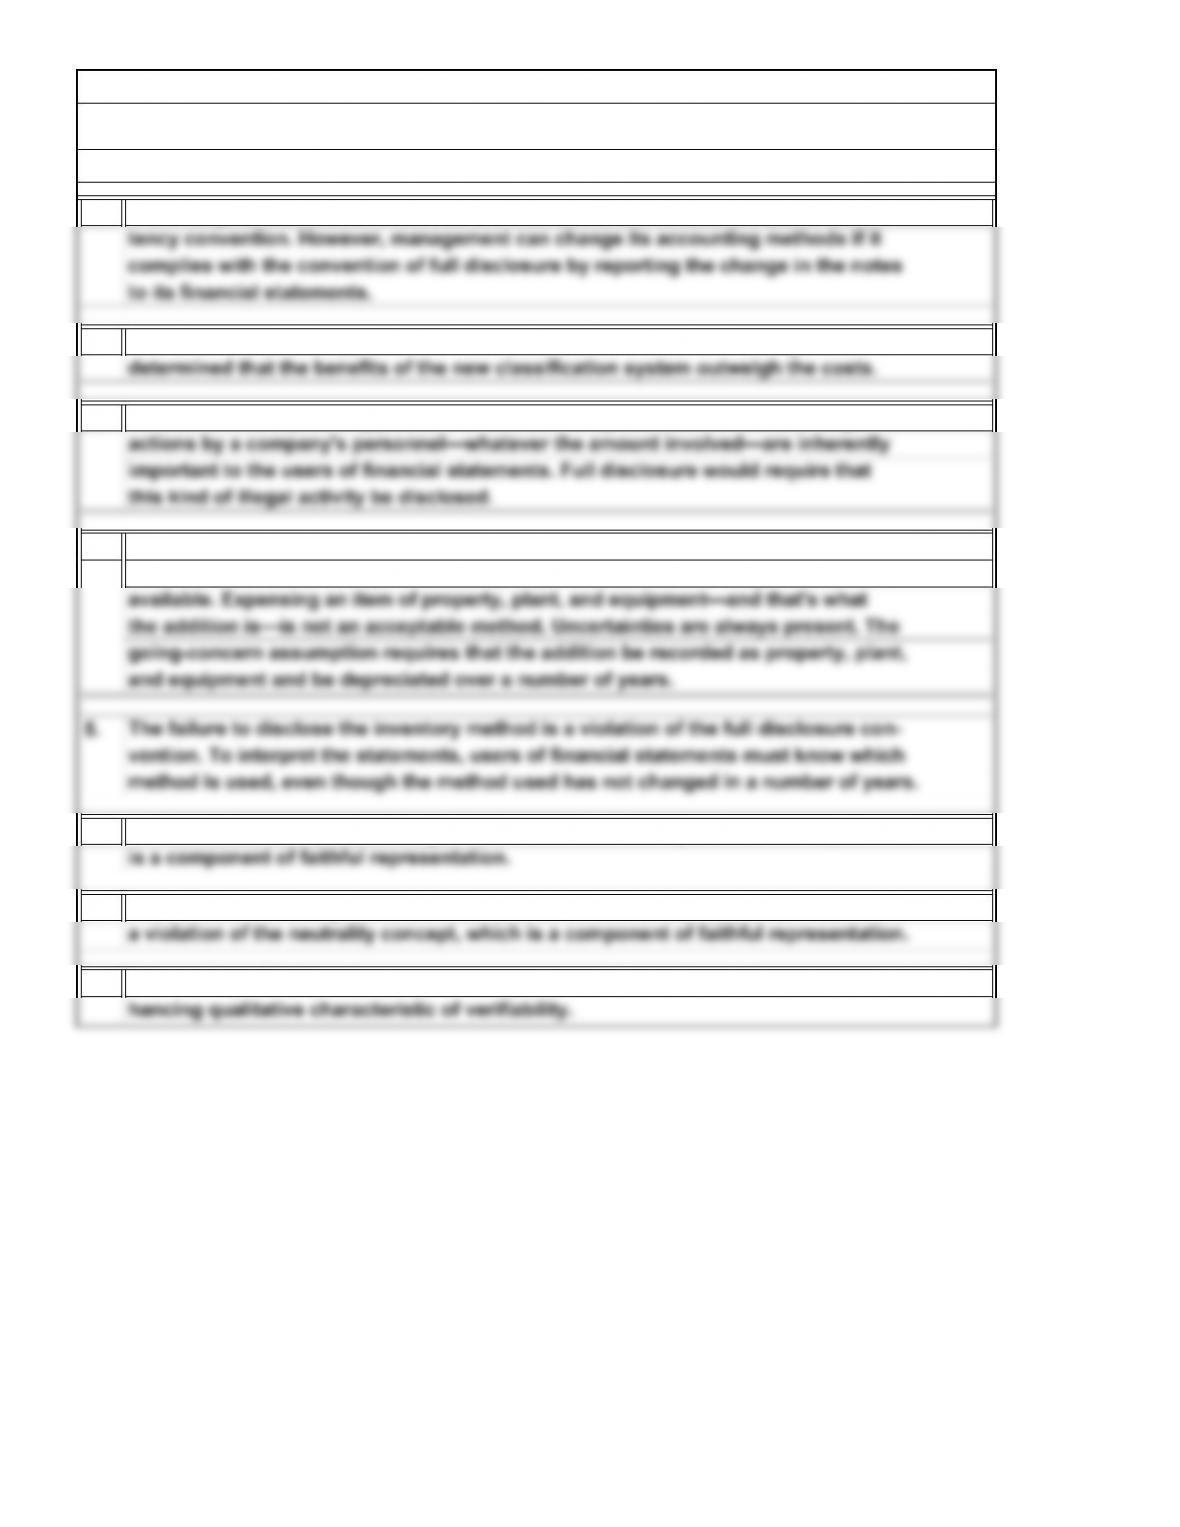
P1. Qualitative Characteristics and Accounting Conventions
The change in depreciation methods is a violation of the comparability and consis-
The failure to include the buildings is a violation of the completeness concept, which
is a component of faithful representation.
The practice of making financial statements as attractive as possible for the bank is
5-12
© 2014 Cengage Learning. All Rights Reserved. May not be scanned, copied, duplicated, or posted to a publicly accessible website, in whole or in part.
1.
$ 32,000
33,000
Current liabilities:
Accounts payable $114,600
Long-term liabilities:
J. Smith, capital $396,960
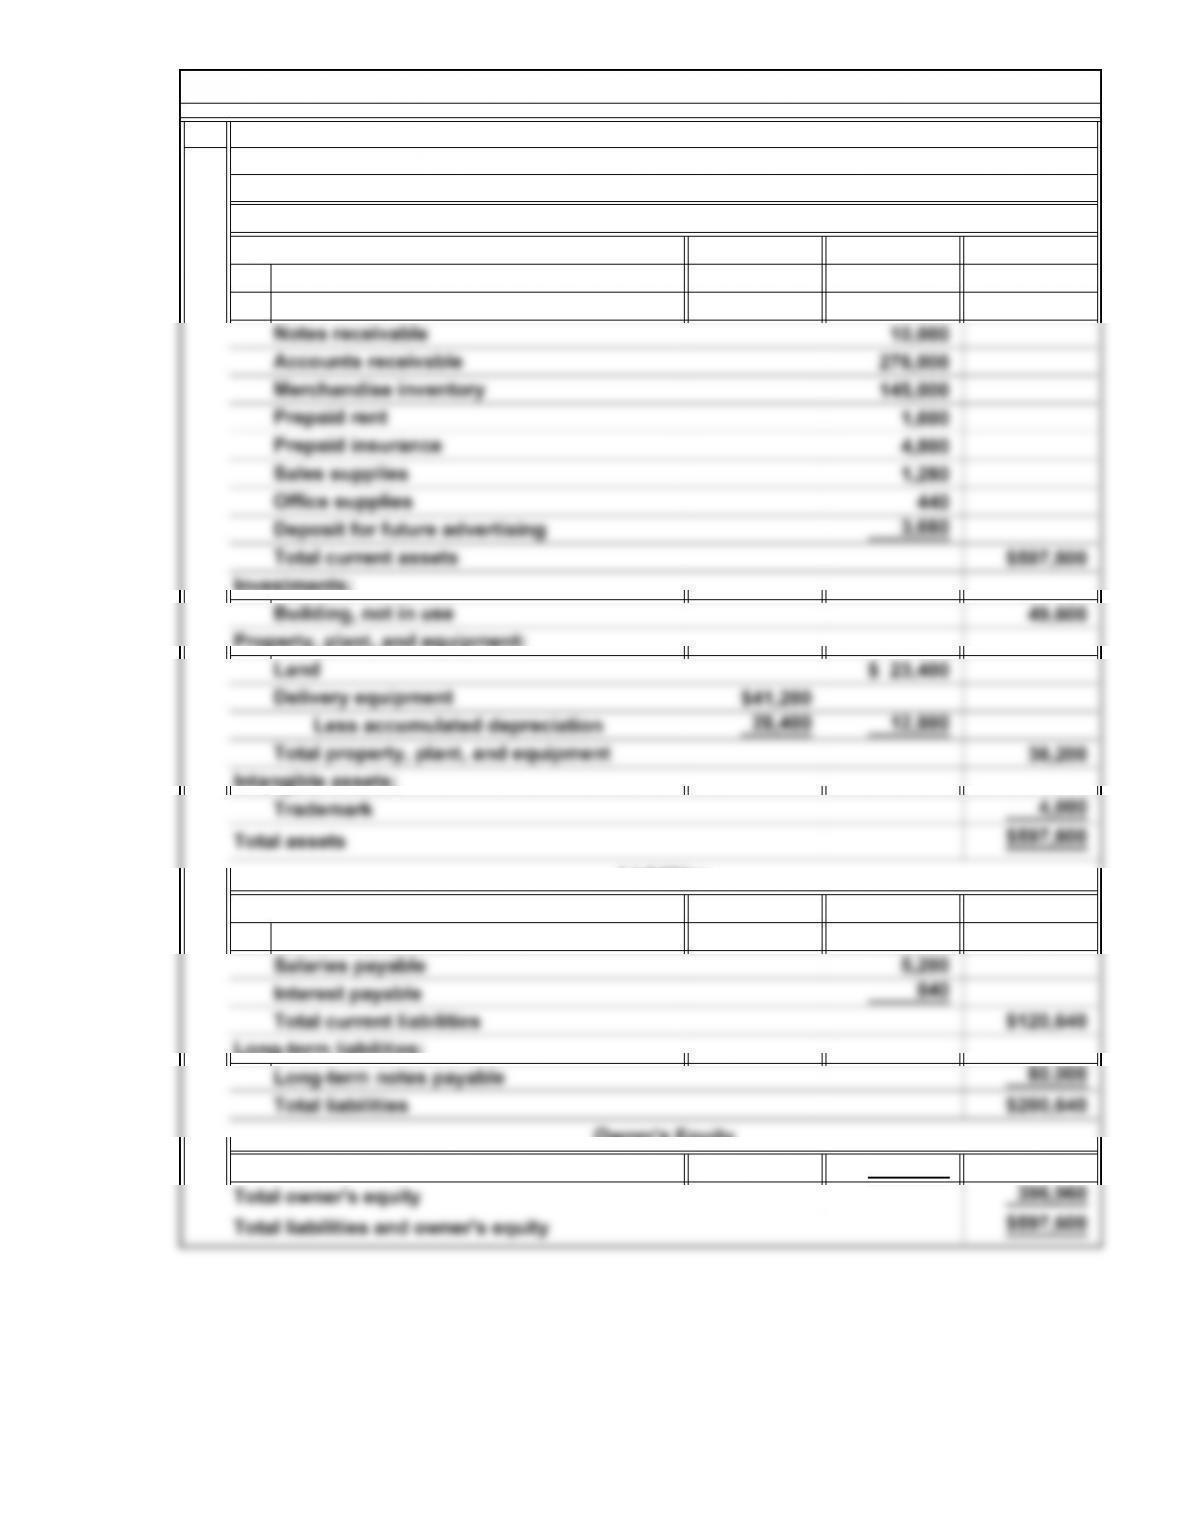
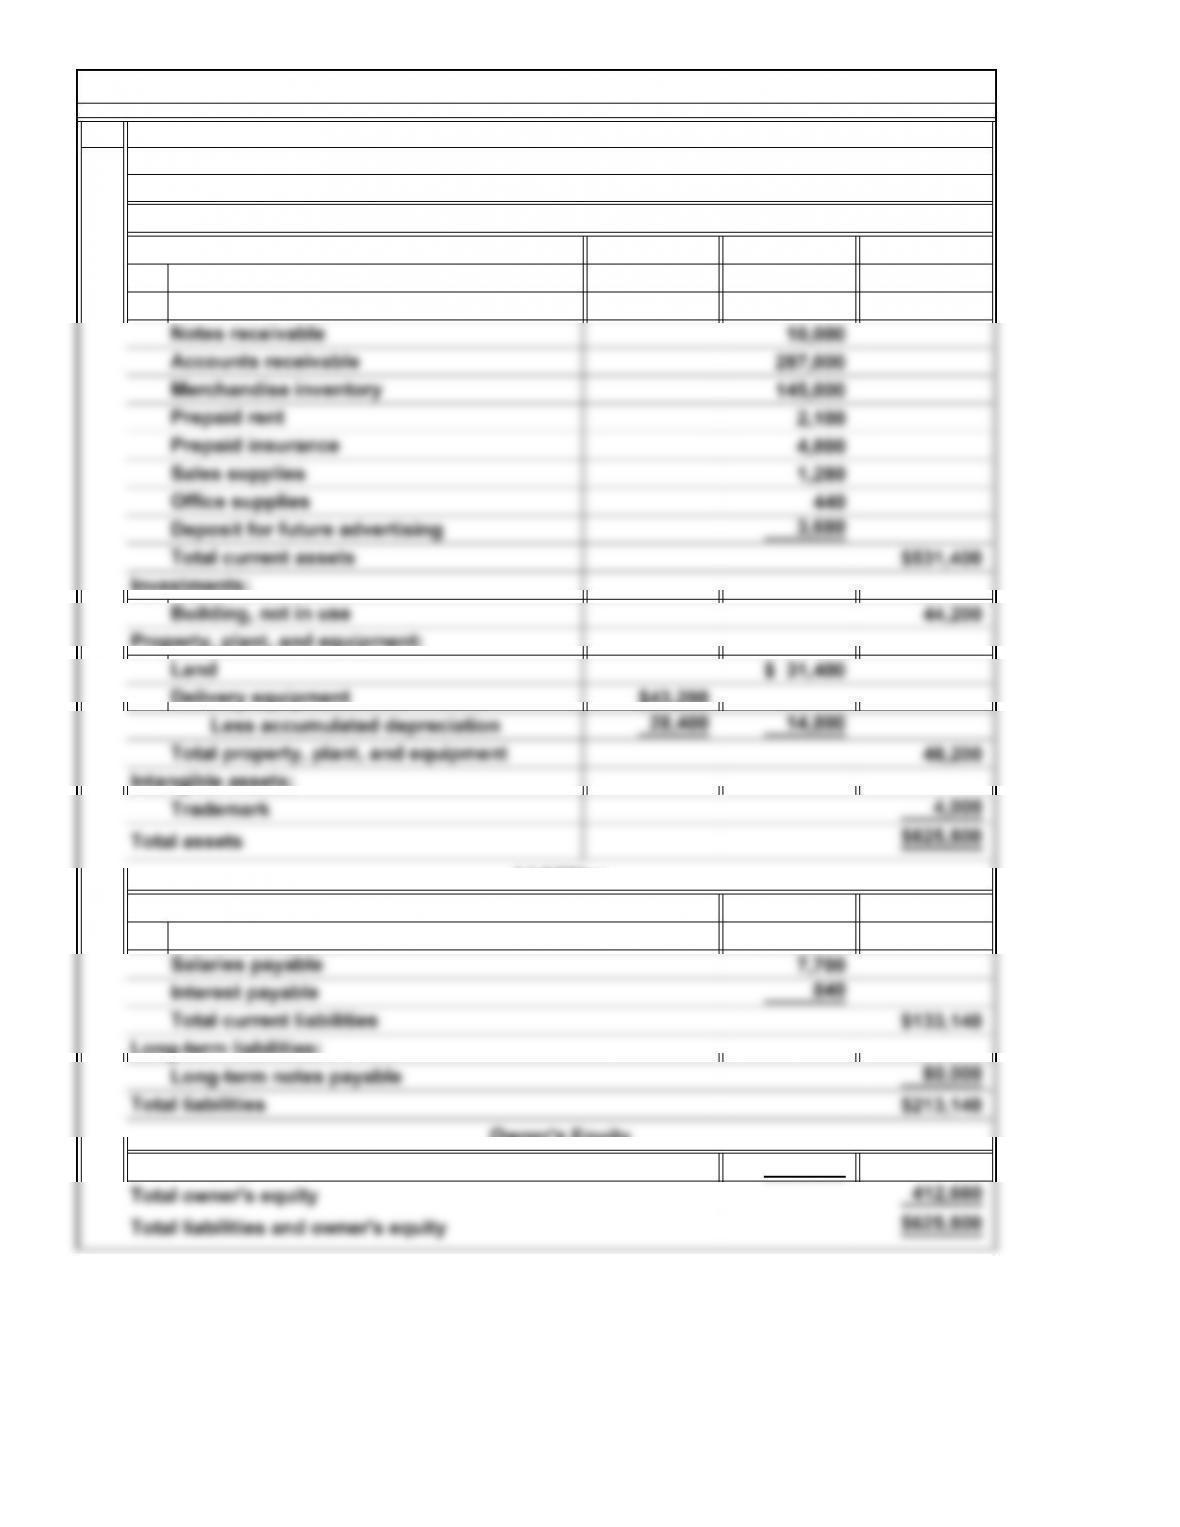
P2. Classified Balance Sheet
June 30, 2014
Current assets:
Cash
Assets
Jason’s Hardware Company
Balance Sheet
Short-term investments
Liabilities
Owner’s Equity
5-13
© 2014 Cengage Learning. All Rights Reserved. May not be scanned, copied, duplicated, or posted to a publicly accessible website, in whole or in part.
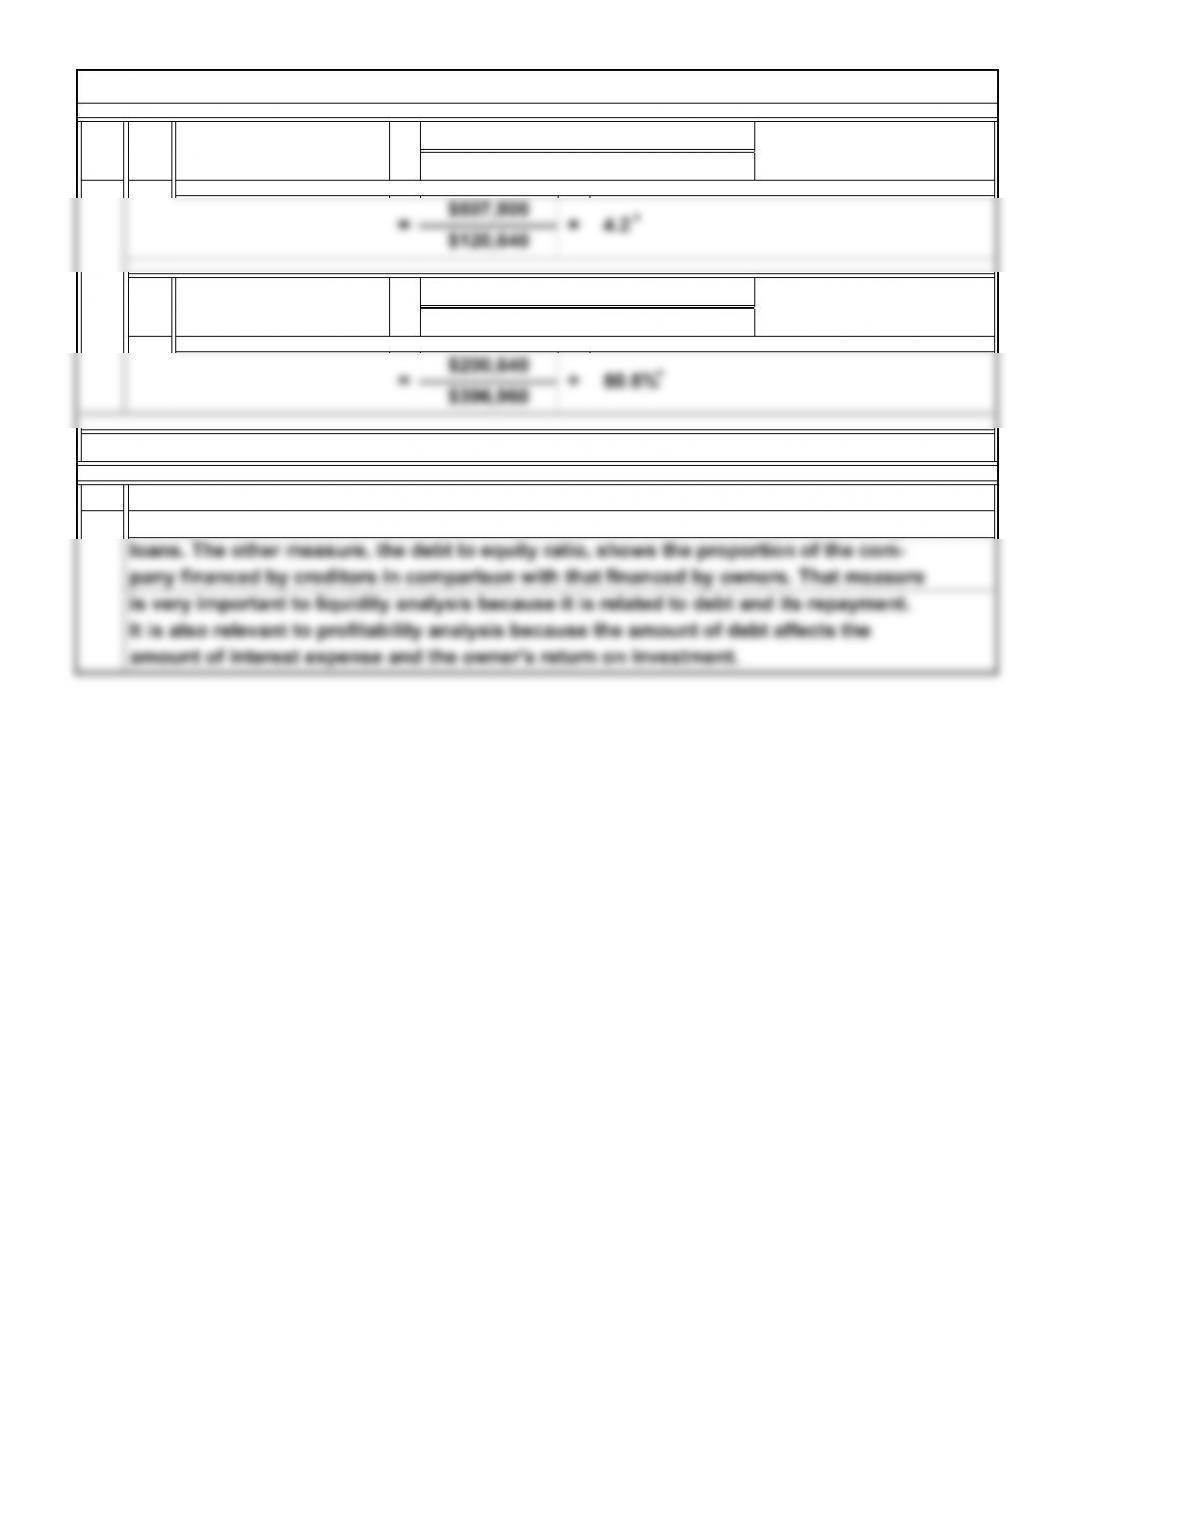
$507,800
2. a.
P2. Classified Balance Sheet (Concluded)
=Current Assets
Current Ratio Current Liabilities
It is also relevant to profitability analysis because the amount of debt affects the
amount of interest expense and the owner’s return on investment.
5-14
© 2014 Cengage Learning. All Rights Reserved. May not be scanned, copied, duplicated, or posted to a publicly accessible website, in whole or in part.
1. a.
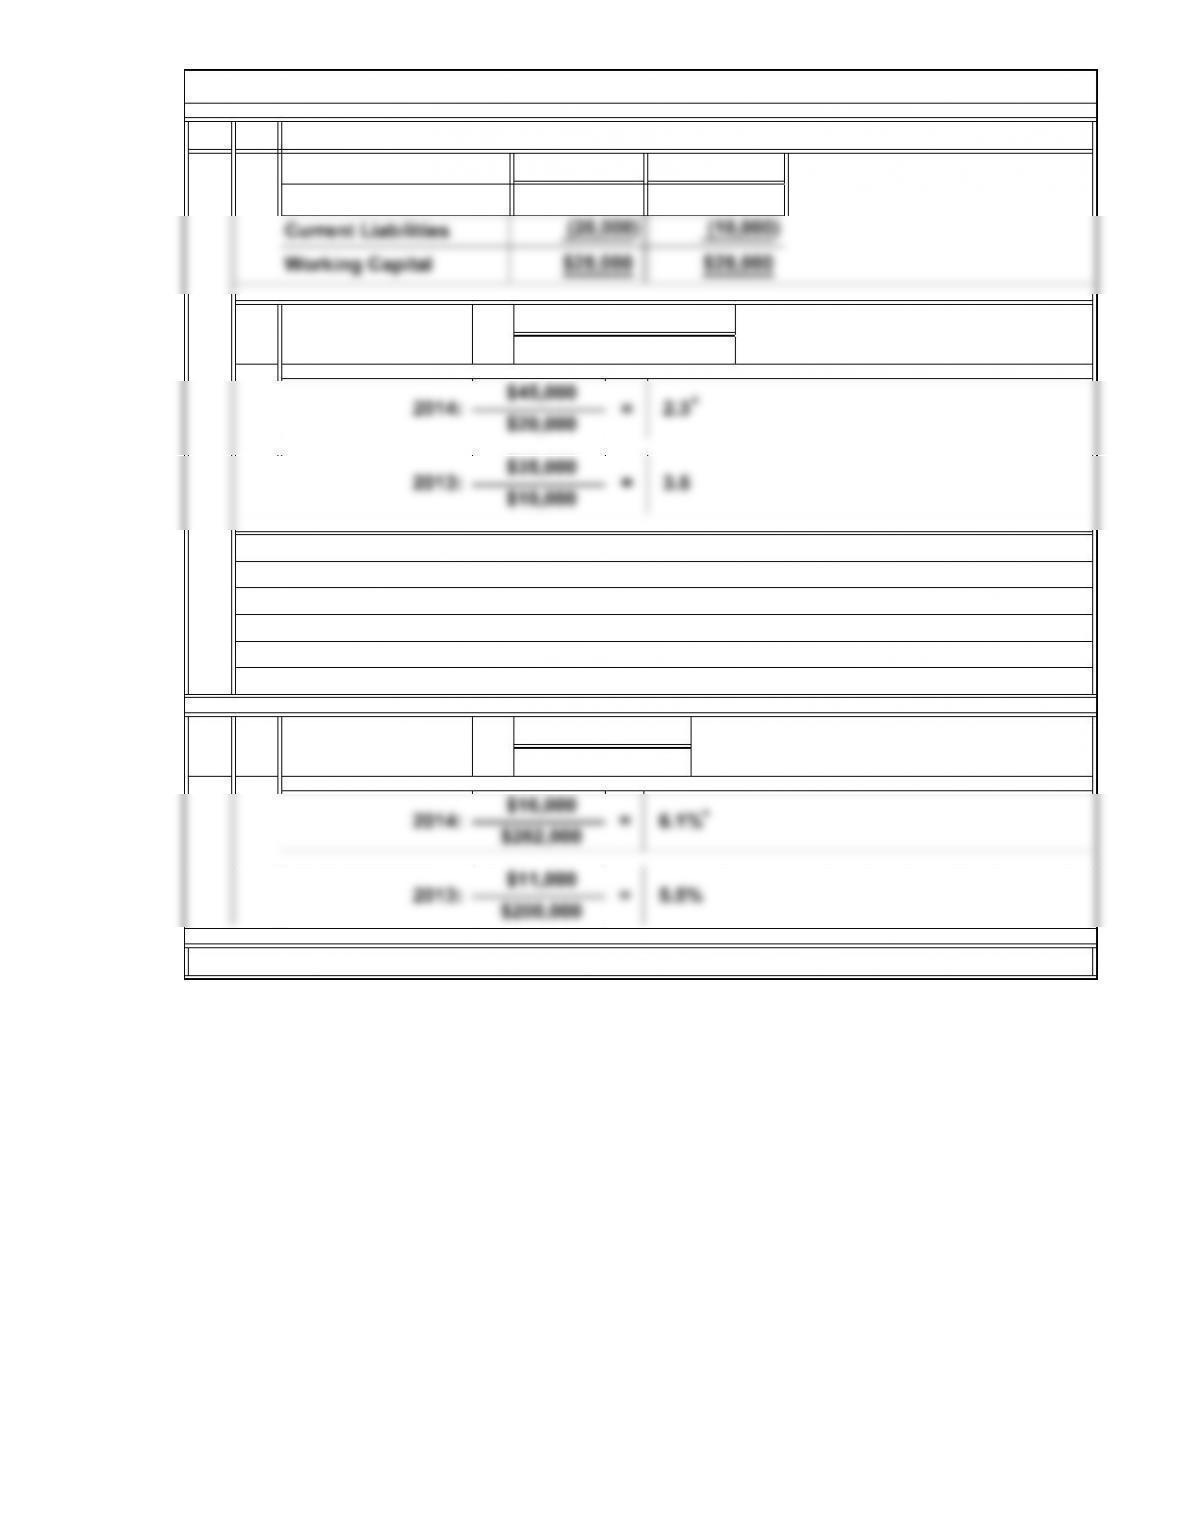
should be monitored regularly.
2.
Working Capital
P3. Liquidity and Profitability Ratios
Although the amount of working capital has stayed the same, the current ratio has de-
2014:
Net Income
Net Sales
=
6.1%
Profit Margin
=
=
a.
5.5%
$262,000
2013: $200,000
$16,000
$25,000
2013
Working Capital
$35,000
$25,000
(10,000)(20,000)
$20,000) at the same time that the numerator was increasing only 28.6 percent ($35,000
$45,000Current Assets
Current Assets
=Current Liabilities
Current Ratio
3.5
2.3
clined from 3.5 to 2.3. And although both current assets and current liabilities increased
by $10,000, the current liabilities in the denominator increased 100 percent ($10,000 to
to $45,000). This decrease in the current ratio is a warning: The company’s liquidity
Current Liabilities
2014
b.
=
=
2013:
*Rounded
2014: *
*
5-15
© 2014 Cengage Learning. All Rights Reserved. May not be scanned, copied, duplicated, or posted to a publicly accessible website, in whole or in part.
( + ) / 2
12.5%
2013:
$16,000
$145,000
$16,000
= 2.0
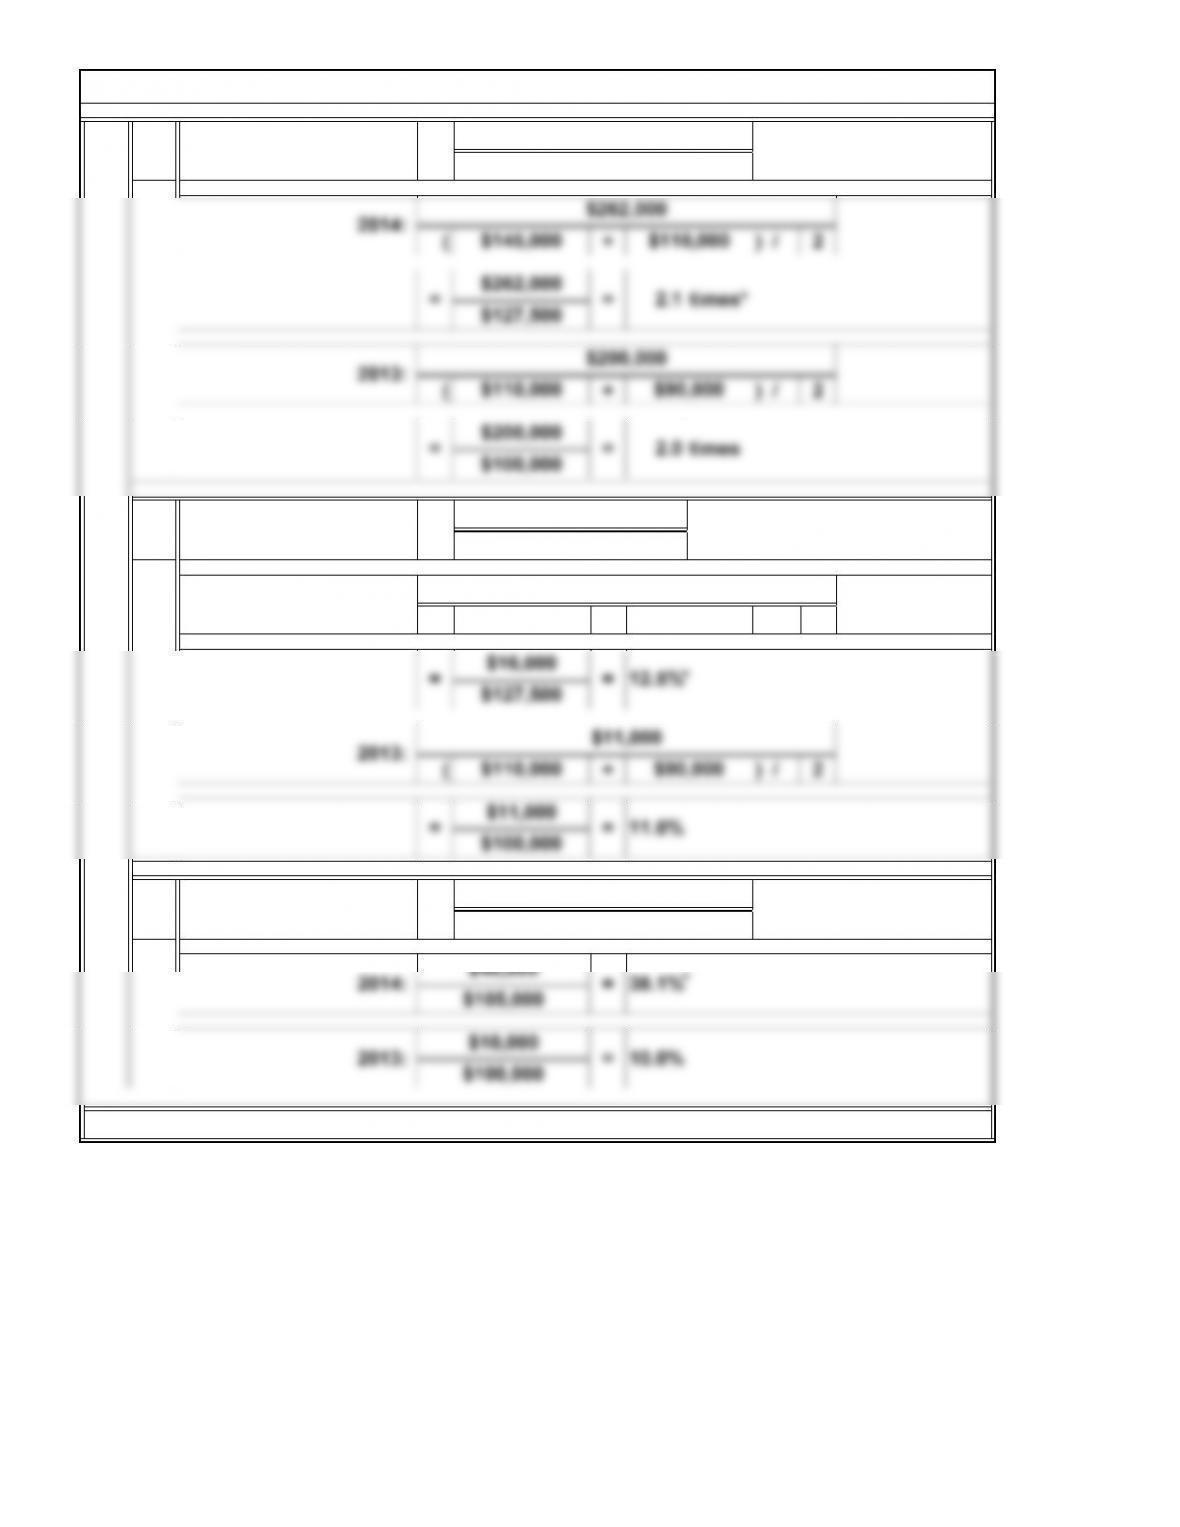
Return on Assets Net Income
Average Total Assets
=
2014:
$262,000
=Asset Turnover
P3. Liquidity and Profitability Ratios (Continued)
c.
Net Sales
Average Total Assets
b.
= times
$100,000
=
2014:
$110,000
*Rounded
*
5-16
© 2014 Cengage Learning. All Rights Reserved. May not be scanned, copied, duplicated, or posted to a publicly accessible website, in whole or in part.
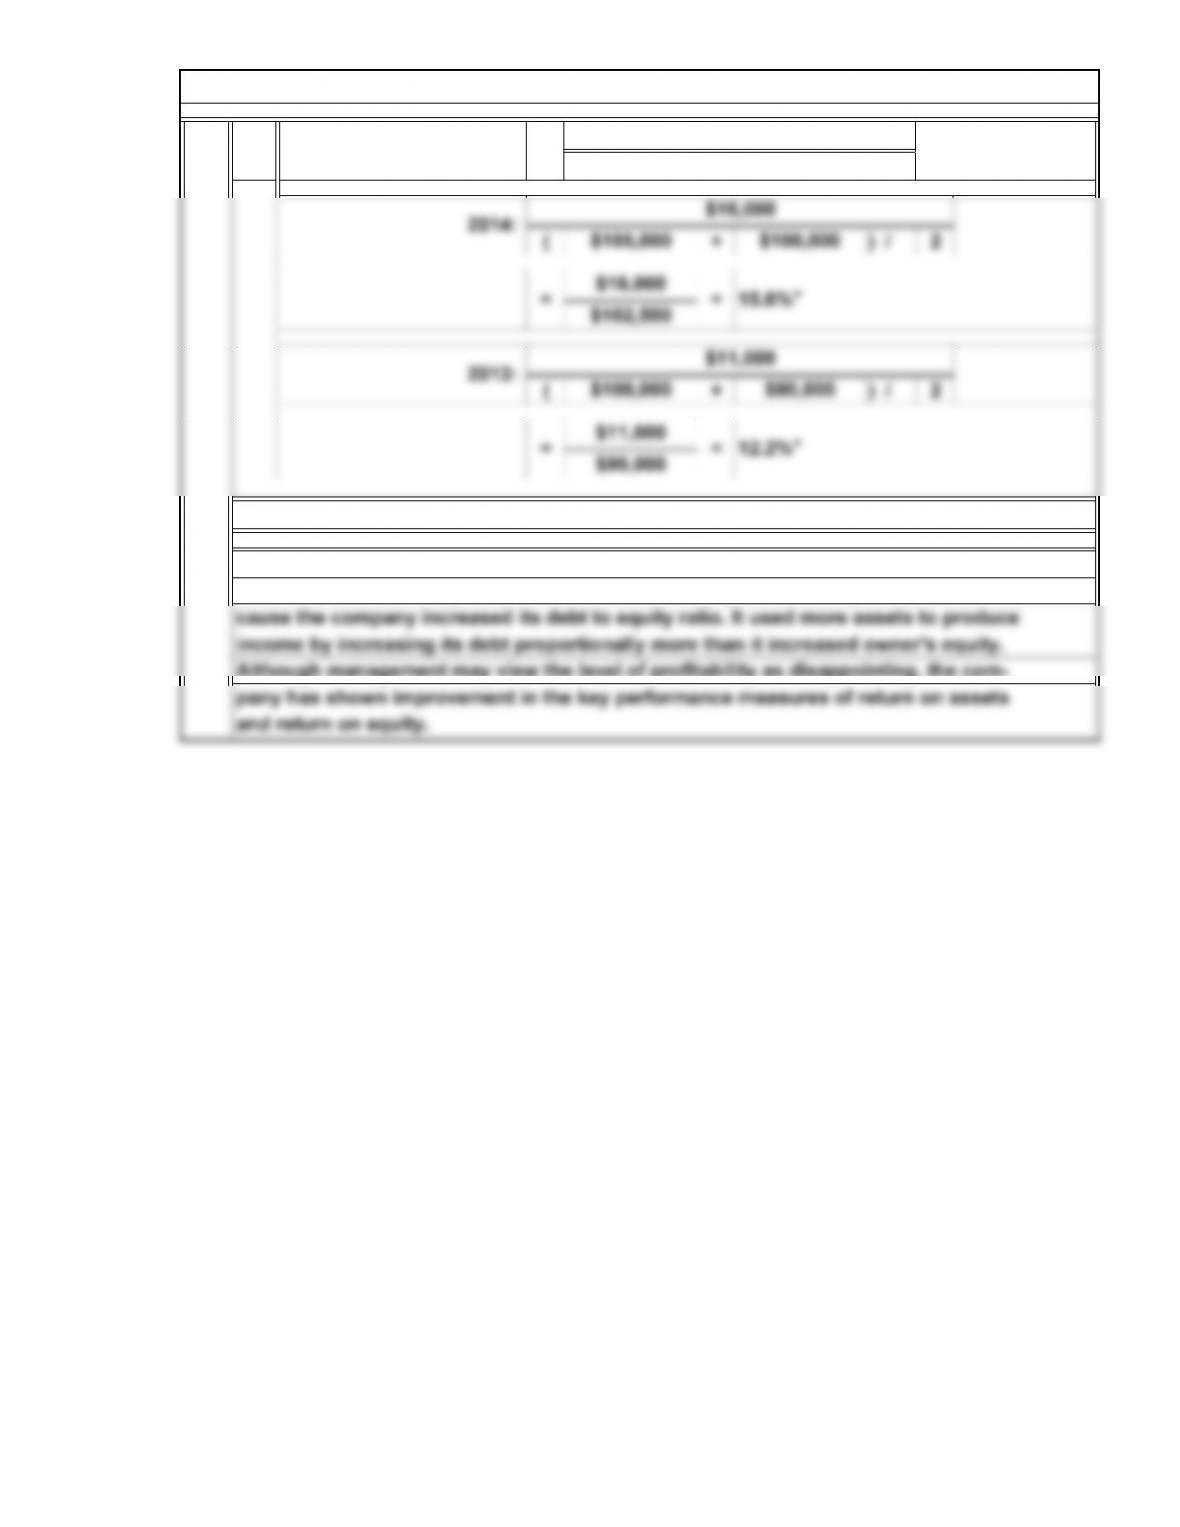
Return on Equity Net Income
2014:
P3. Liquidity and Profitability Ratios (Concluded)
=
Average Owner’s Equity
12.2%
$90,000
$16,000
=
e.
=
Both profit margin and asset turnover increased from 2013 to 2014, causing return
on assets to increase by 1.5 percent. Return on equity increased by 3.4 percent be-
Although management may view the level of profitability as disappointing, the com-
*Rounded
*
5-17
© 2014 Cengage Learning. All Rights Reserved. May not be scanned, copied, duplicated, or posted to a publicly accessible website, in whole or in part.
1.
$ 42,800
34,300
$43,200
$124,600
$412,660
Delivery equipment
P4. Classified Balance Sheet
Cash
Short-term investments
Cullen’s Hardware Company
Balance Sheet
June 30, 2014
Assets
Current assets:
Liabilities
Current liabilities:
Accounts payable
E. Cullen, capital
Owner’s Equity
5-18
© 2014 Cengage Learning. All Rights Reserved. May not be scanned, copied, duplicated, or posted to a publicly accessible website, in whole or in part.