had problems but did not go bankrupt. Both companies have shown improved results of
Thus, liquidity measures such as cash flow yield and cash flows to sales and assets, as
their operations since 2009.
Standard & Poor’s (S&P) judges the financial viability of a company based on its own
well as free cash flow, are also important. Standard & Poors was correct in that General
ment ratios. In addition, since S&P is evaluating the long-term financial viability of the
return on equity, and interest coverage ratio. Closely related is the company’s liquidity.
Motors went bankrupt in 2009 and had to be bailed out by the U.S. government. Ford also
ures, and the current ratio, quick ratio, and turnover ratios are operating asset manage-
same economic situations. Since S&P considers profitability and operating asset manage-
Cases
company, it will take into account financial risk measures such as the debt to equity ratio,
knowledge of past performance of similar companies in the same industries under the
ment in evaluating a company’s rating, it will consider performance measures related to
these goals. For example, profit margin and return on assets are key profitability meas-
C1. Conceptual Understanding: Standards for Financial Performance Evaluation
16-61
© 2014 Cengage Learning. All Rights Reserved. May not be scanned, copied, duplicated, or posted to a publicly accessible website, in whole or in part.
Percentage*
20.2%
Africa Tire 45.8%
16.9%
17.1%
100.0%
4.8% ( /
Africa Tire 10.6% ( /
10.8% ( /
9.4% ( /
C2. Interpreting Financial Reports: Using Segment Information
Based on Exhibit 1, Goodyear’s business segments are: North American Tire; Europe, Middle
East, and Africa Tire; Latin American Tire; and Asia Pacific Tire. The relative size of each seg-
ment in terms of sales and operating income for 2011 is as follows (amounts in millions):
Sales Operating Income
Segment Amount Percentage* Amount
North American Tire $ 9,859 43.3% $ 276
Europe, Middle East, and
8,040 35.3% 627
Latin American Tire 2,472 10.9% 231
Asia Pacific Tire 2,396 10.5% 234
Totals $22,767 100.0% $1,368
The North American Tire segment is the largest segment in terms of sales (43.3 percent) but it
was second in terms of operating income in 2011. In term of operating income, the Europe, Mid-
dle East, and Africa Tire was most profitable in 2011 (45.8 percent of total net income). Finally,
the Asia Pacific Tire is the most profitable because it generated 17.1 percent of operating in-
come from only 10.5 percent of net sales. However, return on assets, which is a good measure
of profitability performance, tells a different story. The measures for all four segments are as
follows:*
Latin American Tire $231 $2,141
Europe, Middle East, and
$627 $5,915
North American Tire $276 $5,744
Overall, the most profitable segment in terms of return on assets is Latin American Tire; fol-
lowed by Europe, Middle East, and Africa Tire; and Asia Pacific Tire. North American Tire is
the least profitable of all four segments.
Asia Pacific Tire $234 $2,482
)
)
)
)
*Rounded
16-62
© 2014 Cengage Learning. All Rights Reserved. May not be scanned, copied, duplicated, or posted to a publicly accessible website, in whole or in part.
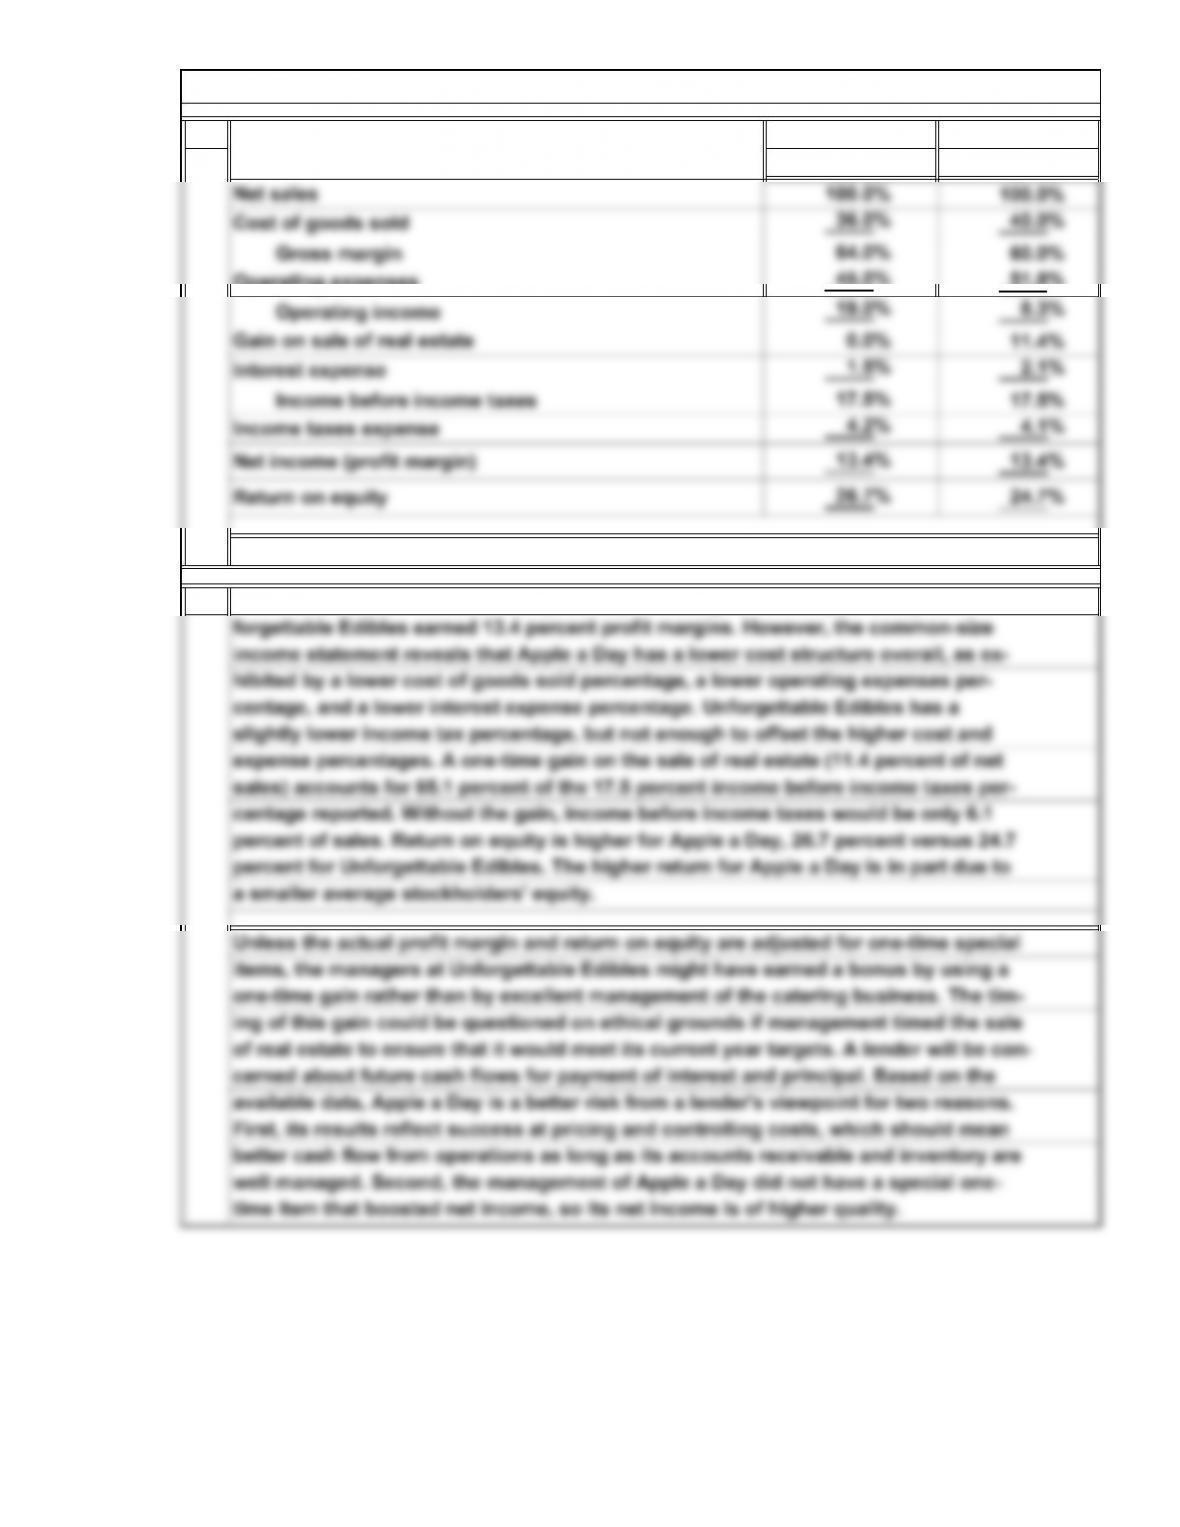
1. Unforgettable
Edibles*
51.8%
2.
Operating expenses 45.0%
C3. Interpreting Financial Reports: Effect of a One-Time Item on a Loan Decision
*Additions and subtractions of percentages are inexact due to rounding.
Apple a Day*
It is true that both firms have comparable profit margins. Both Apple a Day and Un-
cerned about future cash flows for payment of interest and principal. Based on the
available data, Apple a Day is a better risk from a lender’s viewpoint for two reasons.
First, its results reflect success at pricing and controlling costs, which should mean
better cash flow from operations as long as its accounts receivable and inventory are
well managed. Second, the management of Apple a Day did not have a special one-
time item that boosted net income, so its net income is of higher quality.
16-63
© 2014 Cengage Learning. All Rights Reserved. May not be scanned, copied, duplicated, or posted to a publicly accessible website, in whole or in part.
( + ) / 2 ( + ) / 2
+– +–
==
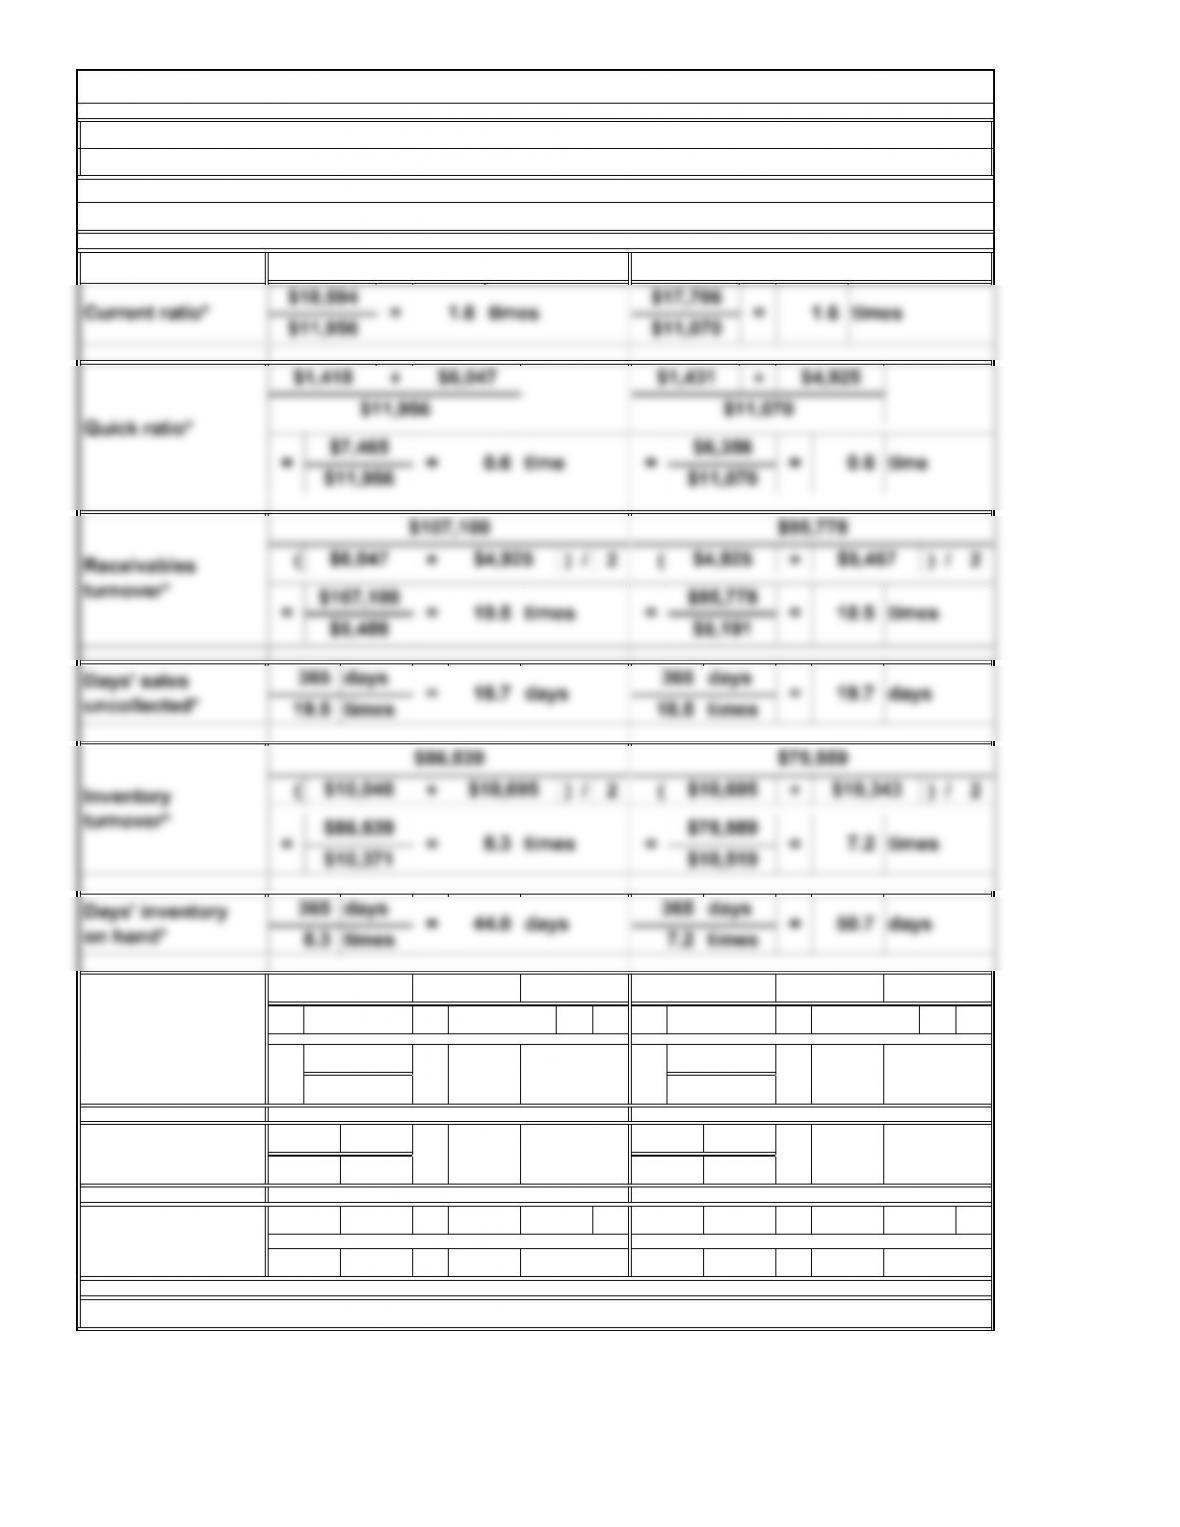
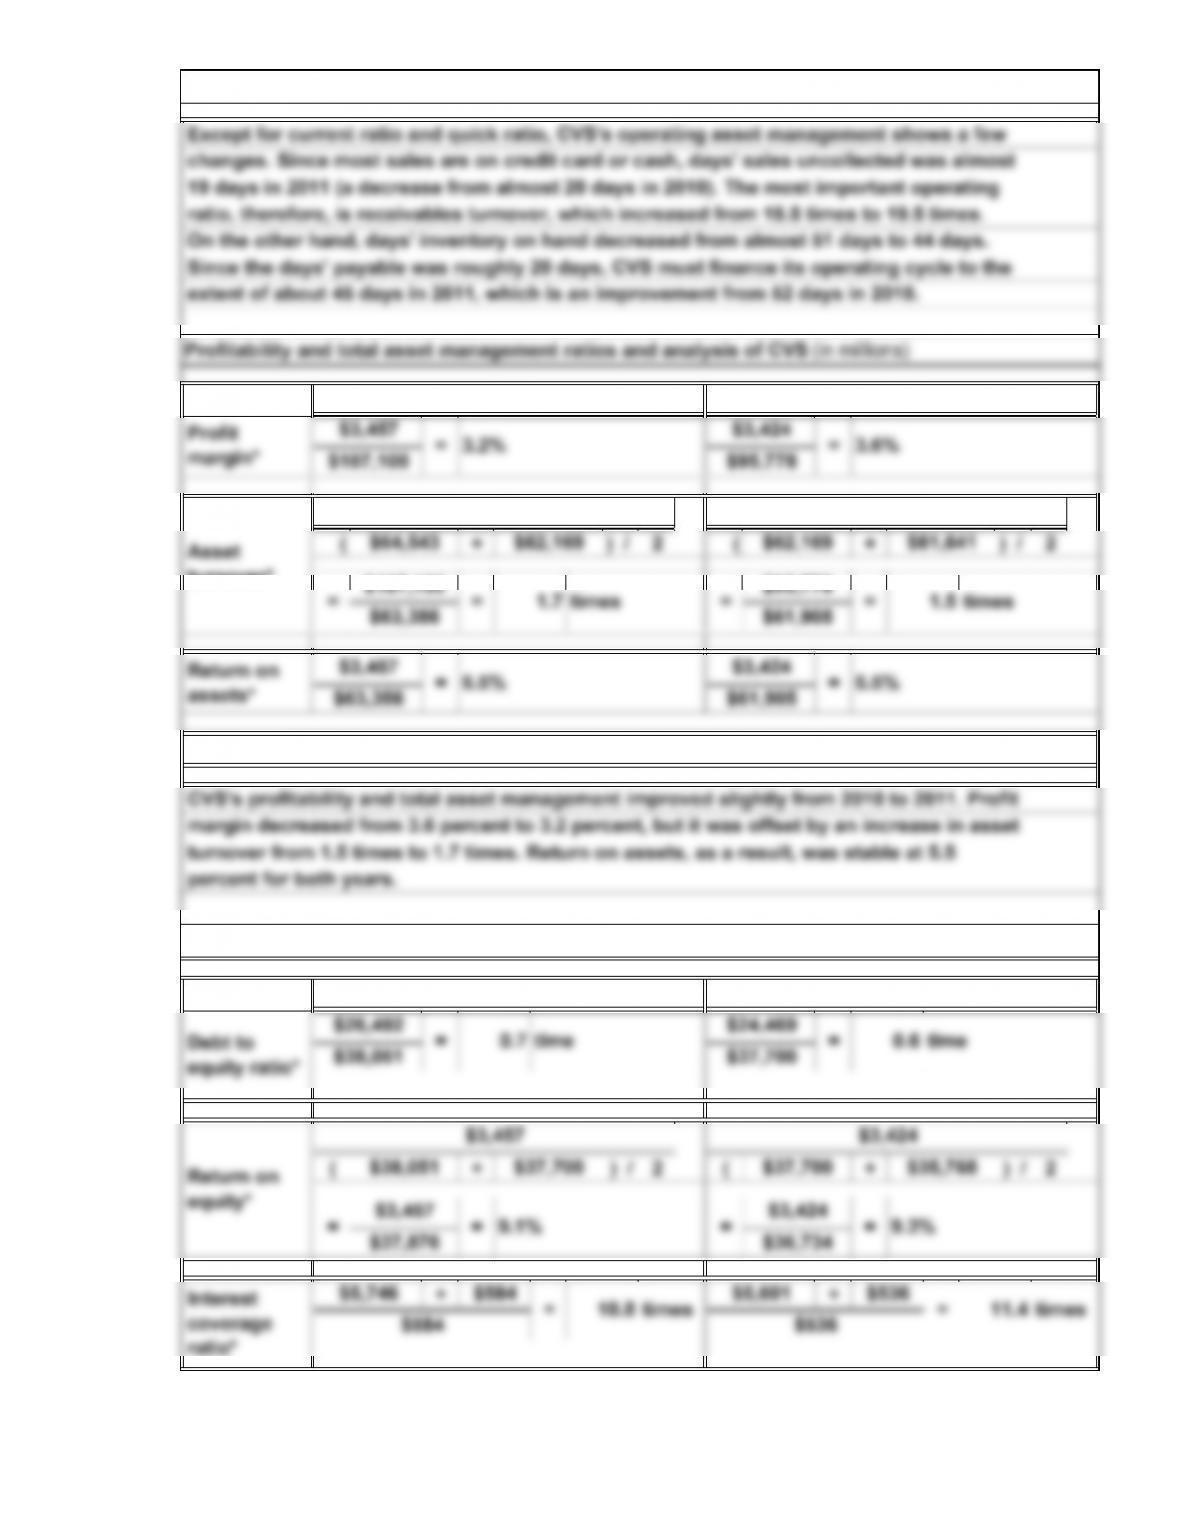
Operating asset management ratios and analysis of CVS (in millions)
Note that cash includes short-term investments.
All computations are for the years ended December 31, 2011 and December 31, 2010.
C4. Interpreting Financial Reports: Comprehensive Ratio Analysis
2010
2011
$352
$75,559 +
=20.5=
times
365 days 18.3 days
Financing period
17.8
44.0 days
days44.9 days
$75,911
= 17.8 days
20.5 times
Days’ payable* 365 days
days 19.7
*Rounded
days 18.7
18.3 days 52.1
days 50.7
days
=
20.0
=
20.0
$4,370 $4,026
$4,198
$86,539
$85,890
$4,026 $3,560
$3,793 times
Payables
turnover*
+
times
$(649)
=
16-64
© 2014 Cengage Learning. All Rights Reserved. May not be scanned, copied, duplicated, or posted to a publicly accessible website, in whole or in part.
C4. Interpreting Financial Reports: Comprehensive Ratio Analysis (Continued)
On the other hand, days’ inventory on hand decreased from almost 51 days to 44 days.
ratio, therefore, is receivables turnover, which increased from 18.5 times to 19.5 times.
changes. Since most sales are on credit card or cash, days’ sales uncollected was almost
extent of about 45 days in 2011, which is an improvement from 52 days in 2010.
19 days in 2011 (a decrease from almost 20 days in 2010). The most important operating
Except for current ratio and quick ratio, CVS’s operating asset management shows a few
Since the days’ payable was roughly 20 days, CVS must finance its operating cycle to the
$95,778$107,100
ratio*
16-65
© 2014 Cengage Learning. All Rights Reserved. May not be scanned, copied, duplicated, or posted to a publicly accessible website, in whole or in part.
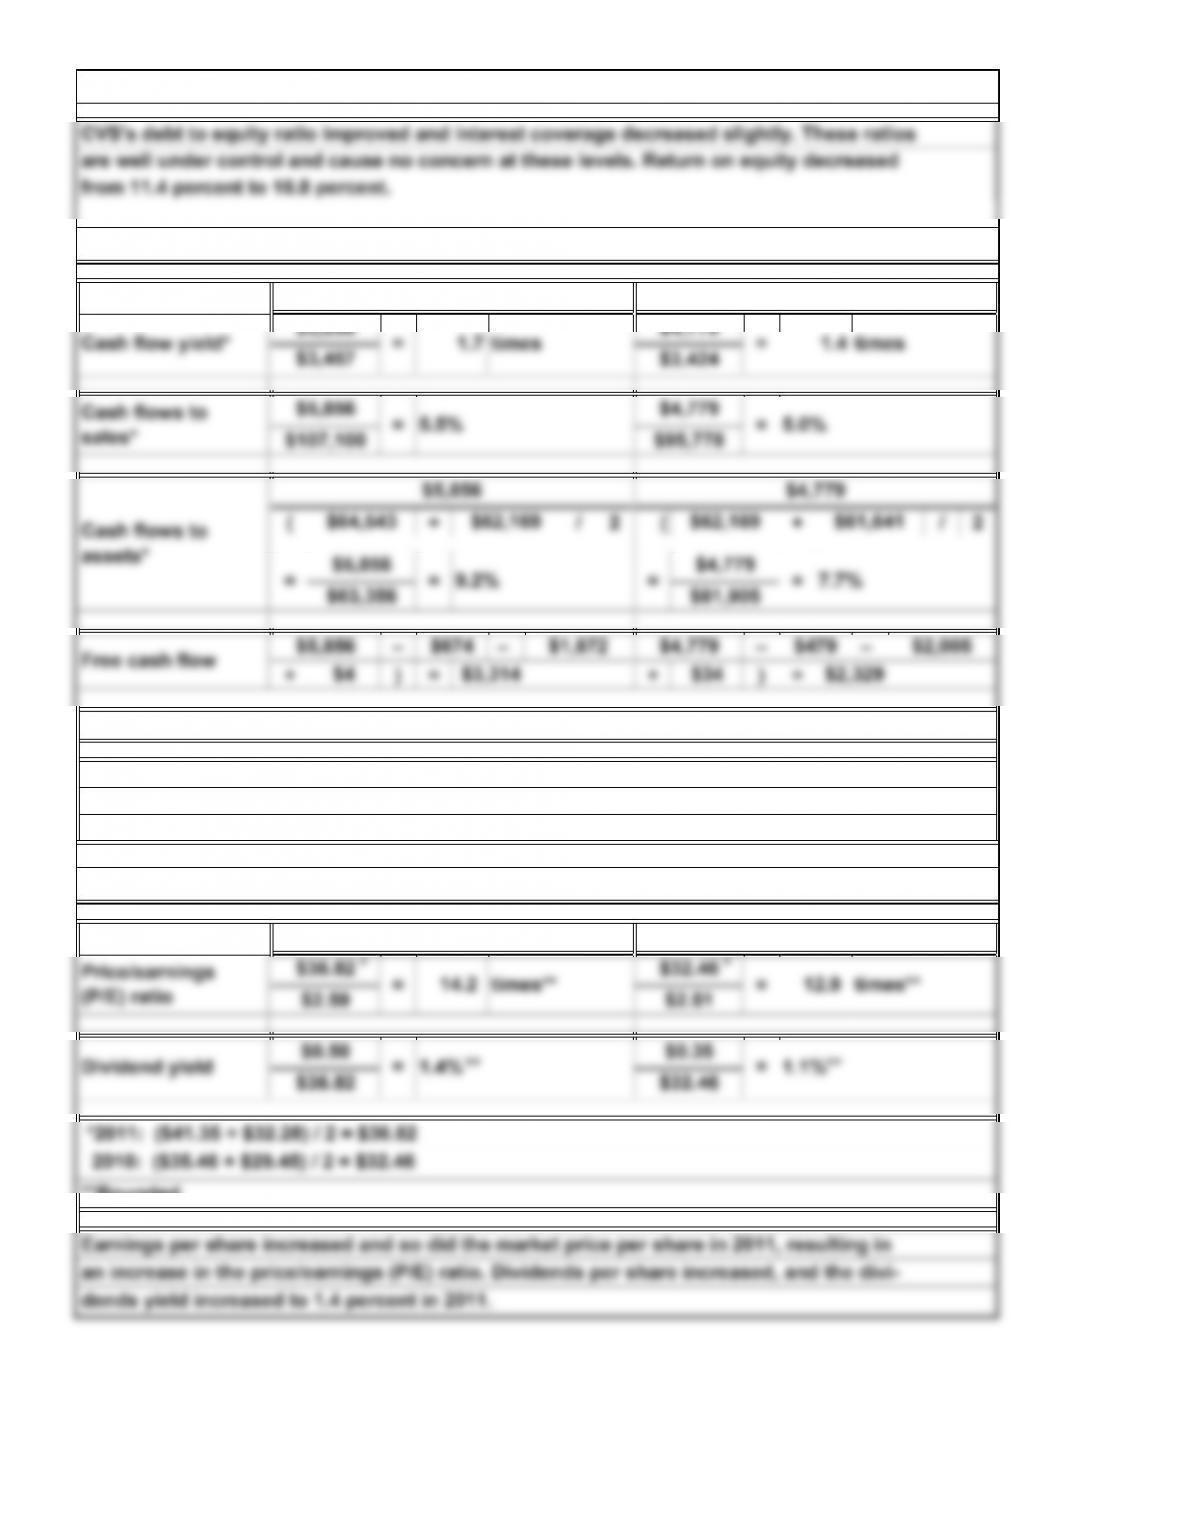
C4. Interpreting Financial Reports: Comprehensive Ratio Analysis (Concluded)
**Rounded
an increase in the price/earnings (P/E) ratio. Dividends per share increased, and the divi-
dends yield increased to 1.4 percent in 2011.
Earnings per share increased and so did the market price per share in 2011, resulting in
16-66
© 2014 Cengage Learning. All Rights Reserved. May not be scanned, copied, duplicated, or posted to a publicly accessible website, in whole or in part.
Profitability and total
asset management:
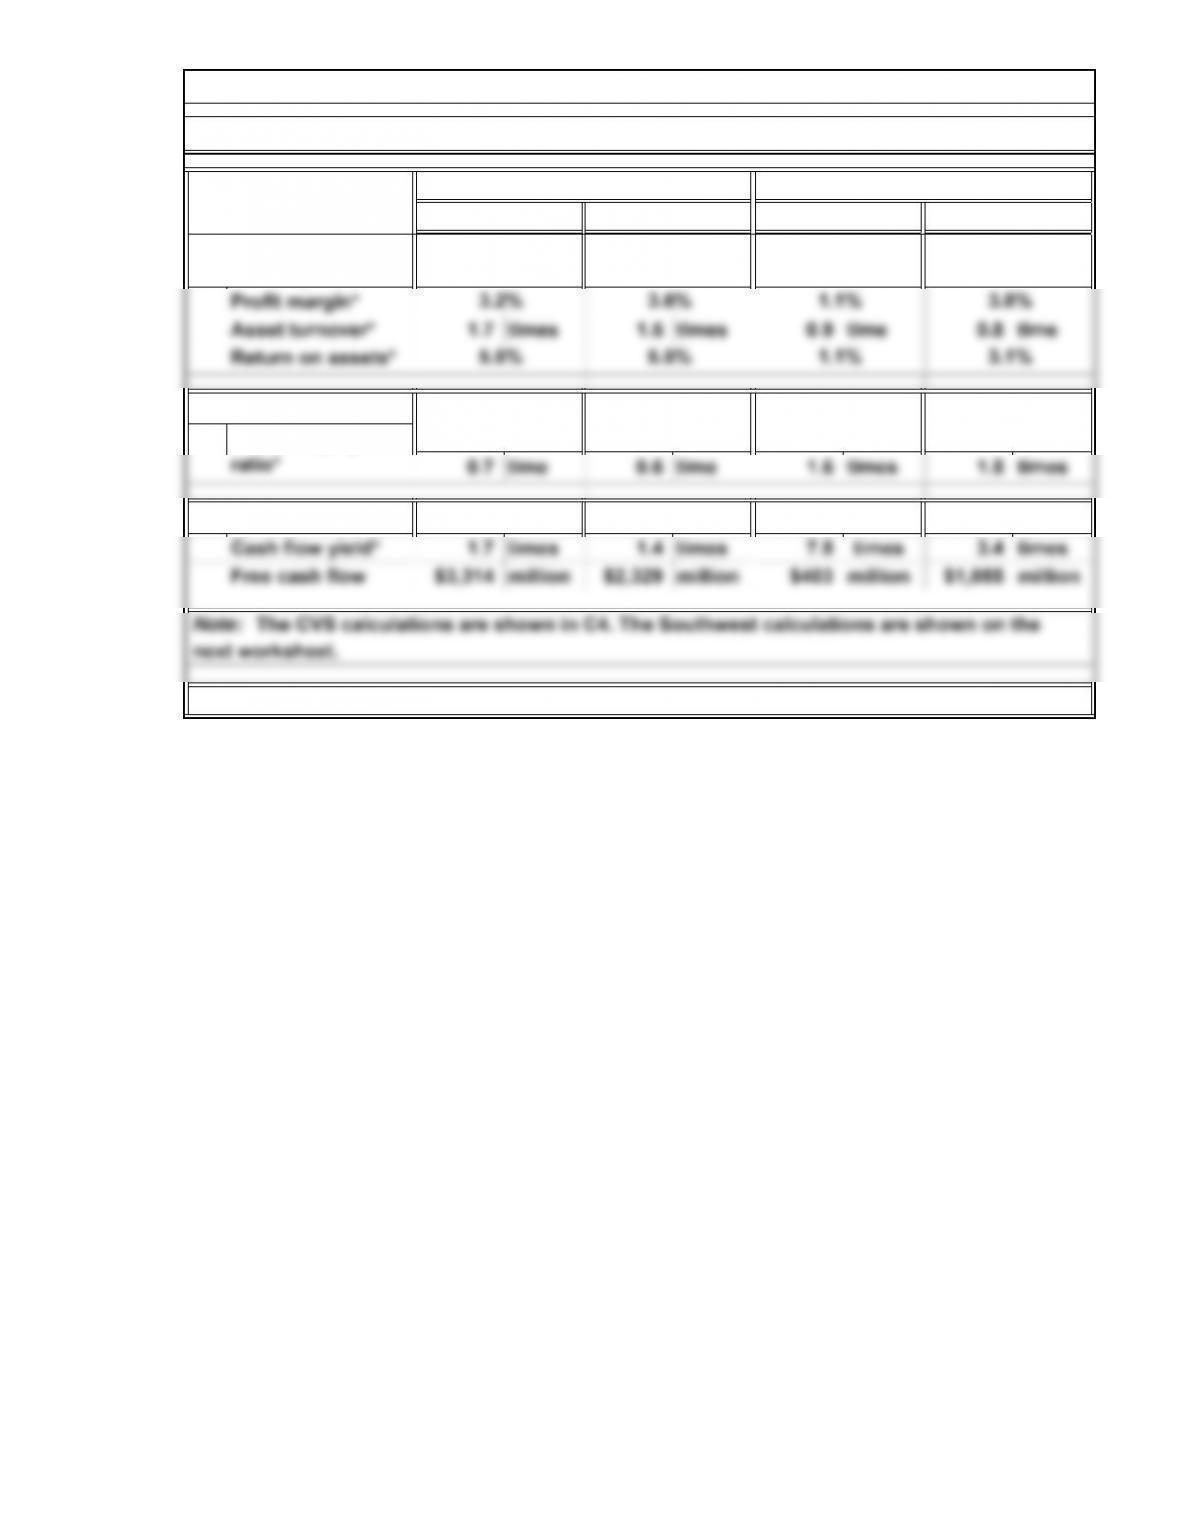
C5. Interpreting Financial Reports: Comparison of Key Financial Performance Measures
2011 2010 2011
CVS and Southwest compared across key financial performance measures
CVS
2010
Southwest
Financial risk:
Debt to equity
*Rounded
16-67
© 2014 Cengage Learning. All Rights Reserved. May not be scanned, copied, duplicated, or posted to a publicly accessible website, in whole or in part.
C5. Interpreting Financial Reports: Comparison of Key Financial Performance Measures
(Concluded)
*Rounded
2010
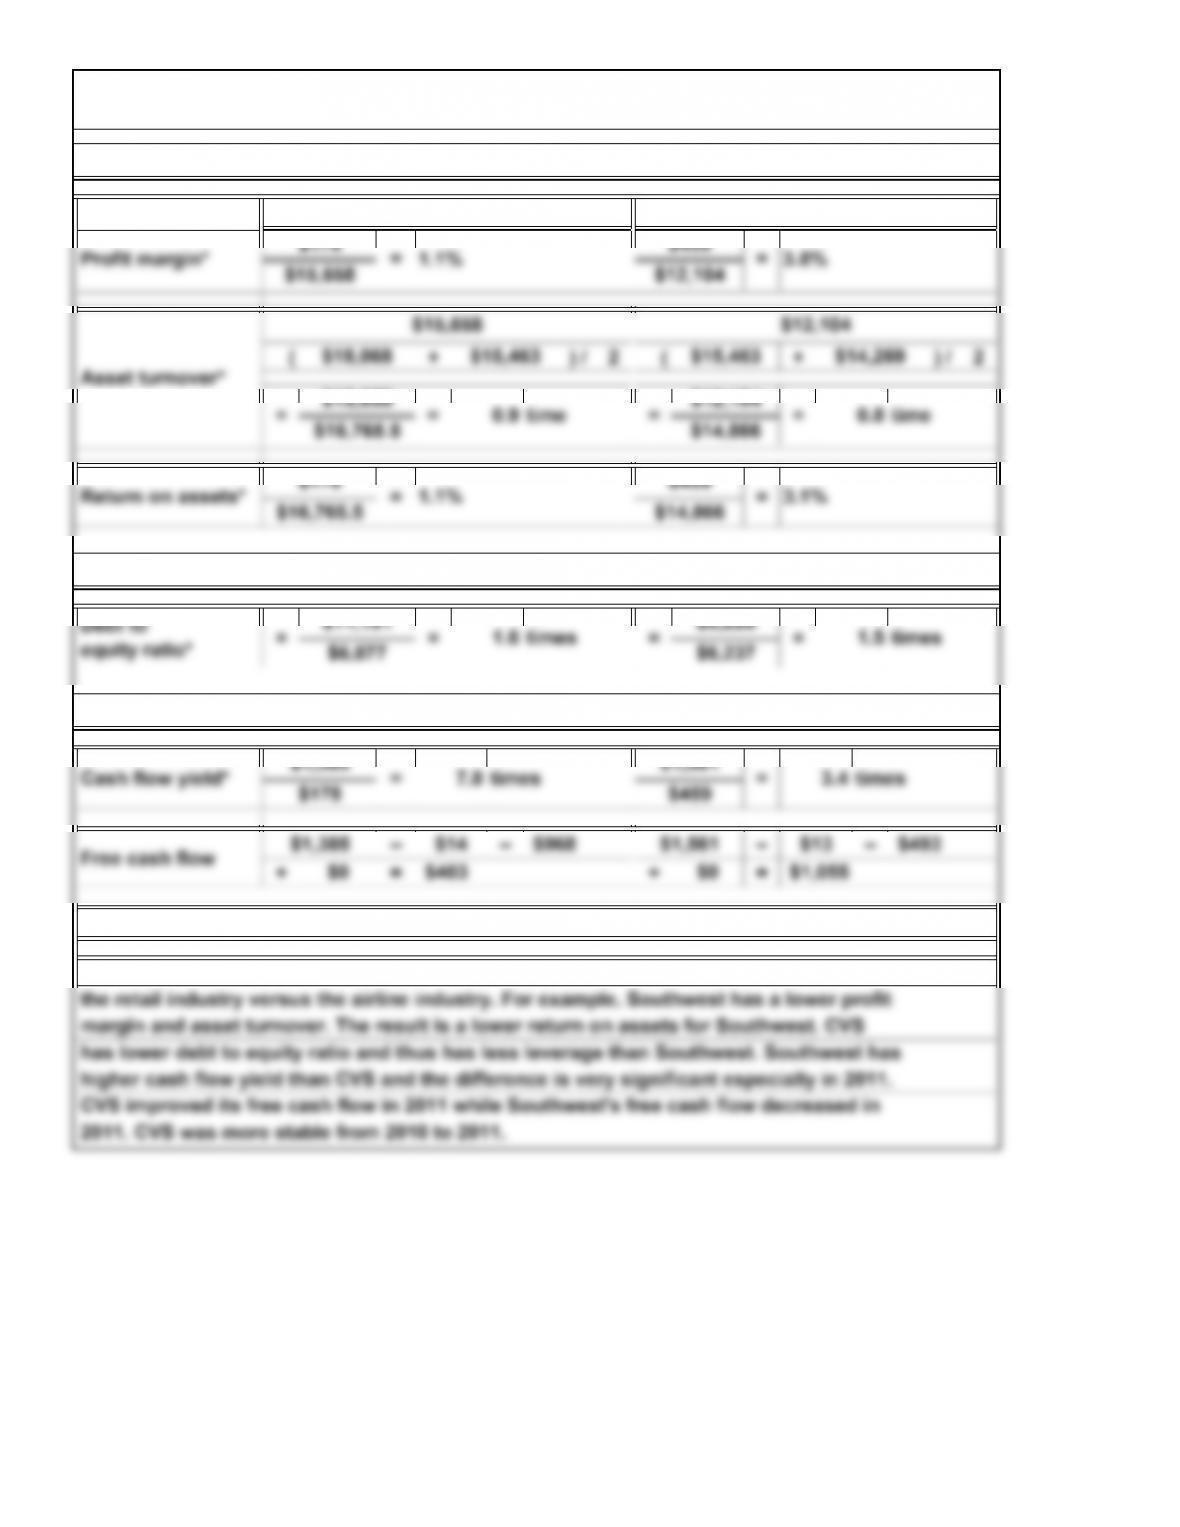
Profitability and total asset management ratios of Southwest (in millions)
2011
$16,765.5 $14,866
=
Financial risk ratio of Southwest (in millions)
Debt to
1.6 times $9,226$11,191 ==
CVS improved its free cash flow in 2011 while Southwest’s free cash flow decreased in
The analysis of CVS and Southwest shows some of the differences and similarities of
margin and asset turnover. The result is a lower return on assets for Southwest. CVS
has lower debt to equity ratio and thus has less leverage than Southwest. Southwest has
higher cash flow yield than CVS and the difference is very significant especially in 2011.
the retail industry versus the airline industry. For example, Southwest has a lower profit
16-68
© 2014 Cengage Learning. All Rights Reserved. May not be scanned, copied, duplicated, or posted to a publicly accessible website, in whole or in part.
Note to Instructor: Answers will vary depending on the company selected by the students.
C7. Continuing Case: Annual Report Project
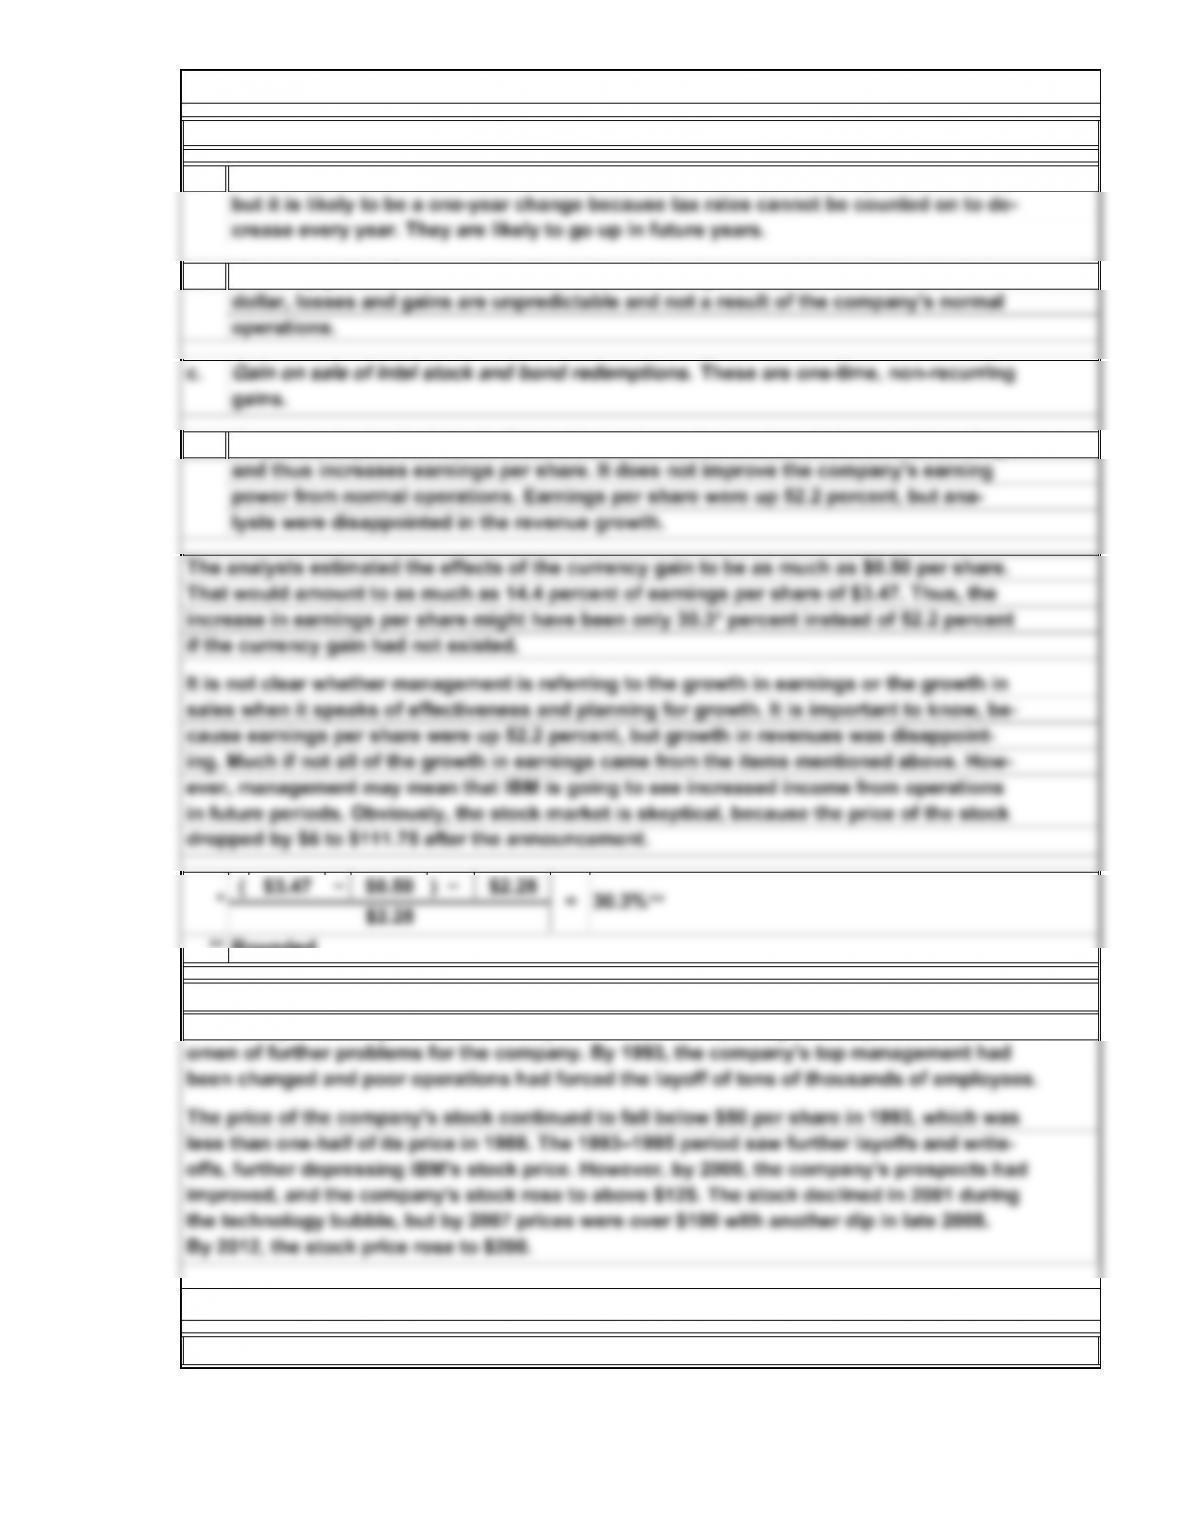
By 2012, the stock price rose to $200.
less than one-half of its price in 1988. The 1993–1995 period saw further layoffs and write-
offs, further depressing IBM’s stock price. However, by 2000, the company’s prospects had
improved, and the company’s stock rose to above $125. The stock declined in 2001 during
the technology bubble, but by 2007 prices were over $100 with another dip in late 2008.
Income tax rates decreased. A decrease in the effective tax rate is a positive benefit,
Rounded
Optional question:
The quality of earnings issues raised by IBM’s financial reporting in 1988 proved to be an
C6. Conceptual Understanding: Classic Quality of Earnings Case
Four quality of earnings issues identified in the article are:
a.
**
b. Currency gains. Because of the fluctuation of foreign currencies in relation to the
d. Corporate buyback of stock. This action reduces the number of shares outstanding
sales when it speaks of effectiveness and planning for growth. It is important to know, be-
That would amount to as much as 14.4 percent of earnings per share of $3.47. Thus, the
= 30.3%
$2.28
increase in earnings per share might have been only 30.3* percent instead of 52.2 percent
if the currency gain had not existed.
cause earnings per share were up 52.2 percent, but growth in revenues was disappoint-
ing. Much if not all of the growth in earnings came from the items mentioned above. How-
It is not clear whether management is referring to the growth in earnings or the growth in
ever, management may mean that IBM is going to see increased income from operations
The price of the company’s stock continued to fall below $50 per share in 1993, which was
in future periods. Obviously, the stock market is skeptical, because the price of the stock
dropped by $6 to $111.75 after the announcement.
***
16-69
© 2014 Cengage Learning. All Rights Reserved. May not be scanned, copied, duplicated, or posted to a publicly accessible website, in whole or in part.