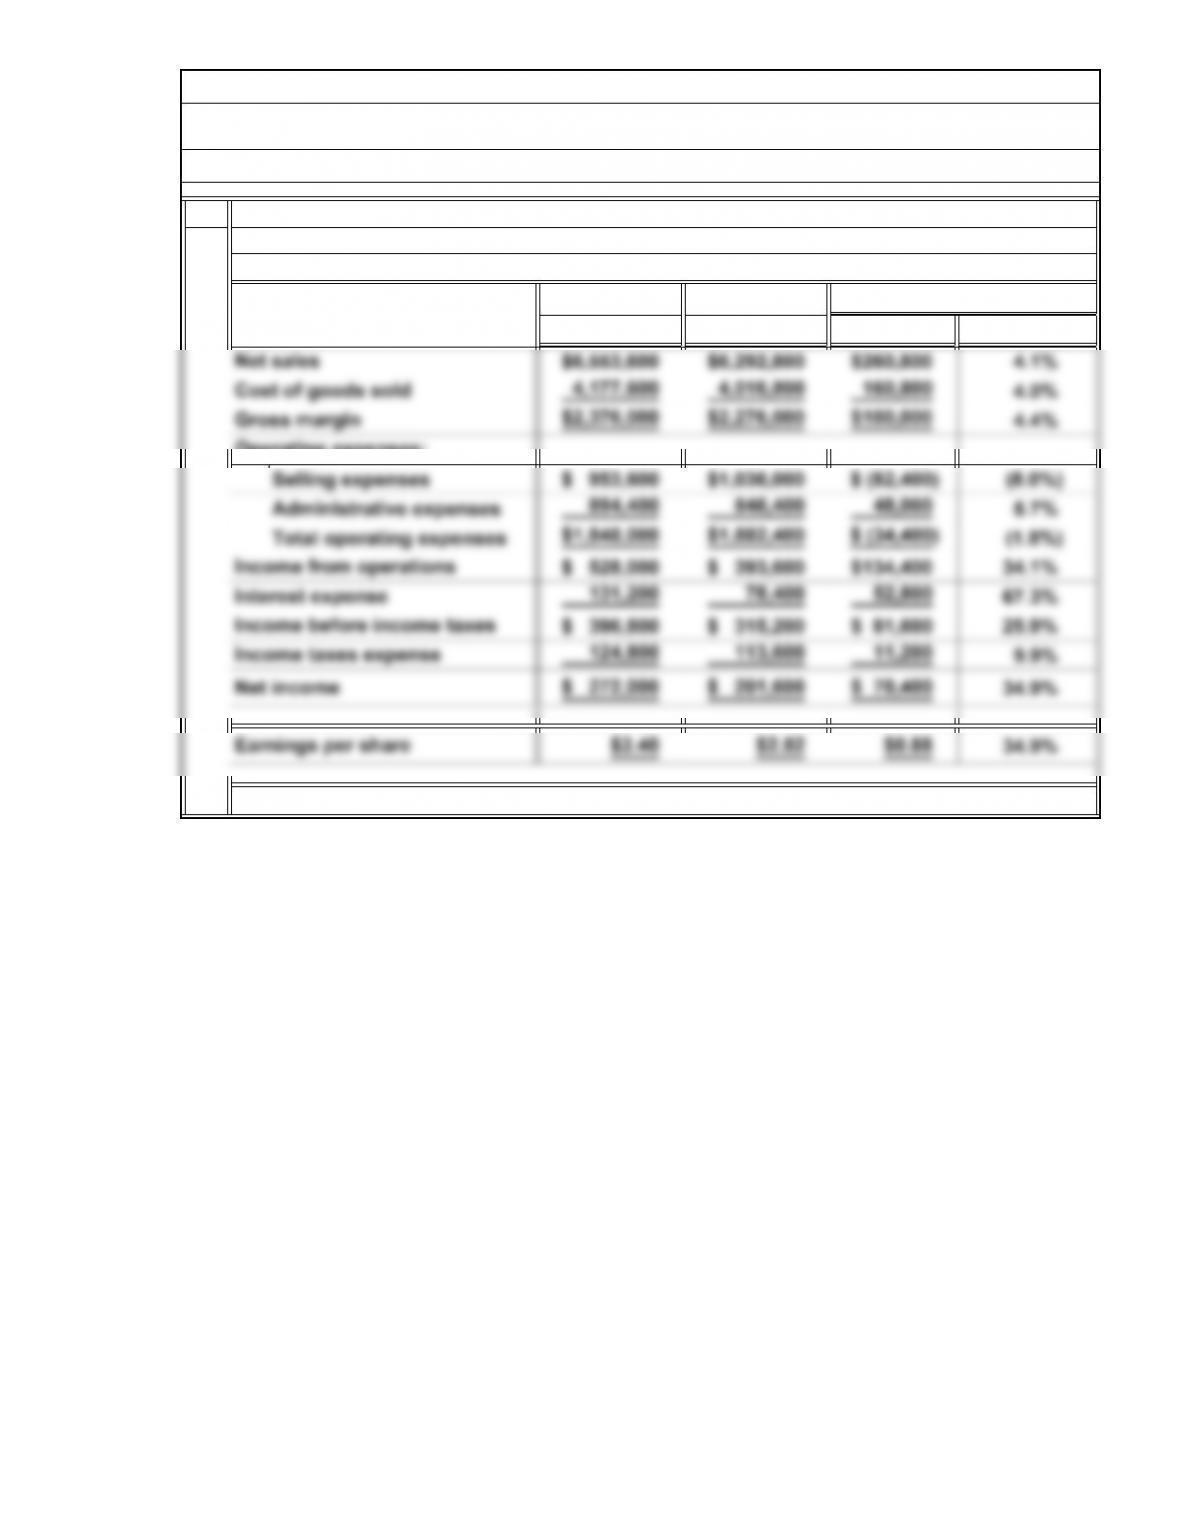
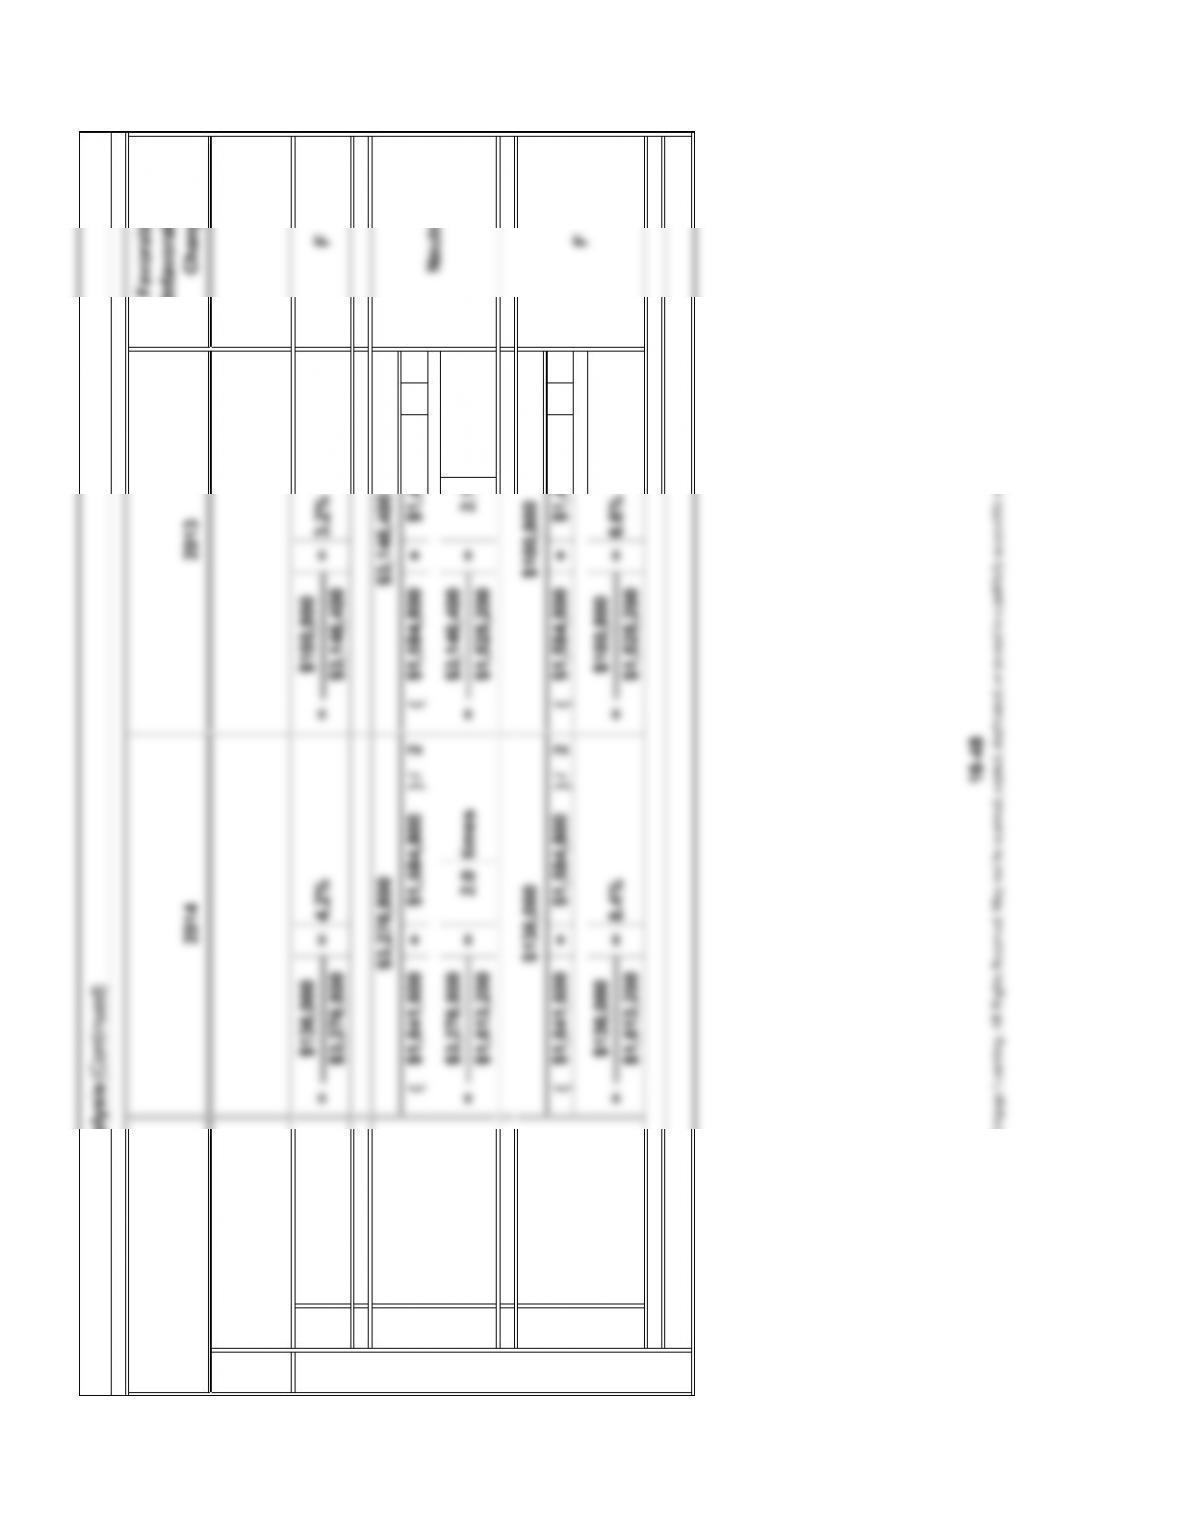
1.
2014 2013 Amount Percentage*
Alternate Problems
P7. Horizontal and Vertical Analysis
Comparative Income Statements
For the Years Ended December 31, 2014 and 2013
Increase or Decrease
Rylander Corporation
*Rounded
16-41
© 2014 Cengage Learning. All Rights Reserved. May not be scanned, copied, duplicated, or posted to a publicly accessible website, in whole or in part.
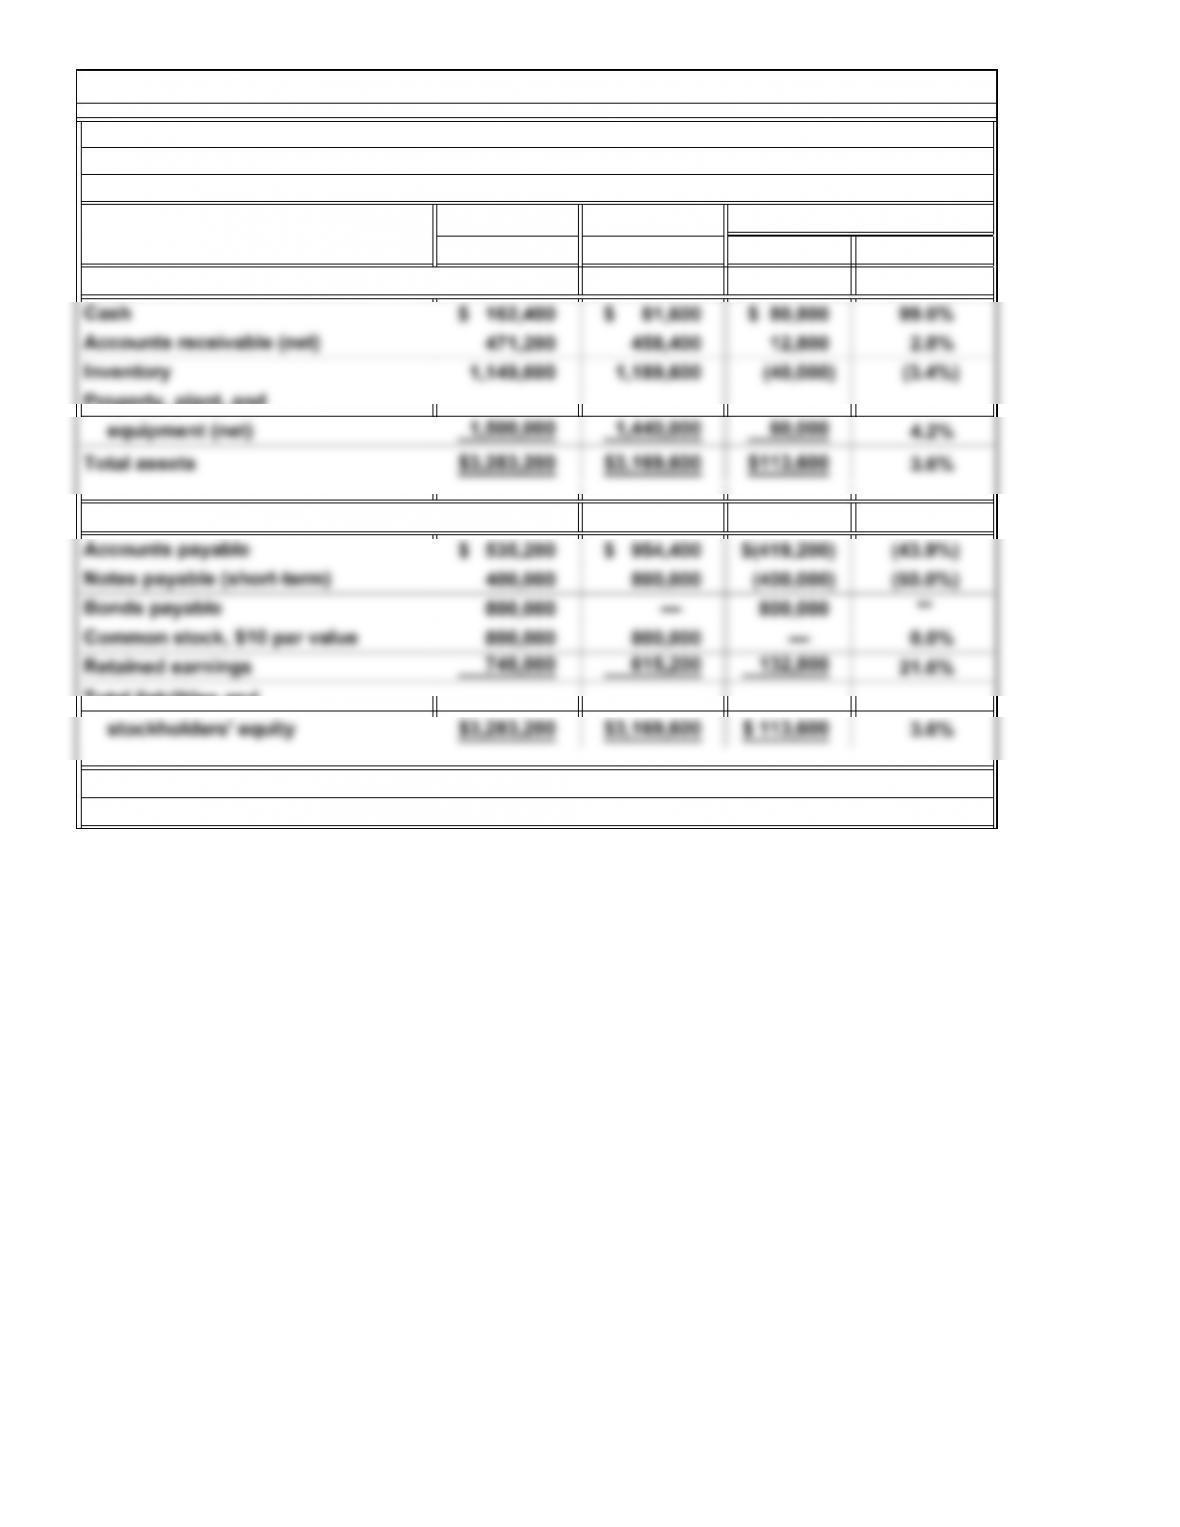
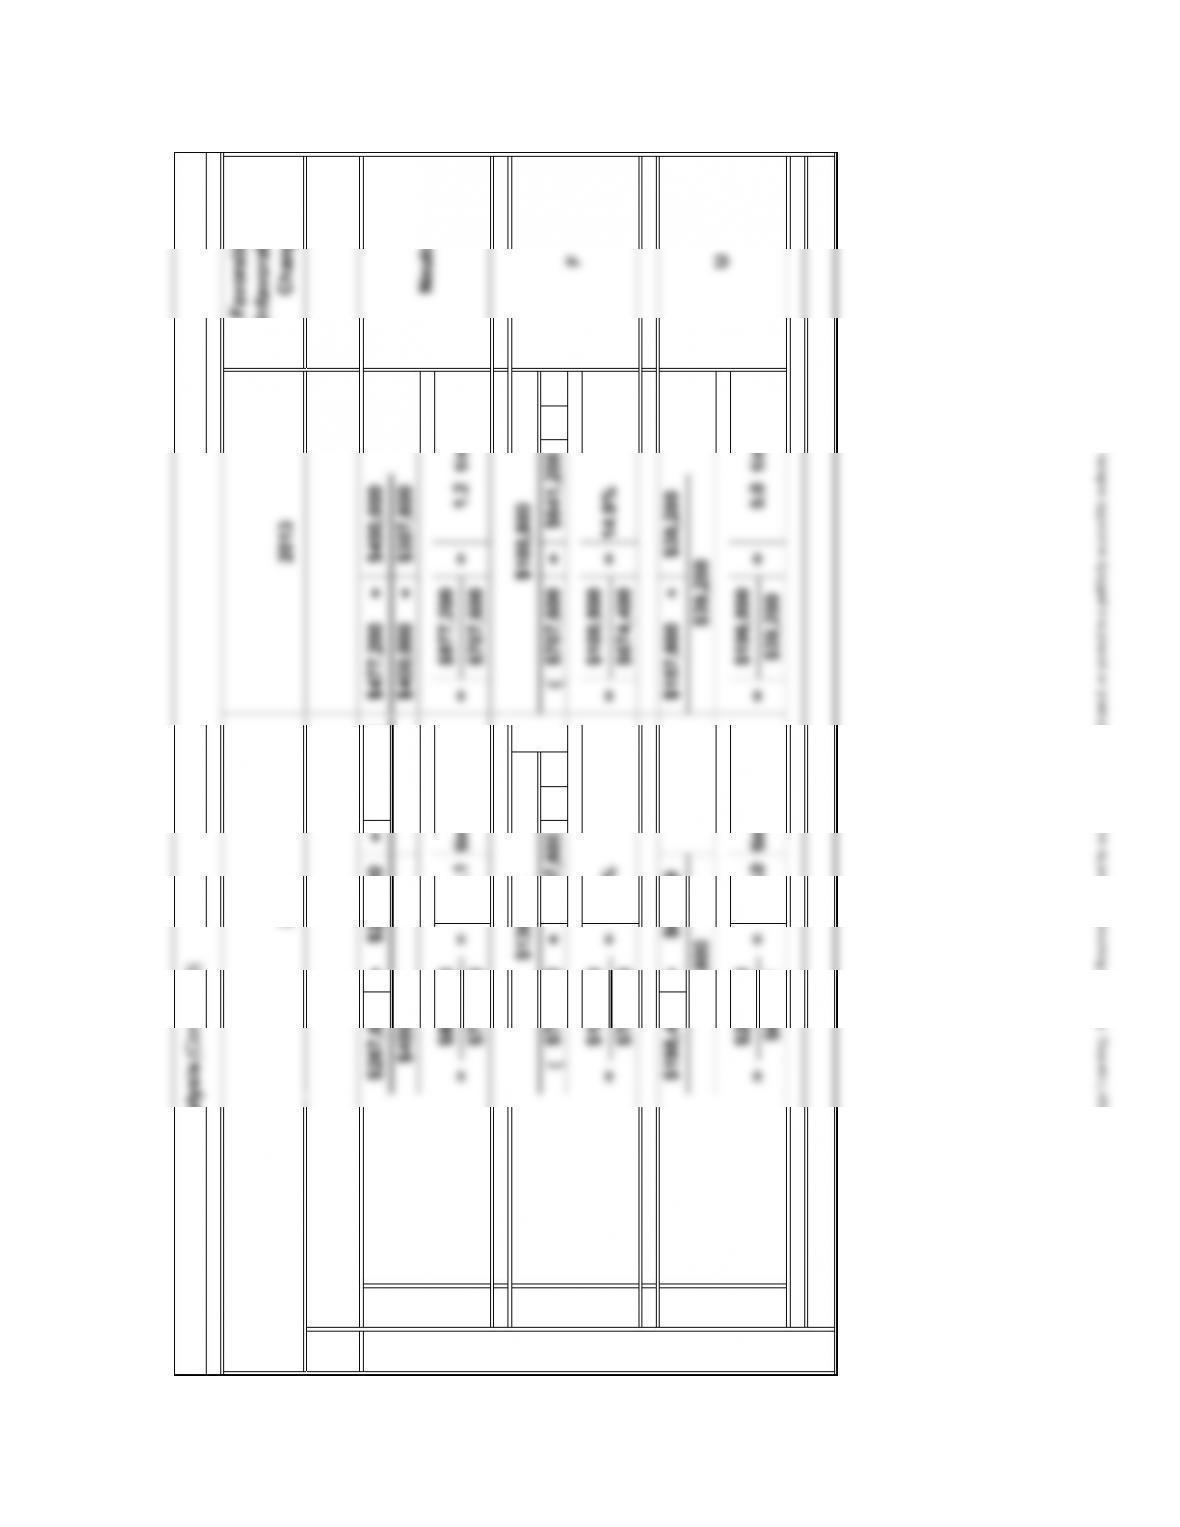
2014 2013 Amount Percentage*
P7. Horizontal and Vertical Analysis (Continued)
Increase or Decrease
Rylander Corporation
Comparative Balance Sheets
December 31, 2014 and 2013
**Not divisible
*Rounded
Assets
16-42
© 2014 Cengage Learning. All Rights Reserved. May not be scanned, copied, duplicated, or posted to a publicly accessible website, in whole or in part.
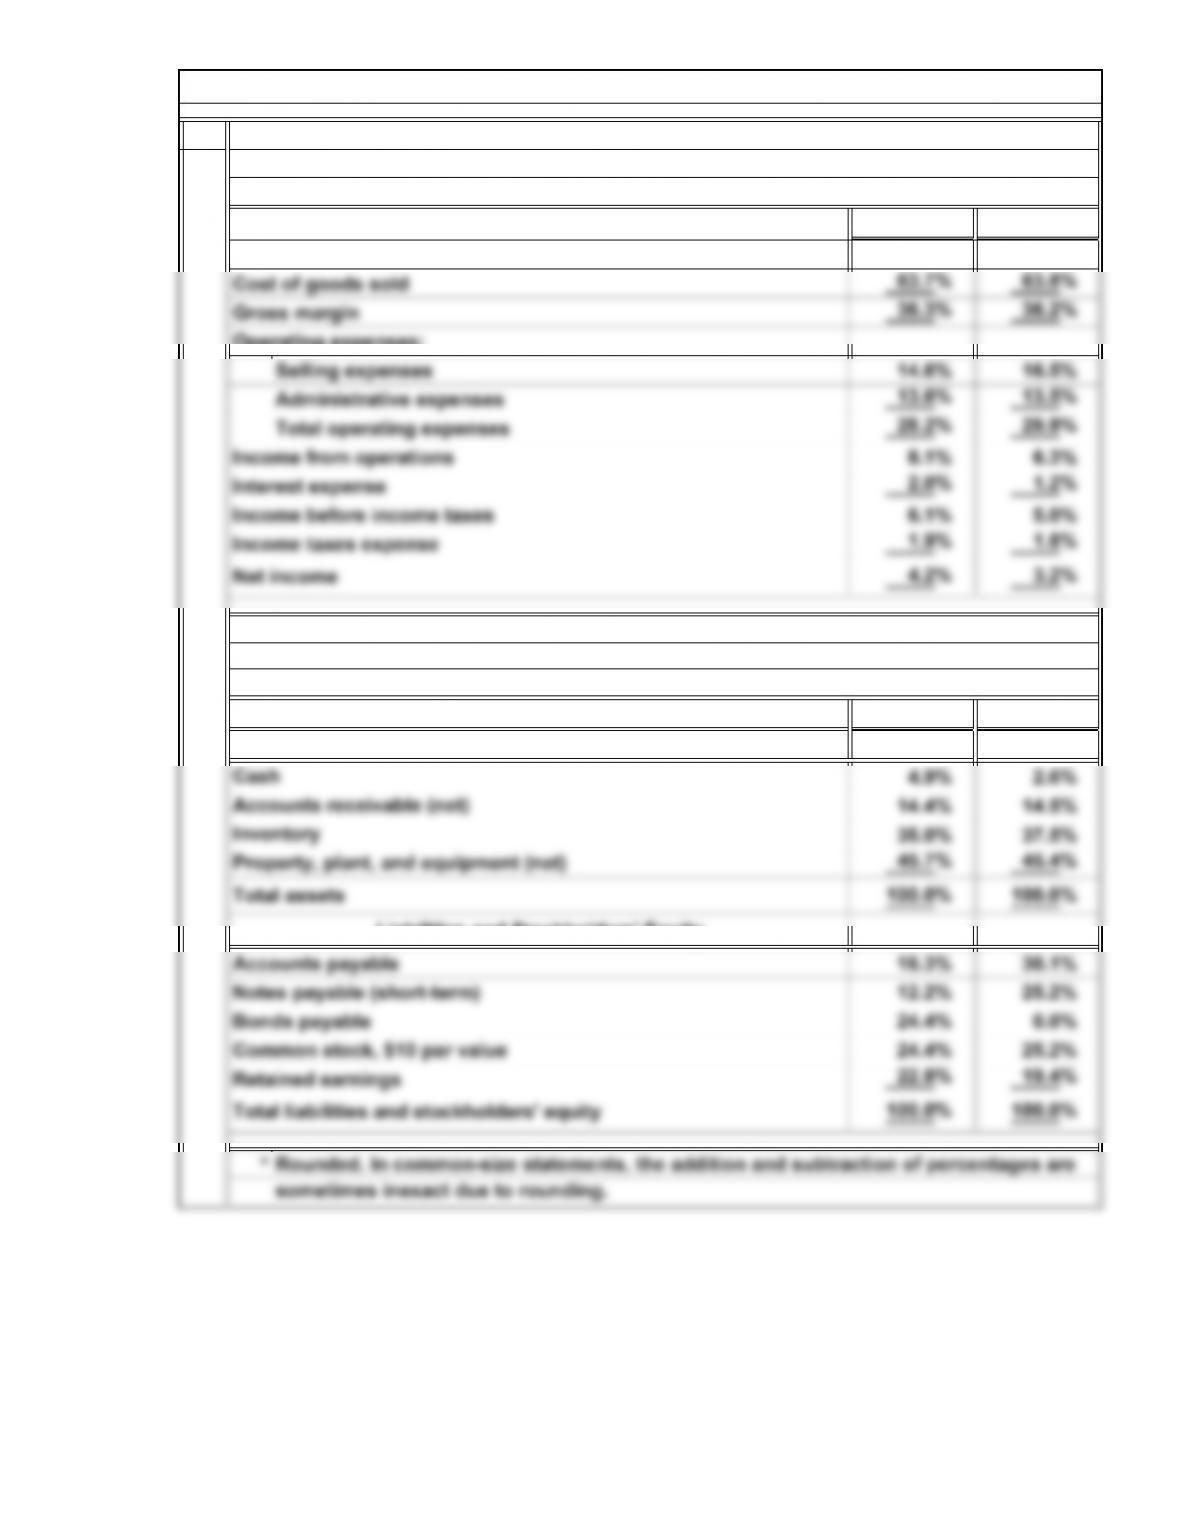
2.
2014* 2013*
Net sales 100.0% 100.0%
Operating expenses:
2014* 2013*
Common-Size Balance Sheets
December 31, 2014 and 2013
P7. Horizontal and Vertical Analysis (Continued)
Rylander Corporation
Common-Size Income Statements
For the Years Ended December 31, 2014 and 2013
Assets
Rylander Corporation
16-43
© 2014 Cengage Learning. All Rights Reserved. May not be scanned, copied, duplicated, or posted to a publicly accessible website, in whole or in part.
3.
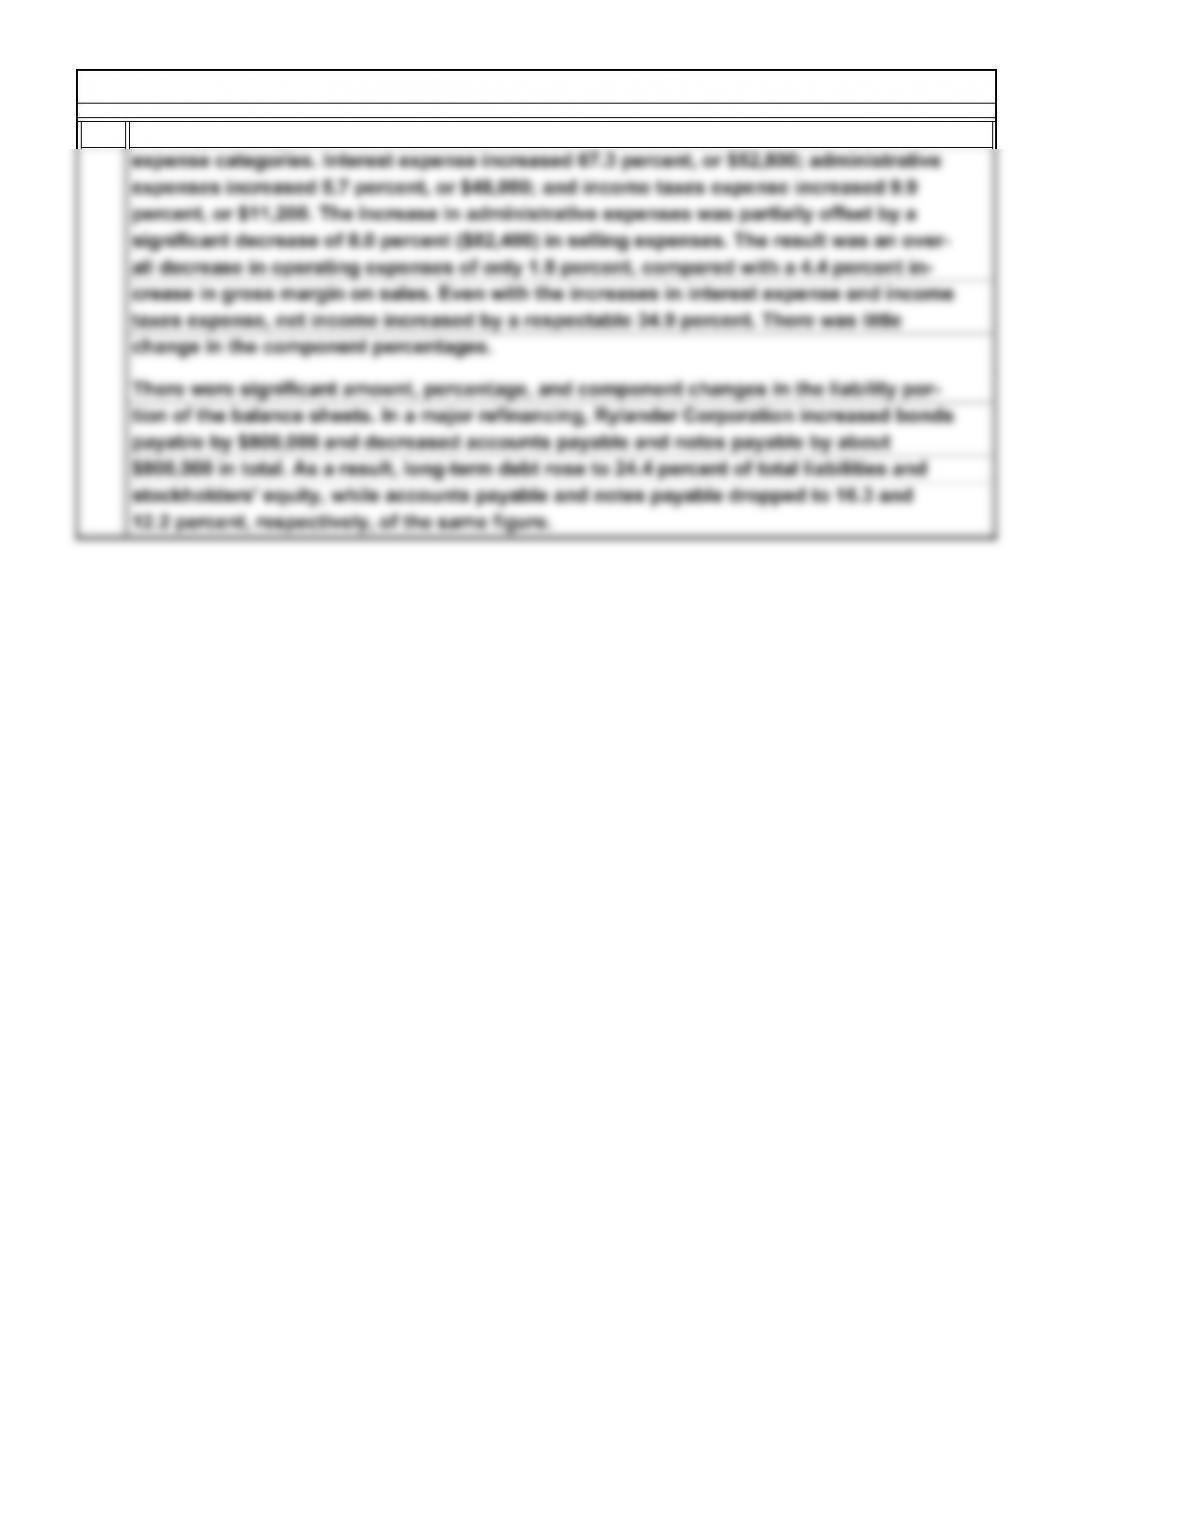
$800,000 in total. As a result, long-term debt rose to 24.4 percent of total liabilities and
stockholders’ equity, while accounts payable and notes payable dropped to 16.3 and
12.2 percent, respectively, of the same figure.
crease in gross margin on sales. Even with the increases in interest expense and income
taxes expense, net income increased by a respectable 34.9 percent. There was little
change in the component percentages.
tion of the balance sheets. In a major refinancing, Rylander Corporation increased bonds
payable by $800,000 and decreased accounts payable and notes payable by about
significant decrease of 8.0 percent ($82,400) in selling expenses. The result was an over-
all decrease in operating expenses of only 1.8 percent, compared with a 4.4 percent in-
There were significant amount, percentage, and component changes in the liability por-
The major changes in the income statements of Rylander Corporation occurred in the
P7. Horizontal and Vertical Analysis (Concluded)
16-44
© 2014 Cengage Learning. All Rights Reserved. May not be scanned, copied, duplicated, or posted to a publicly accessible website, in whole or in part.
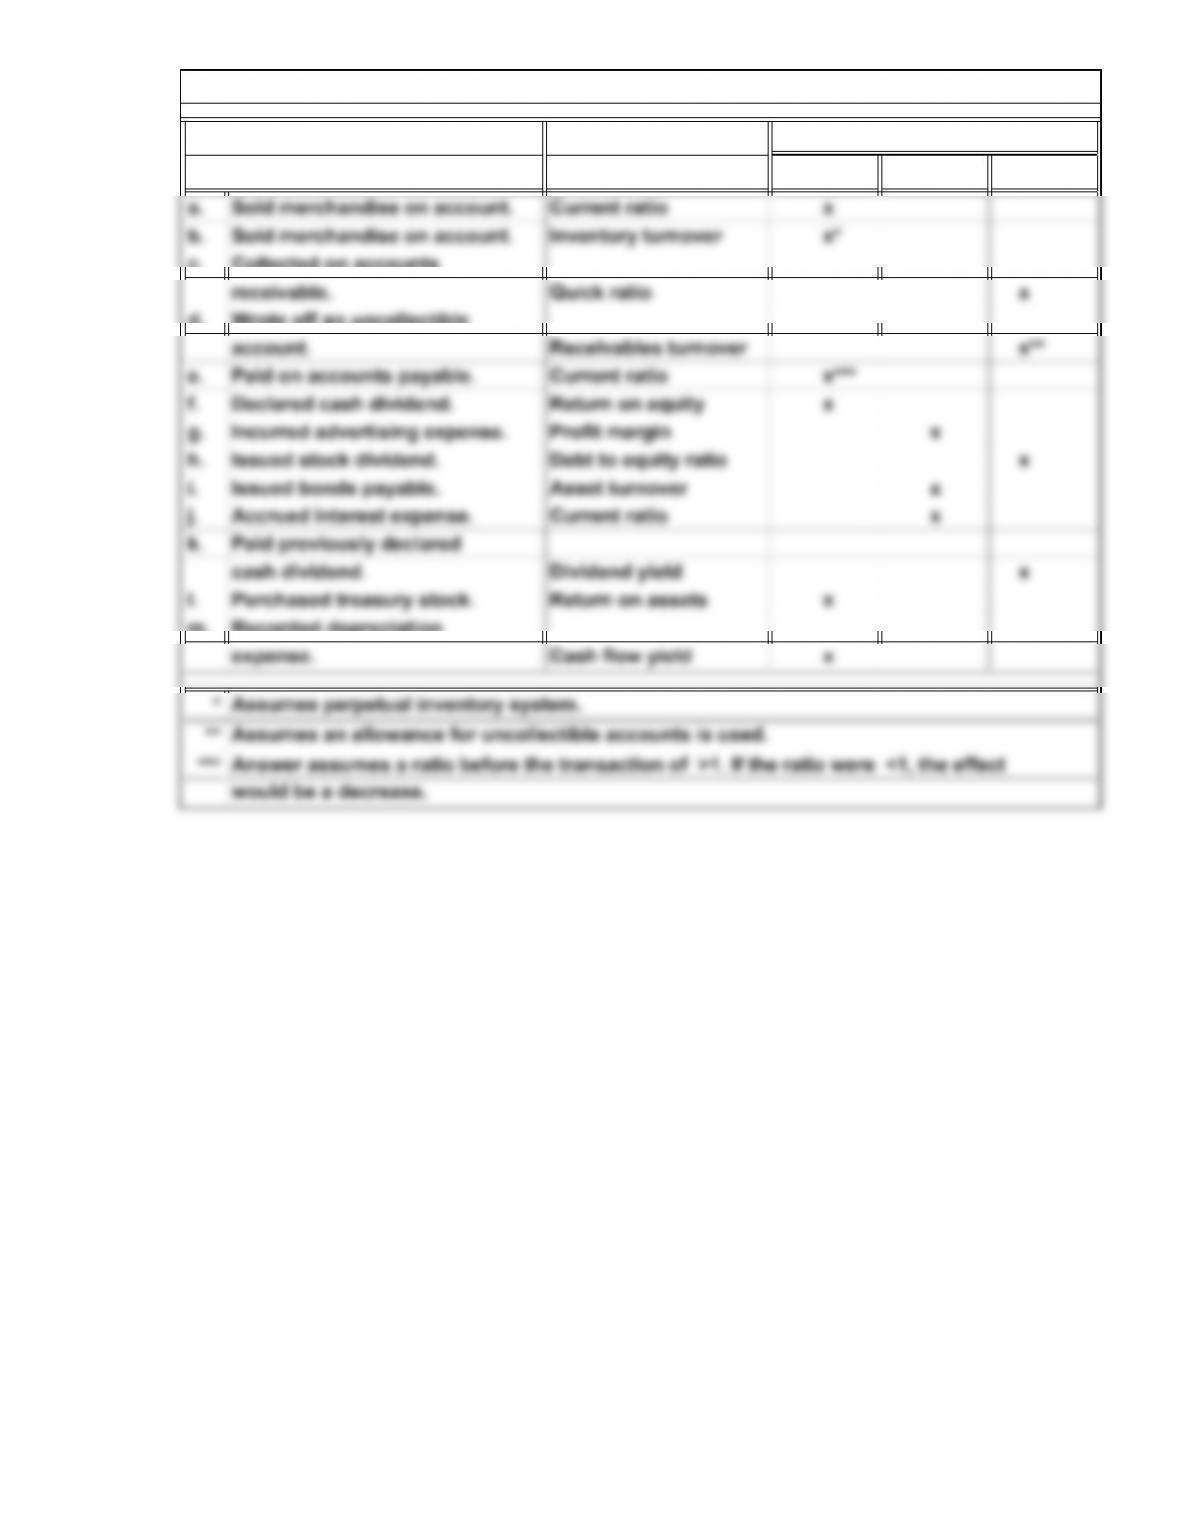
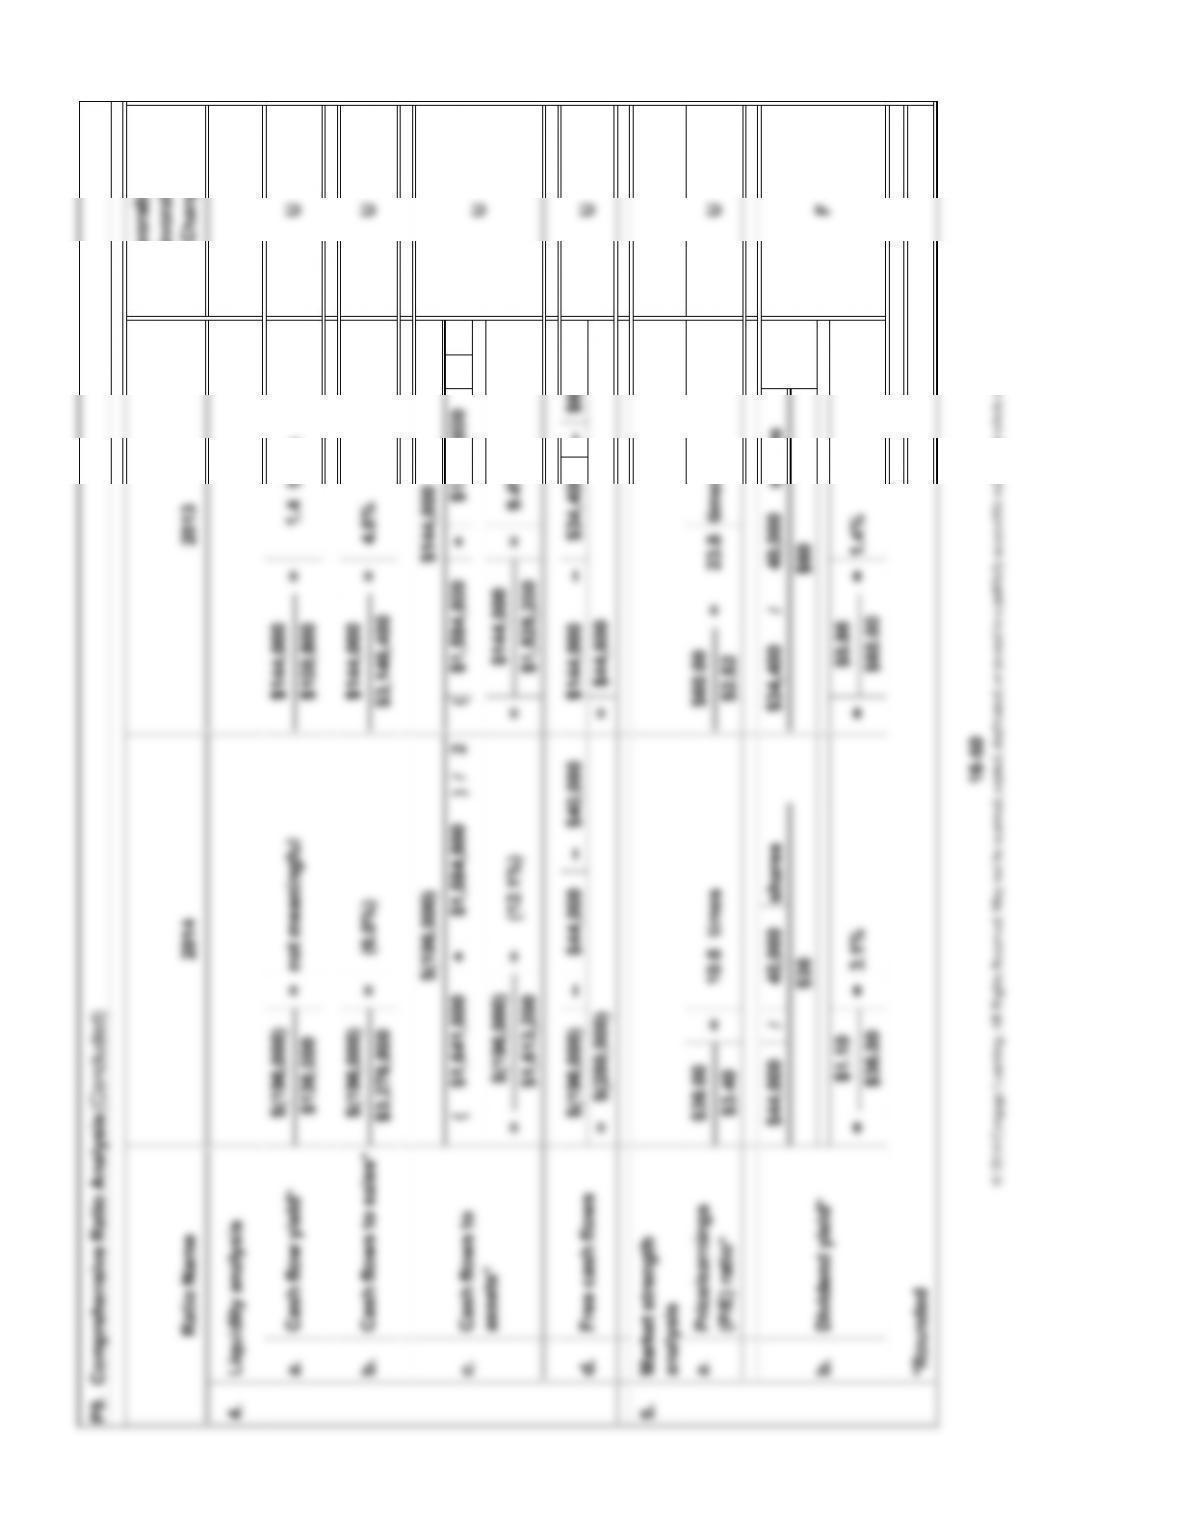
Ratio Increase Decrease None
c. Collected on accounts
d. Wrote off an uncollectible
k. Paid previously declared
m. Recorded depreciation
*
**
P8. Effects of Transactions on Ratios
Effect
would be a decrease.
Assumes an allowance for uncollectible accounts is used.
Assumes perpetual inventory system.
Transaction
16-45
© 2014 Cengage Learning. All Rights Reserved. May not be scanned, copied, duplicated, or posted to a publicly accessible website, in whole or in part.
F
U
time== $316,800
14.4
6. Favorable (F) or
Unfavorable (U)
Change20132014Ratio Name
F
*Rounded
i. Financing period
days
U
Payables turnover*
h. times
Days’ inventory
on hand*
$2,088,800 $20,000
104.3101.4
Days’ payable*
+
$386,600$267,600 $477,200
F
===
=F65.2 days
=
f.
=
$2,008,400
F
Neutral
6. Favorable (F) or
Unfavorable (U)
Change20132014
Ratio Name
timestimes
days
g.
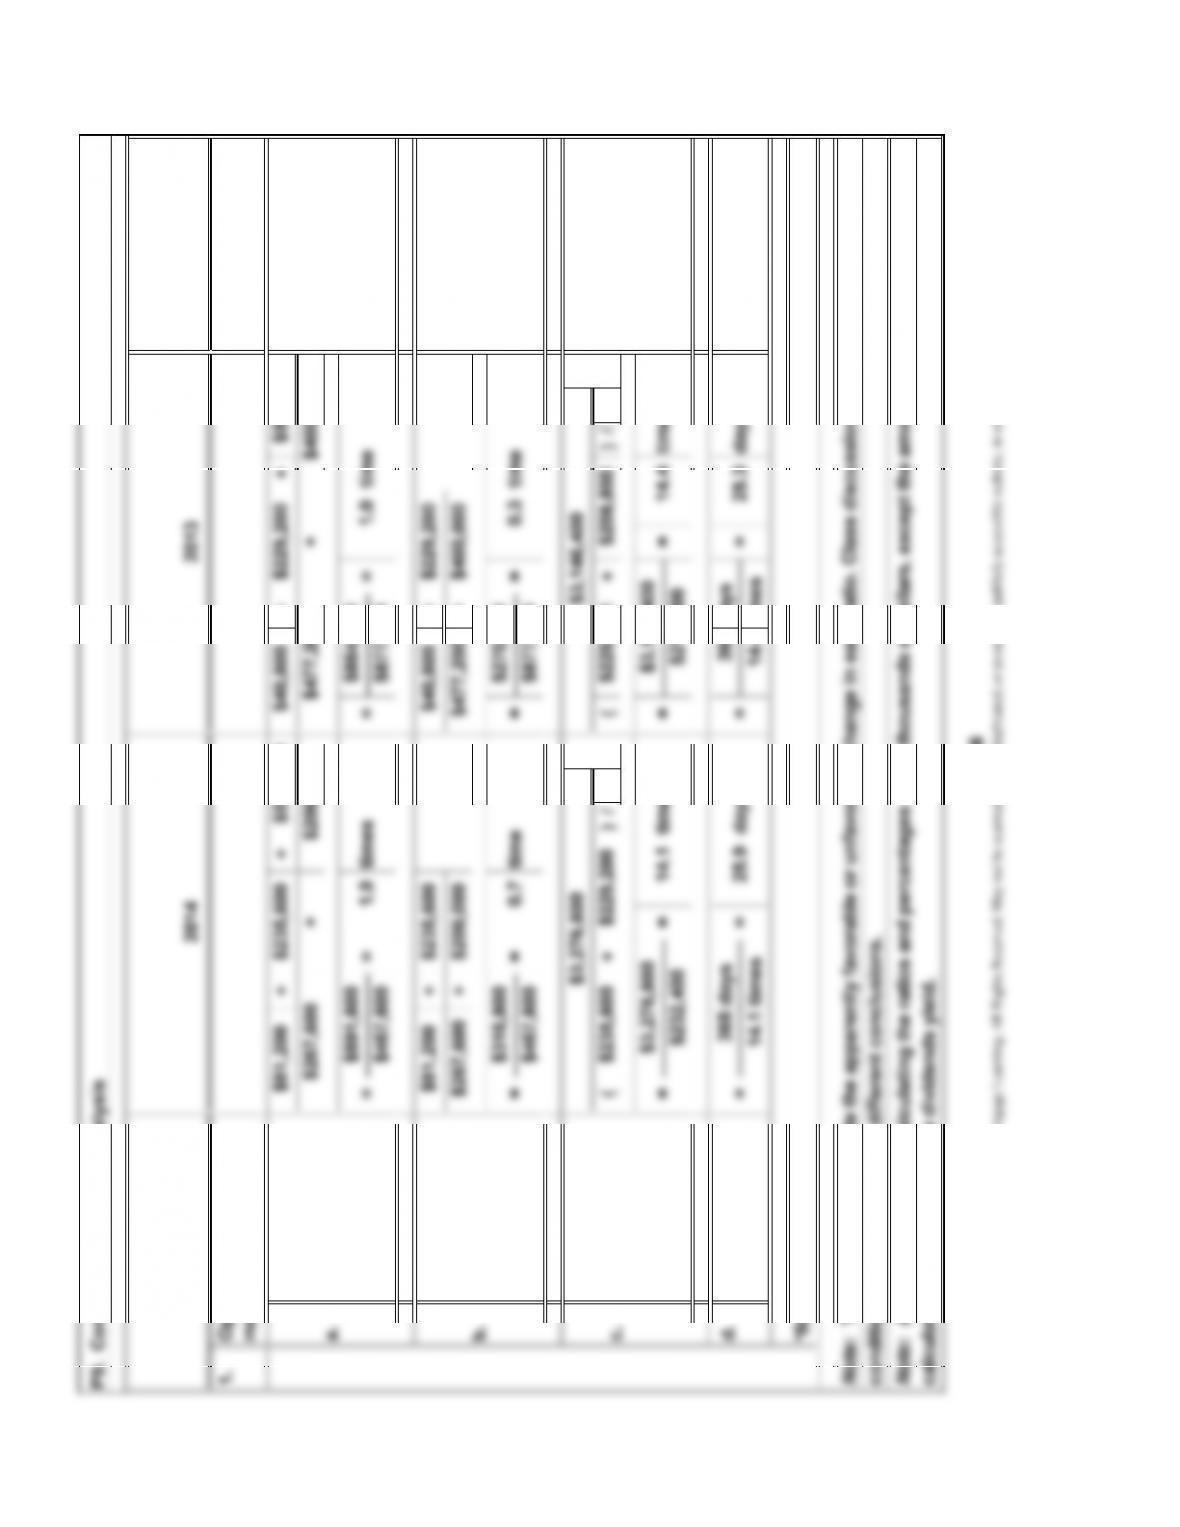
P9. Comprehensive Ratio Analysis (Continued)
times
e. Inventory turnover*
© 2014 Cengage Learning. All Rights Reserved. May not be scanned, copied, duplicated, or posted to a publicly accessible website, in whole or in part.
(+ ) /2(+ ) /2
(+ ) /2(+ ) /2
*Rounded
=Profit margin*
2.0 times
Return on assets*
=
a.
b.
4.2%
$100,800
P9. Comprehensive Ratio Analysis (Continued)
$3,146,400
Profitability and total
asset management
analysis
2.
=
$1,584,800
c.
$1,525,200
=
$136,000
8.4%
$1,584,800 $1,465,600
2014 2013
Asset turnover*
$1,584,800
$3,276,800
$1,525,200
Ratio Name
16-48
© 2014 Cengage Learning. All Rights Reserved. May not be scanned, copied, duplicated, or posted to a publicly accessible website, in whole or in part.
*Rounded
b. Return on equity*
a.
Debt to equity
ratio*
c.
Financial risk analysis
P9. Comprehensive Ratio Analysis (Continued)
3.
Interest coverage
ratio*
© 2014 Cengage Learning. All Rights Reserved. May not be scanned, copied, duplicated, or posted to a publicly accessible website, in whole or in part.