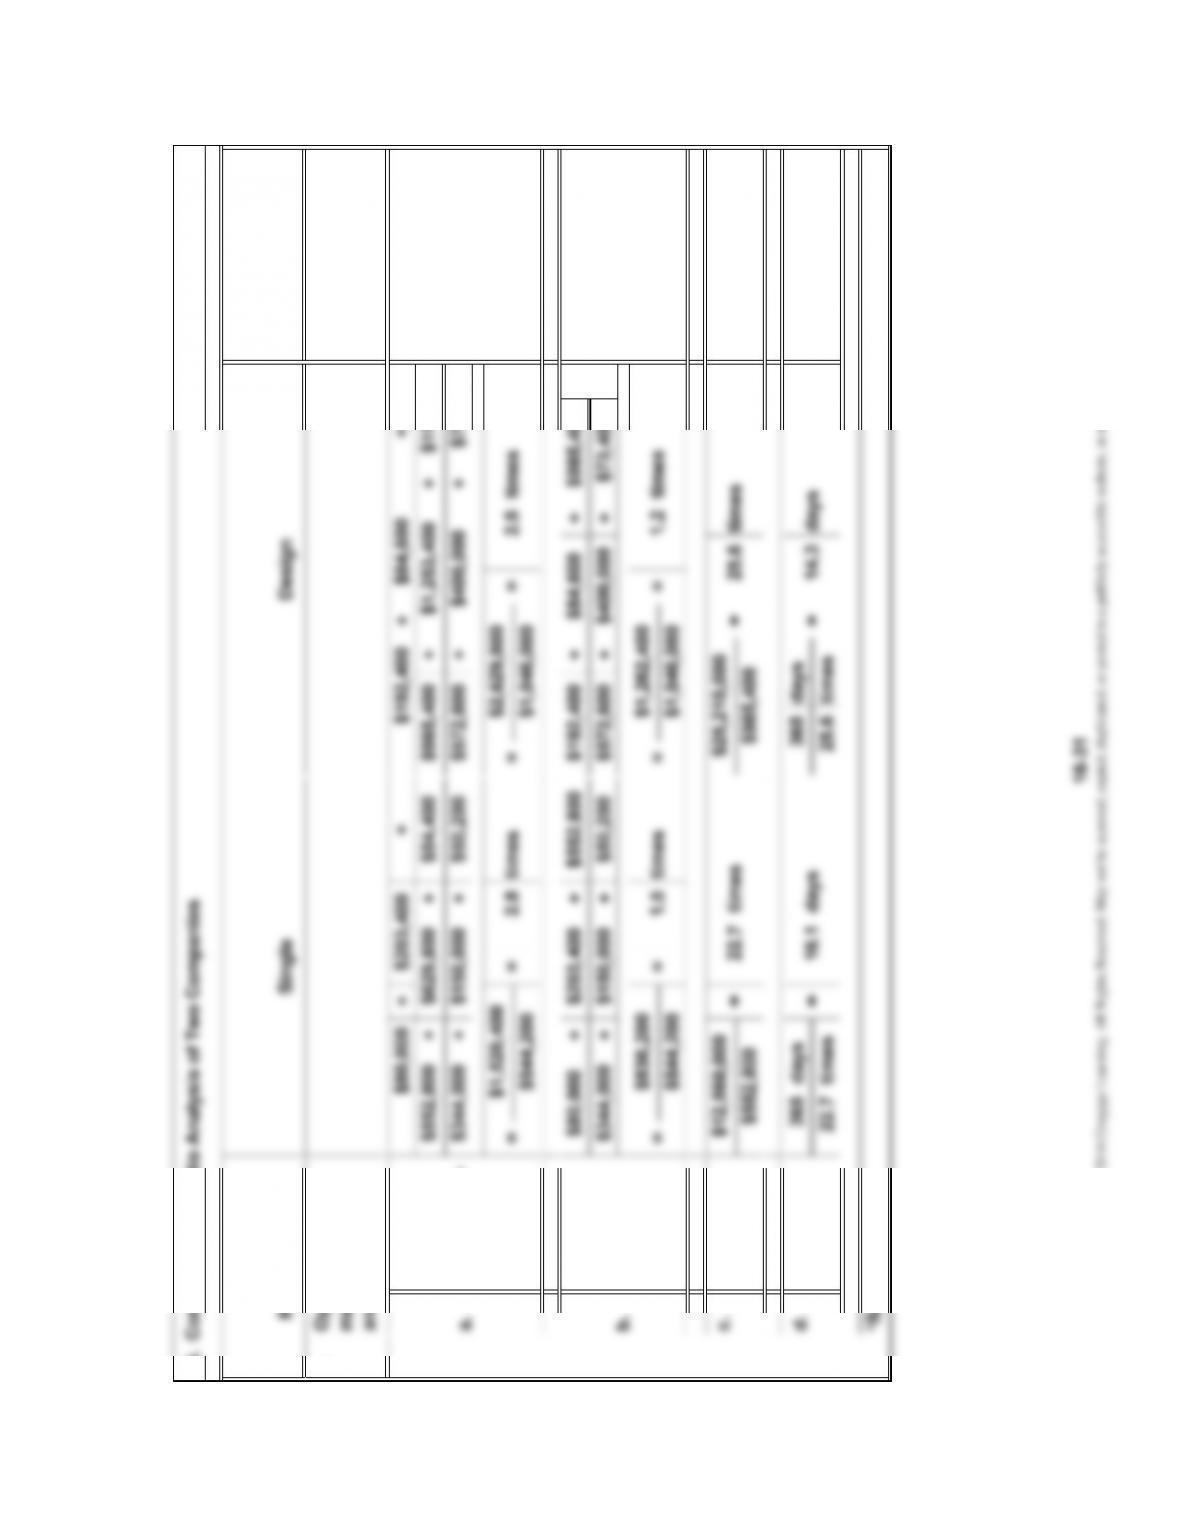
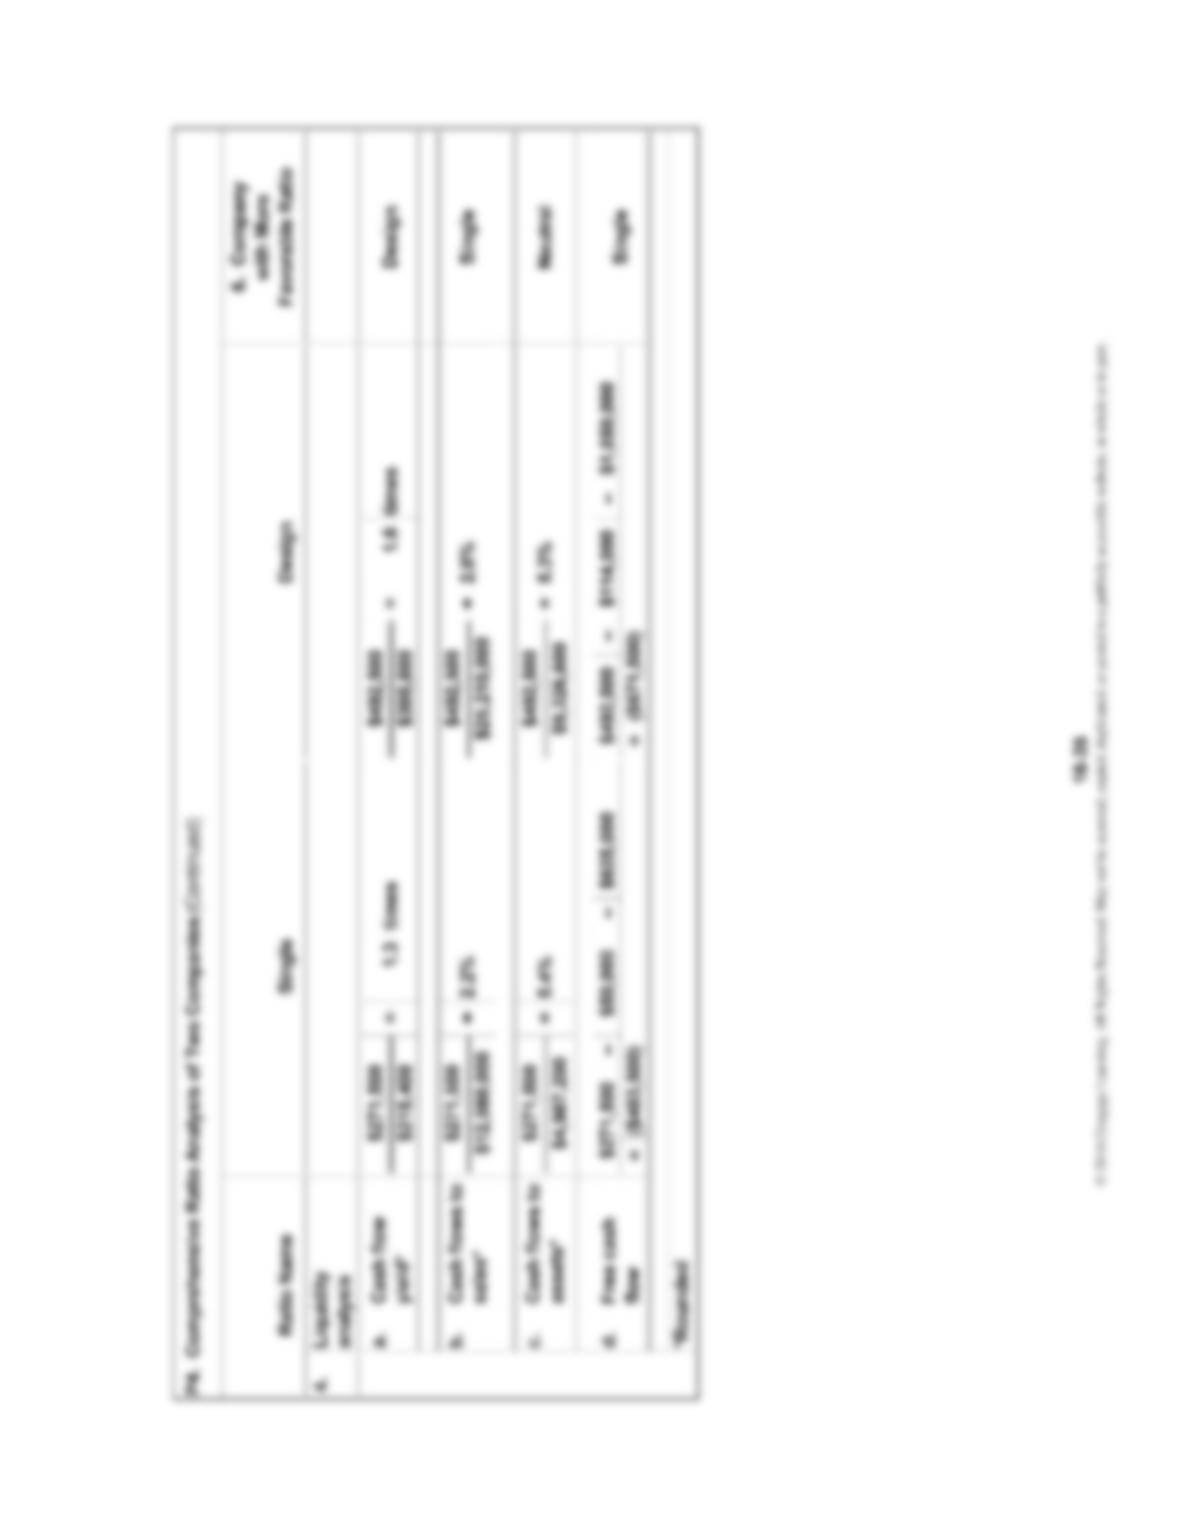
Quick ratio*
Days’ sales
uncollected*
Receivables
turnover*
Current ratio* $150,000
P4. Comprehensive Ratio Analysis of Two Companies
Ratio Name
1.
$192,400
6. Company
with More
Favorable Ratio
Single
Single
$80,000
22.7
+
© 2014 Cengage Learning. All Rights Reserved. May not be scanned, copied, duplicated, or posted to a publicly accessible website, in whole or in part.
timestimes
times
=
6. Company
with More
Favorable Ratio
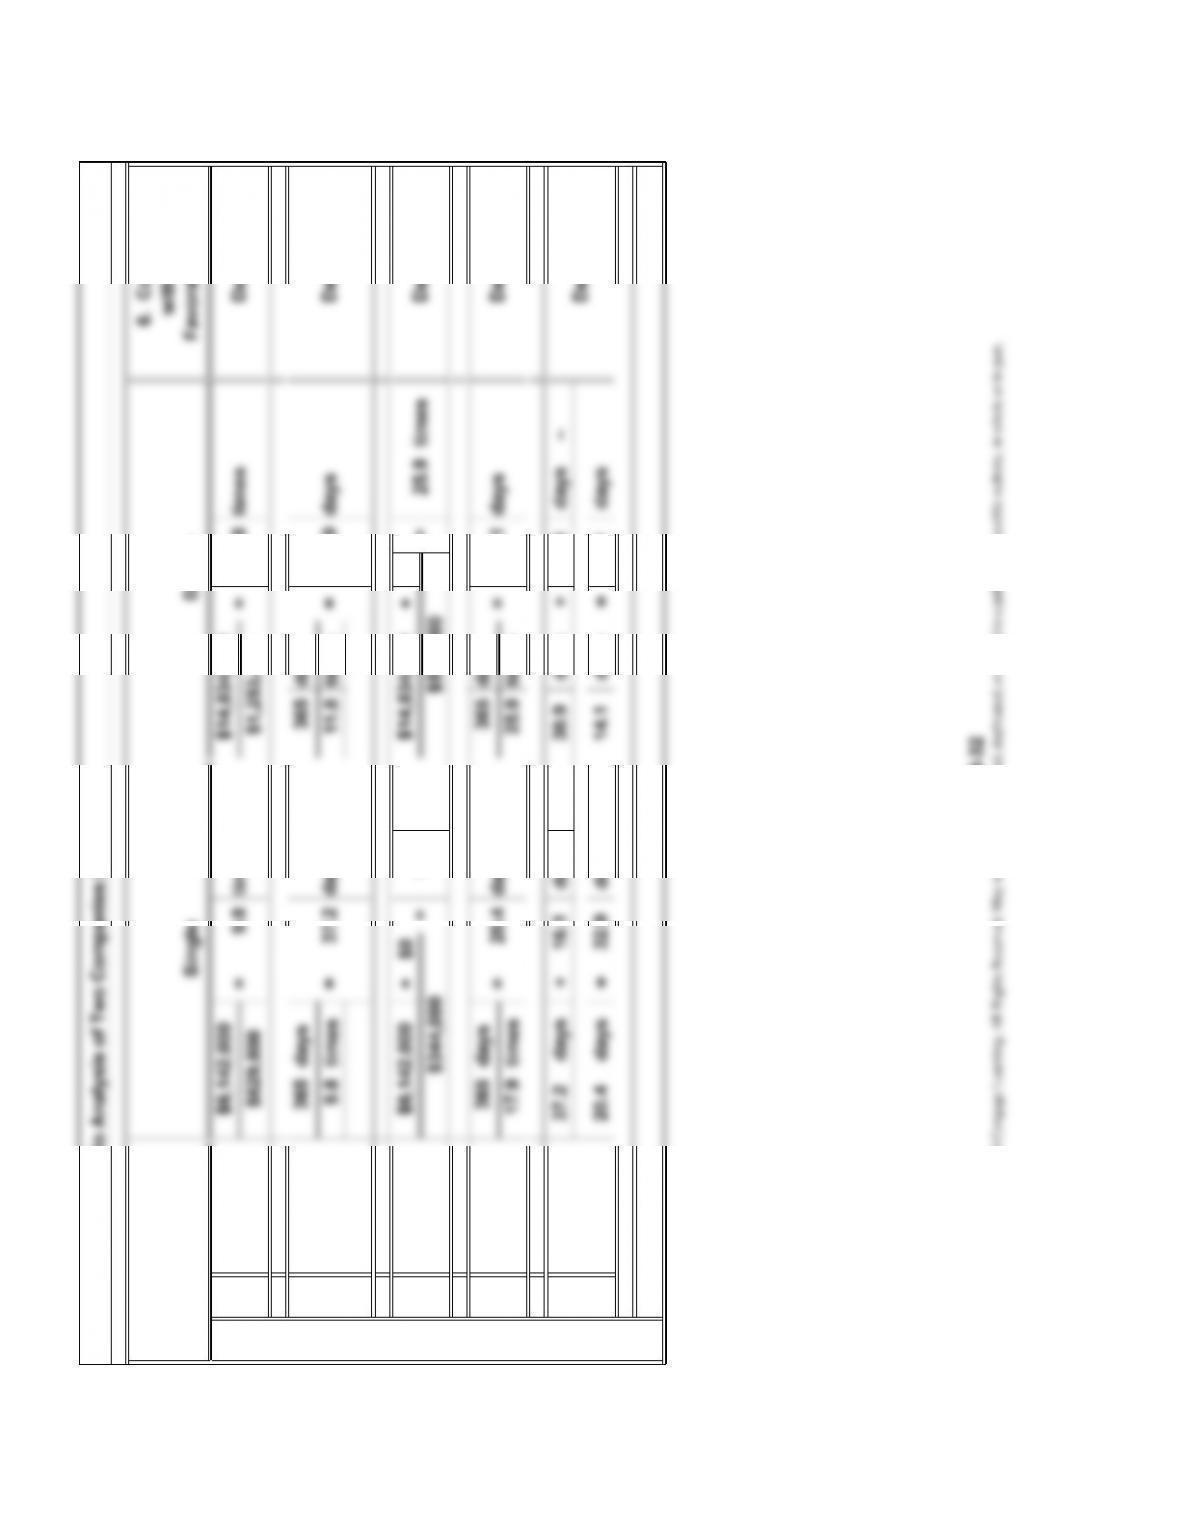
Inventory
turnover* =
e.
times
f.
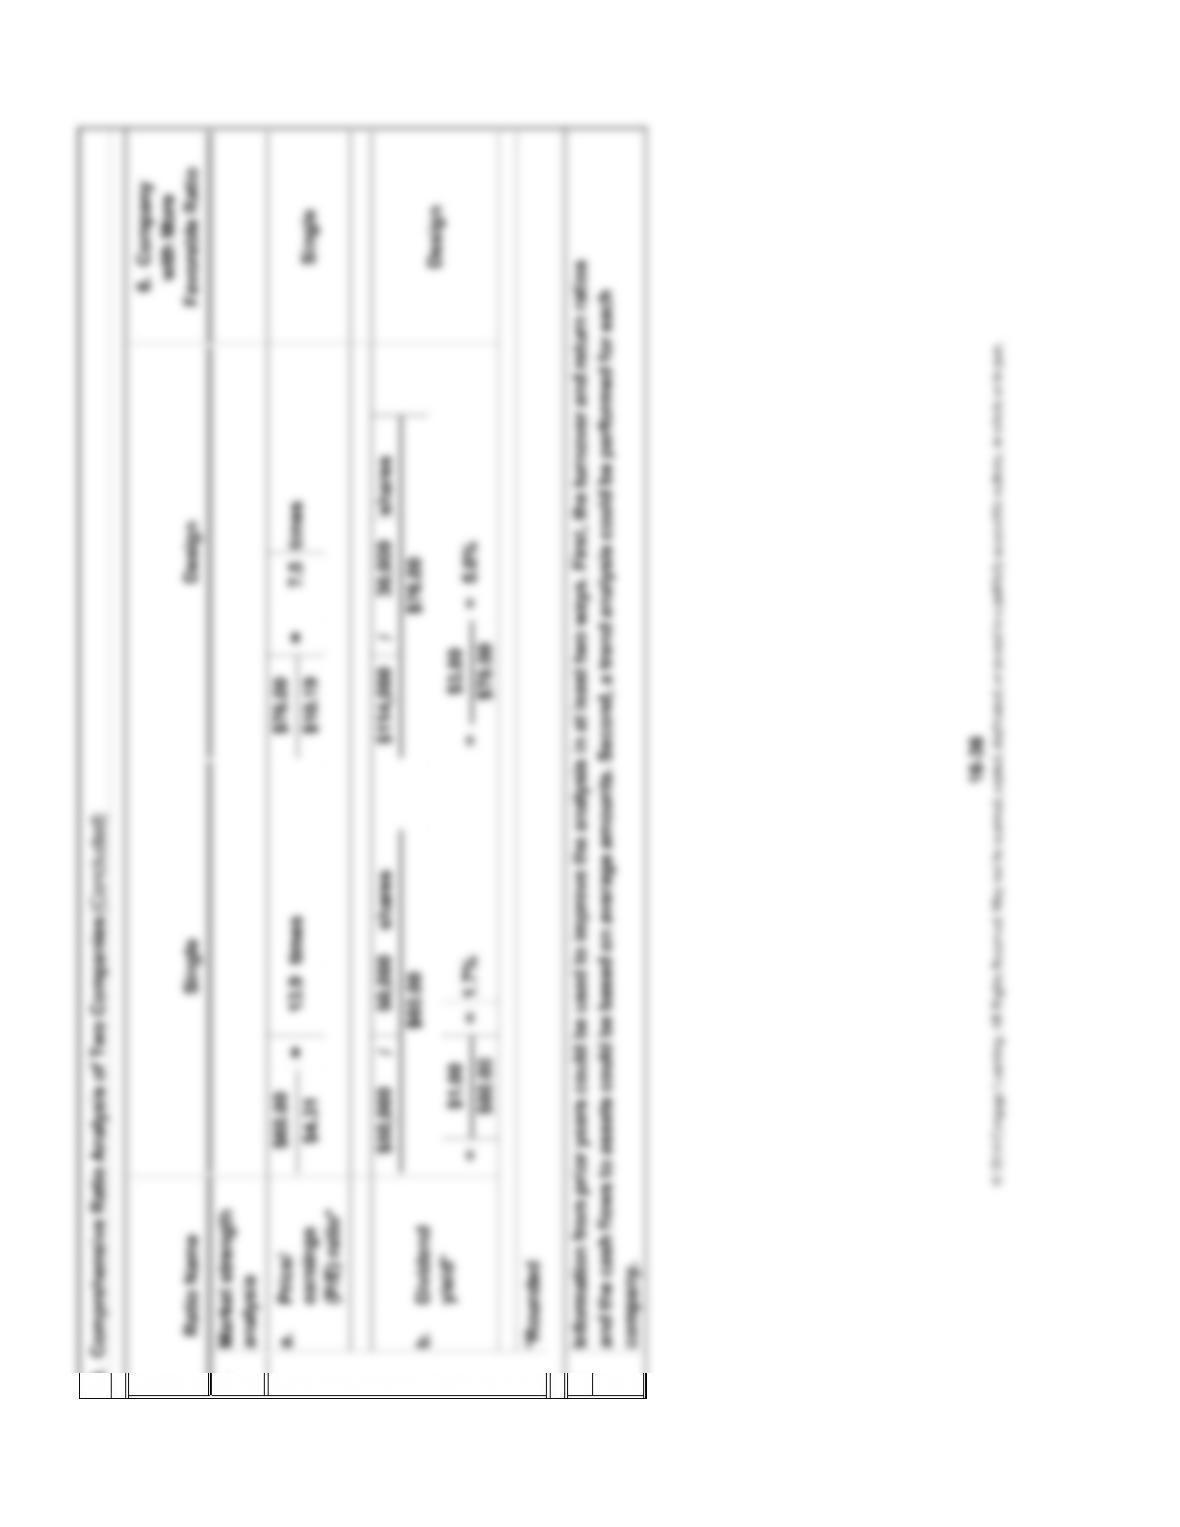
P4. Comprehensive Ratio Analysis of Two Companies (Continued)
g.
25.9 Design
Payables
turnover*
Days’
inventory
on hand*
365 days
= 30.9
37.2 days
i. Financing
period
h.
Days’
payable*
*Rounded
Design
times
365 days
© 2014 Cengage Learning. All Rights Reserved. May not be scanned, copied, duplicated, or posted to a publicly accessible website, in whole or in part.
6. Company
with More
Favorable Ratio
times
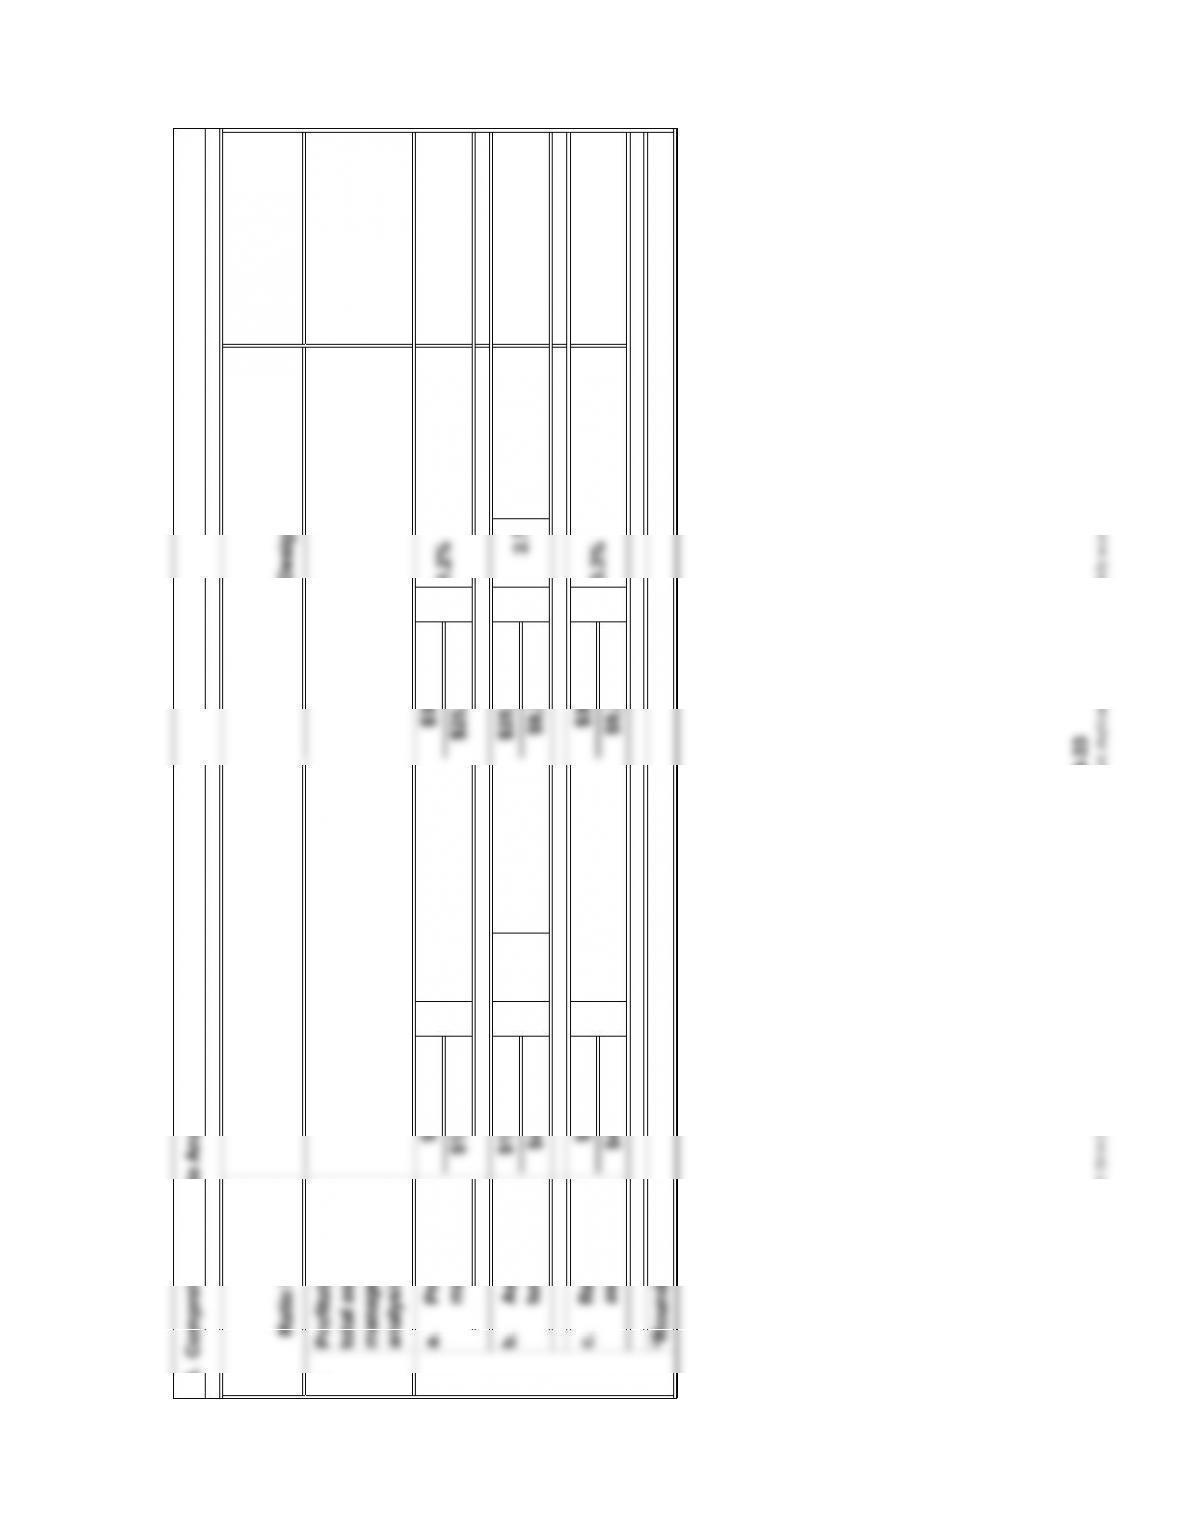
$4,987,200
1.7%
2. Profitability and
Design
= 1.2%
= Single
$4,987,200 4.3%
P4. Comprehensive Ratio Analysis of Two Companies (Continued)
Single
Design=
=
Single
16-33
© 2014 Cengage Learning. All Rights Reserved. May not be scanned, copied, duplicated, or posted to a publicly accessible website, in whole or in part.
Single
P4. Comprehensive Ratio Analysis of Two Companies (Continued)
3.
6. Company
with More
Favorable Ratio
Design
+
time
Design
$2,112,000
$2,000,000
Design
–– ––
6. Company
with More
Favorable Ratio
times1.6
Design
Design
=
$215,400 1.3
4.
Cash flows to
sales*
$271,500 =
$271,500
$25,210,000
times
Single
5.3%
$492,500
=5.4% $9,326,600
$1,050,000$114,000
Free cash
flow ($403,500)
$50,000 Single
yield*
$271,500 =
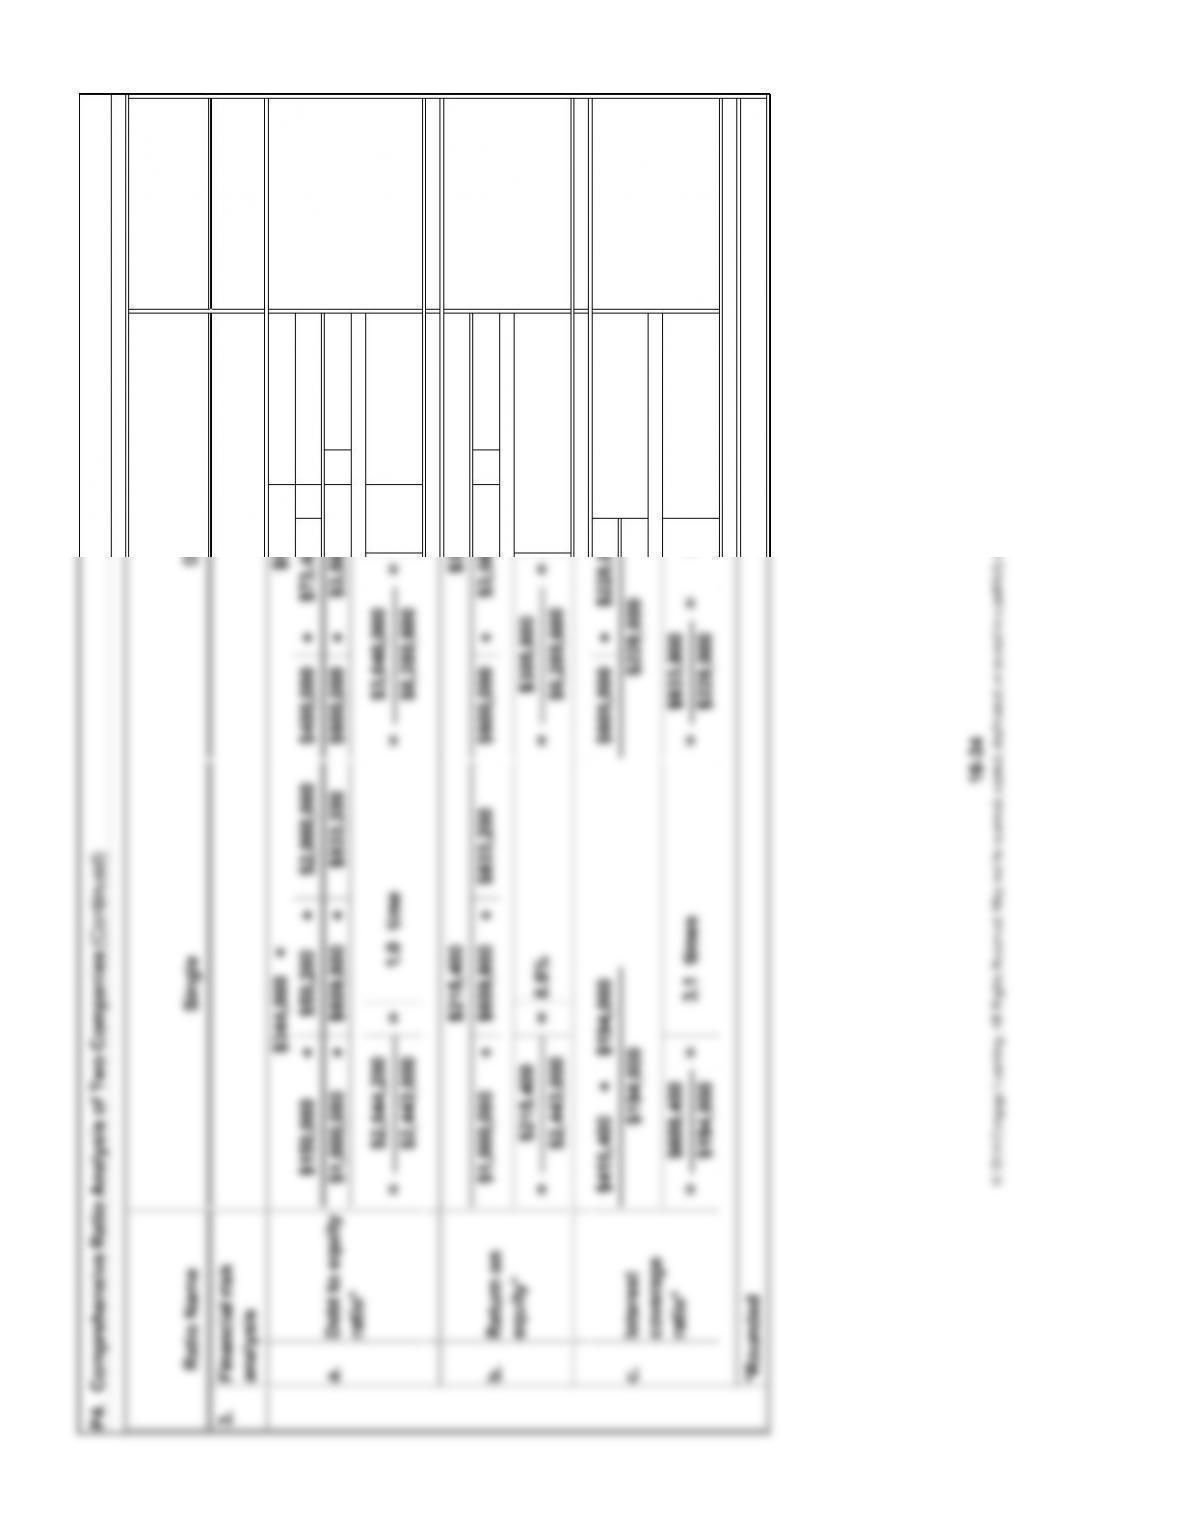
P4. Comprehensive Ratio Analysis of Two Companies (Continued)
Ratio Name Single
($671,500)
Cash flows to
assets*
$625,000
Neutral
$4,987,200
=
16-35
//
7.
$114,000
Price/
earnings
(P/E) ratio*
Design
$76.00 =
Single
times
P4. Comprehensive Ratio Analysis of Two Companies (Concluded)
5.
Ratio Name Single
times
$60.00
$4.31
shares
$76.00
Design
==
5.0%= $3.80
=
$60.00
$60.00
7.5
30,000
$1.00
=
shares
Dividend
yield*
$50,000
1.7%
6. Company
with More
Favorable Ratio
16-36
© 2014 Cengage Learning. All Rights Reserved. May not be scanned, copied, duplicated, or posted to a publicly accessible website, in whole or in part.
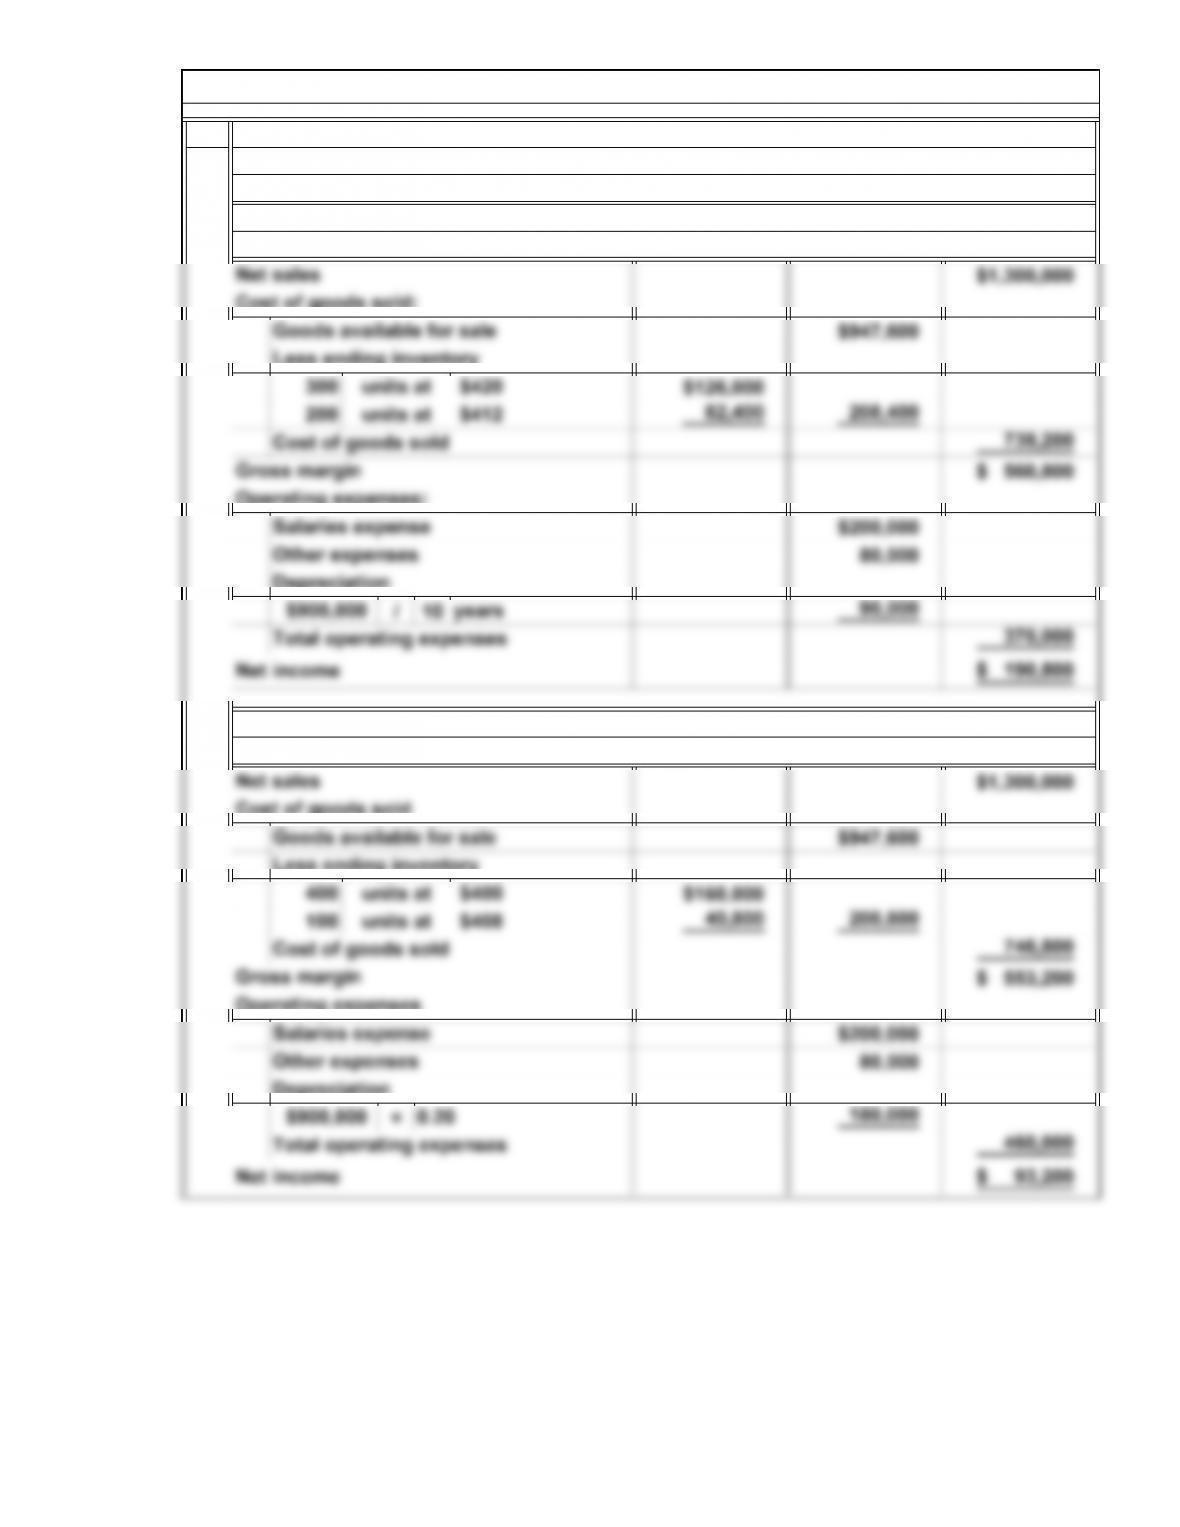
1.
P5. Effect of Alternative Accounting Methods
For the Year Ended December 31, 2014
Furlong Corporation
Alternative Income Statements
Income Statement Using FIFO
and Straight-Line Methods
16-37
© 2014 Cengage Learning. All Rights Reserved. May not be scanned, copied, duplicated, or posted to a publicly accessible website, in whole or in part.
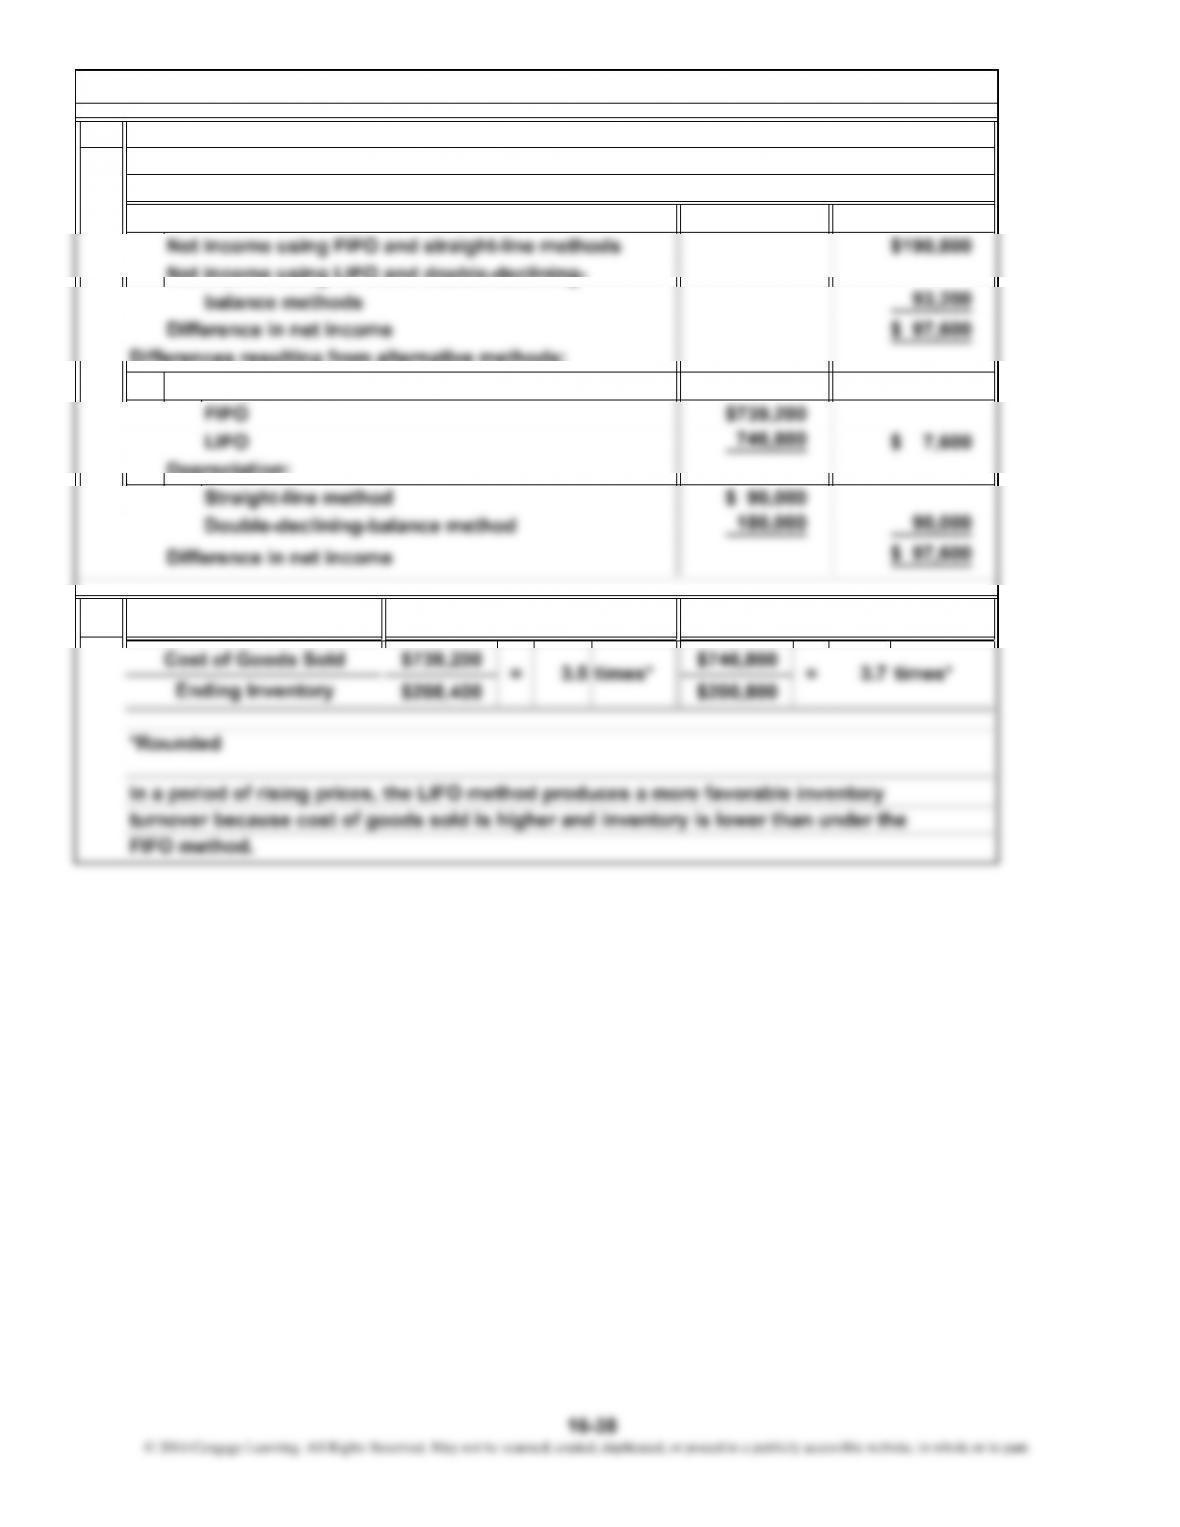
2.
3.
$208,400 $200,800
FIFO Method
Inventory Turnover
LIFO Method
$ 90,000
180,000 90,000
$ 97,600
$ 7,600
746,800
P5. Effect of Alternative Accounting Methods (Continued)
*Rounded
Ending Inventory
Depreciation:
Straight-line method
Double-declining-balance method
Difference in net income
Schedule of Differences in Net Income
For the Year Ended December 31, 2014
LIFO
Furlong Corporation
Difference in net income:
Net income using LIFO and double-declining-
Differences resulting from alternative methods:
Cost of goods sold:
16-38
© 2014 Cengage Learning. All Rights Reserved. May not be scanned, copied, duplicated, or posted to a publicly accessible website, in whole or in part.
4.
$190,800
$80,000 + $200,800 + $900,000 – $180,000
$93,200
$1,000,800
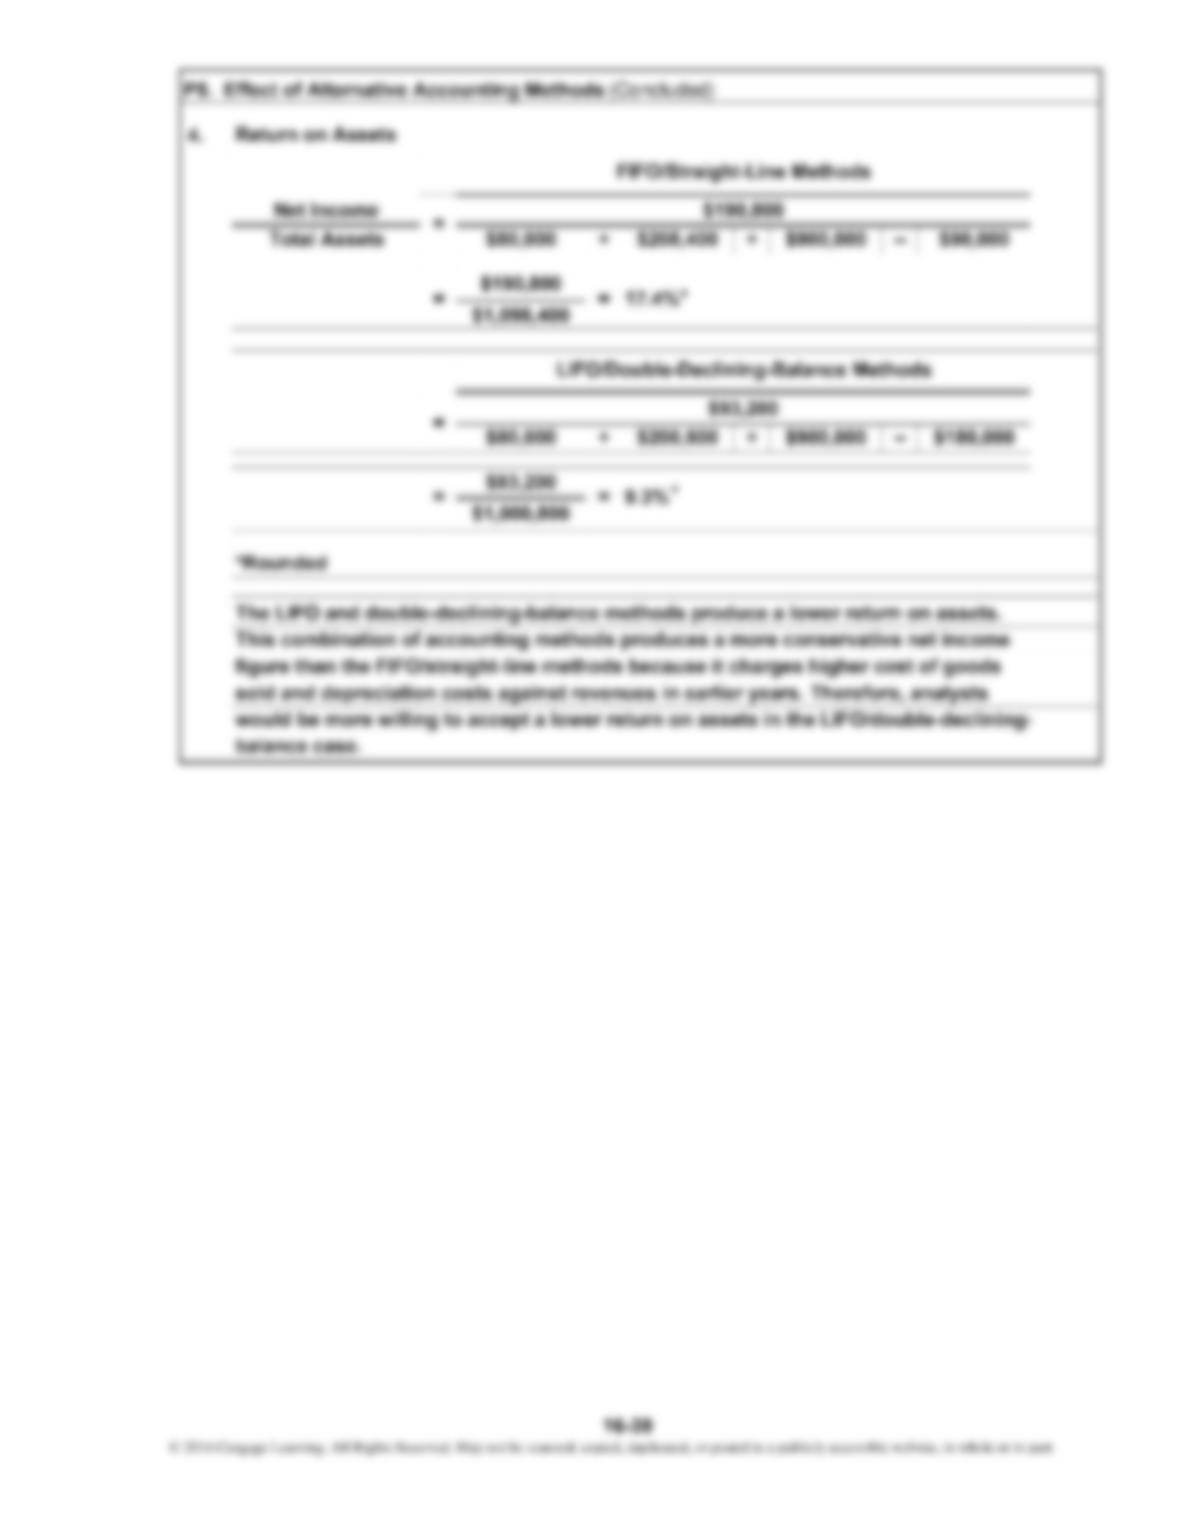
FIFO/Straight-Line Methods
would be more willing to accept a lower return on assets in the LIFO/double-declining-
balance case.
Return on Assets
sold and depreciation costs against revenues in earlier years. Therefore, analysts
$93,200
Net Income =
=
The LIFO and double-declining-balance methods produce a lower return on assets.
This combination of accounting methods produces a more conservative net income
figure than the FIFO/straight-line methods because it charges higher cost of goods
$190,800
P5. Effect of Alternative Accounting Methods (Concluded)
*Rounded
= = 9.3%
LIFO/Double-Declining-Balance Methods
*
16-39
© 2014 Cengage Learning. All Rights Reserved. May not be scanned, copied, duplicated, or posted to a publicly accessible website, in whole or in part.
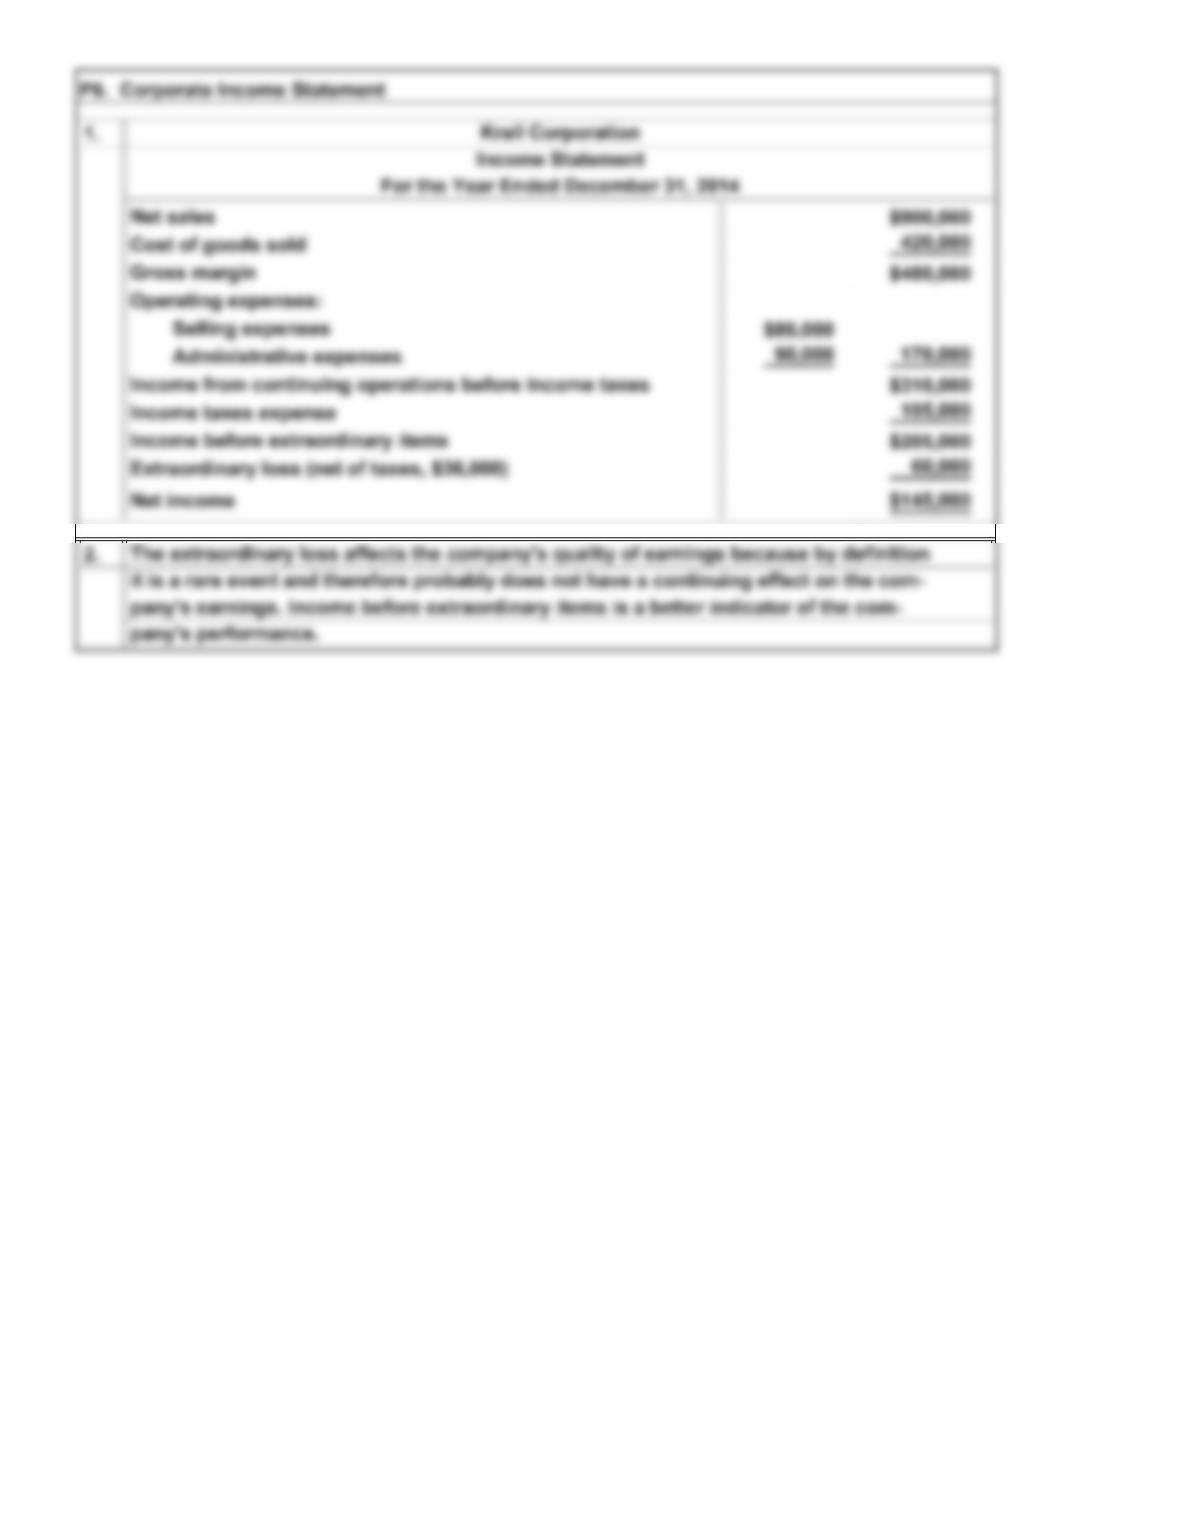
1.
P6. Corporate Income Statement
Income Statement
For the Year Ended December 31, 2014
Krall Corporation
16-40
© 2014 Cengage Learning. All Rights Reserved. May not be scanned, copied, duplicated, or posted to a publicly accessible website, in whole or in part.