
426
b. Horizontal Common-Size
For the Years Ended December 31
Total
United
States
Europe
Africa
Asia
and other
2010
Sales and other operating revenues
Unaffiliated customers
Inter-company
Total revenues
100.0
100.0
100.0
26.9
100.0
28.1
26.2
——
25.7
32.0
——
31.5
15.0
——
14.8
Cost and expenses
Production expenses, including
related taxes
100.0
25.4
37.8
23.6
13.1
Exploration expenses, including
dry holes and lease impairment
100.0
42.1
5.7
16.5
35.7
General, administrative and other expenses
100.0
57.3
17.1
7.1
18.5
Depreciation, depletion and amortization
100.0
29.2
20.8
34.7
15.2
Asset impairments
100.0
—–
—–
100.0
—–
Total costs and expenses
100.0
28.6
22.1
33.0
16.3
Results of operations before income taxes
100.0
27.1
33.0
28.4
11.6
Provision for income taxes
100.0
19.3
30.1
36.6
14.0
Results of operations
100.0
36.3
36.4
18.5
8.8
c. Comment on the Common-Size Analysis in (a) and (b)
Comments on Vertical Common-Size
material fluctuation in results of operations.
Comments on Horizontal Common-Size
Three areas contribute substantially to revenues from unaffiliated customers (Africa,
United States, and Europe).
expenses.
Africa and United States have the largest amount of total costs and expenses.
427
CASE 12-3 FINANCIAL SERVICES PROVIDER
(This case provides an opportunity to review provision for loan losses.)
Recoveries increased slightly in 2009 and increased materially in 2010.
Note: The trend appears to be positive between 2009 and 2010.
CASE 12-4 ATTRACTING DEPOSITS
a.
2010
2009
2008
1. Total interest income
122.0
112.8
100.0%
2. Total interest expense
67.9
87.2
100.0%
3. Provision for credit losses
178.6
217.8
100.0%
4. Total fees and other income
130.2
78.6
100.0%
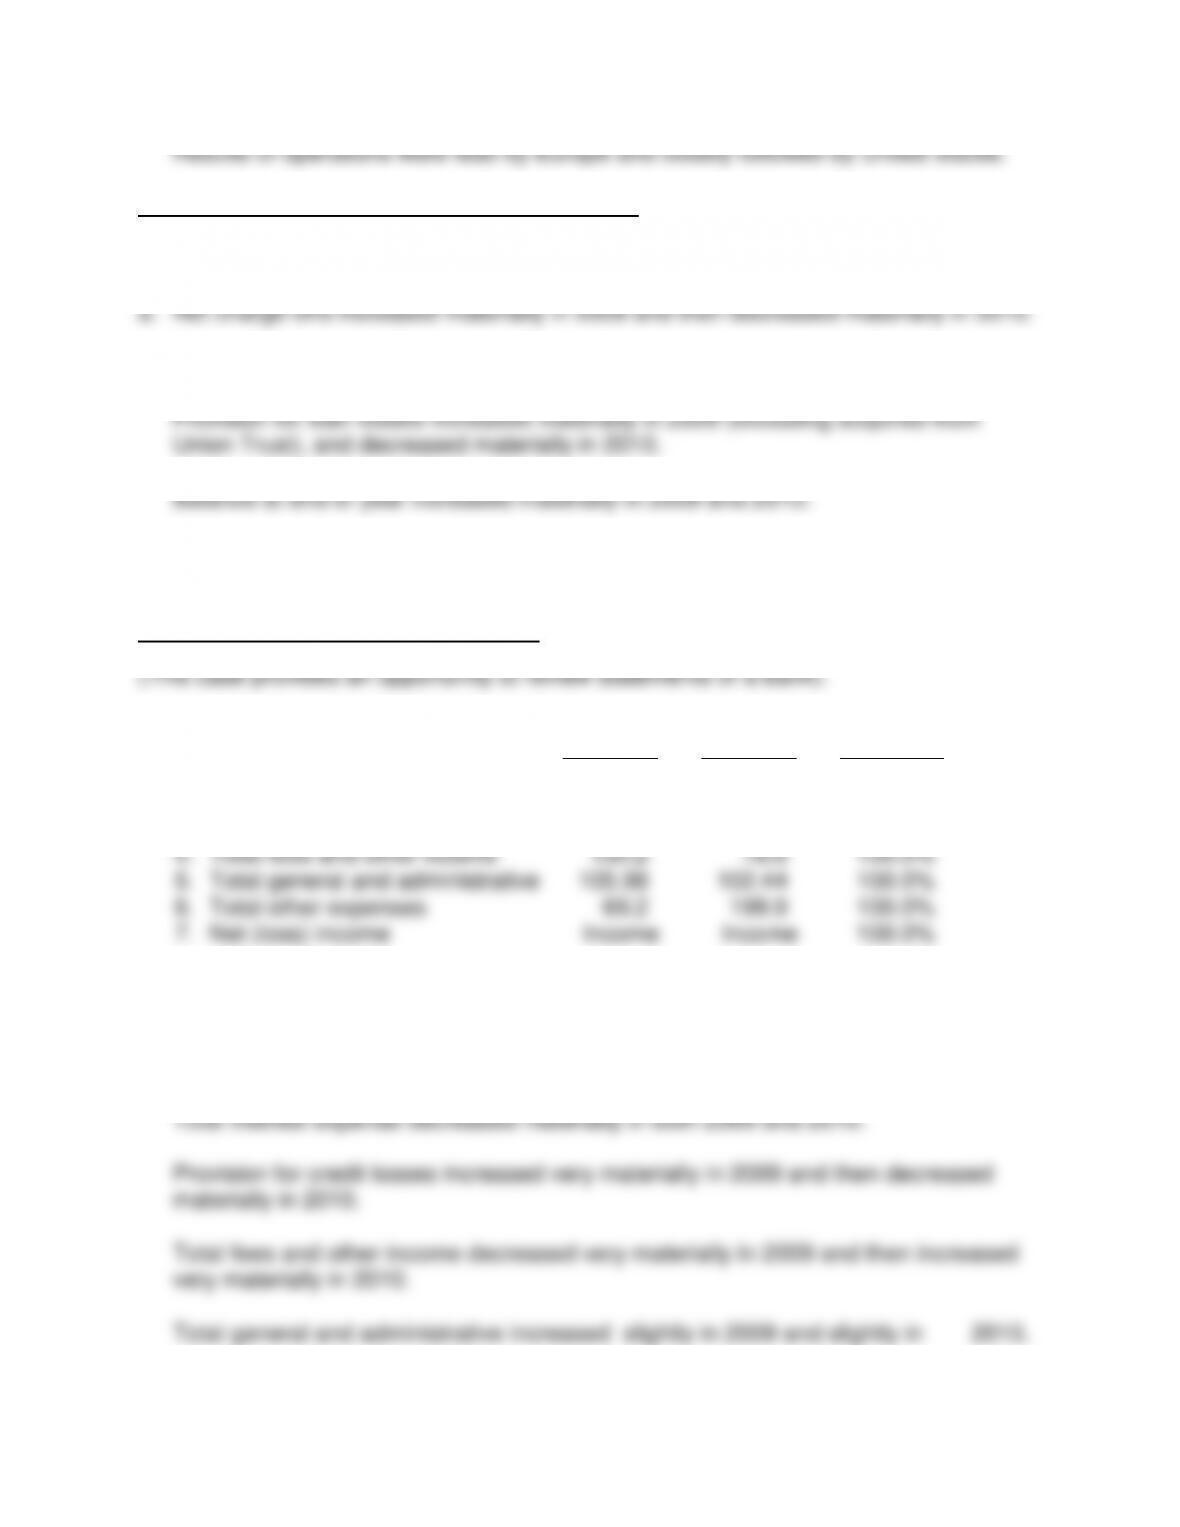
5. Total general and administrative
105.98
102.44
100.0%
6. Total other expenses
69.2
199.9
100.0%
7. Net (loss) income
Income
Income
100.0%
Note: Net income was $143,756,000 in 2009 and $1,022,136,000 in 2010. This
was an increase of 711.0%.
b. Total interest income increased materially in 2009 and 2010.
428
Total other expenses increased very materially in 2009 and decreased very
materially in 2010.
c. 1. Total charge-offs
2. Charge-offs, net of recoveries
3. Allowance for loan losses balance, end of period
4. Total impaired loans
5. Allowance for impaired loans
6. Total loans past due 90 days as to interest or principal and accruing interest
d. Ratios for 2010 and 2009
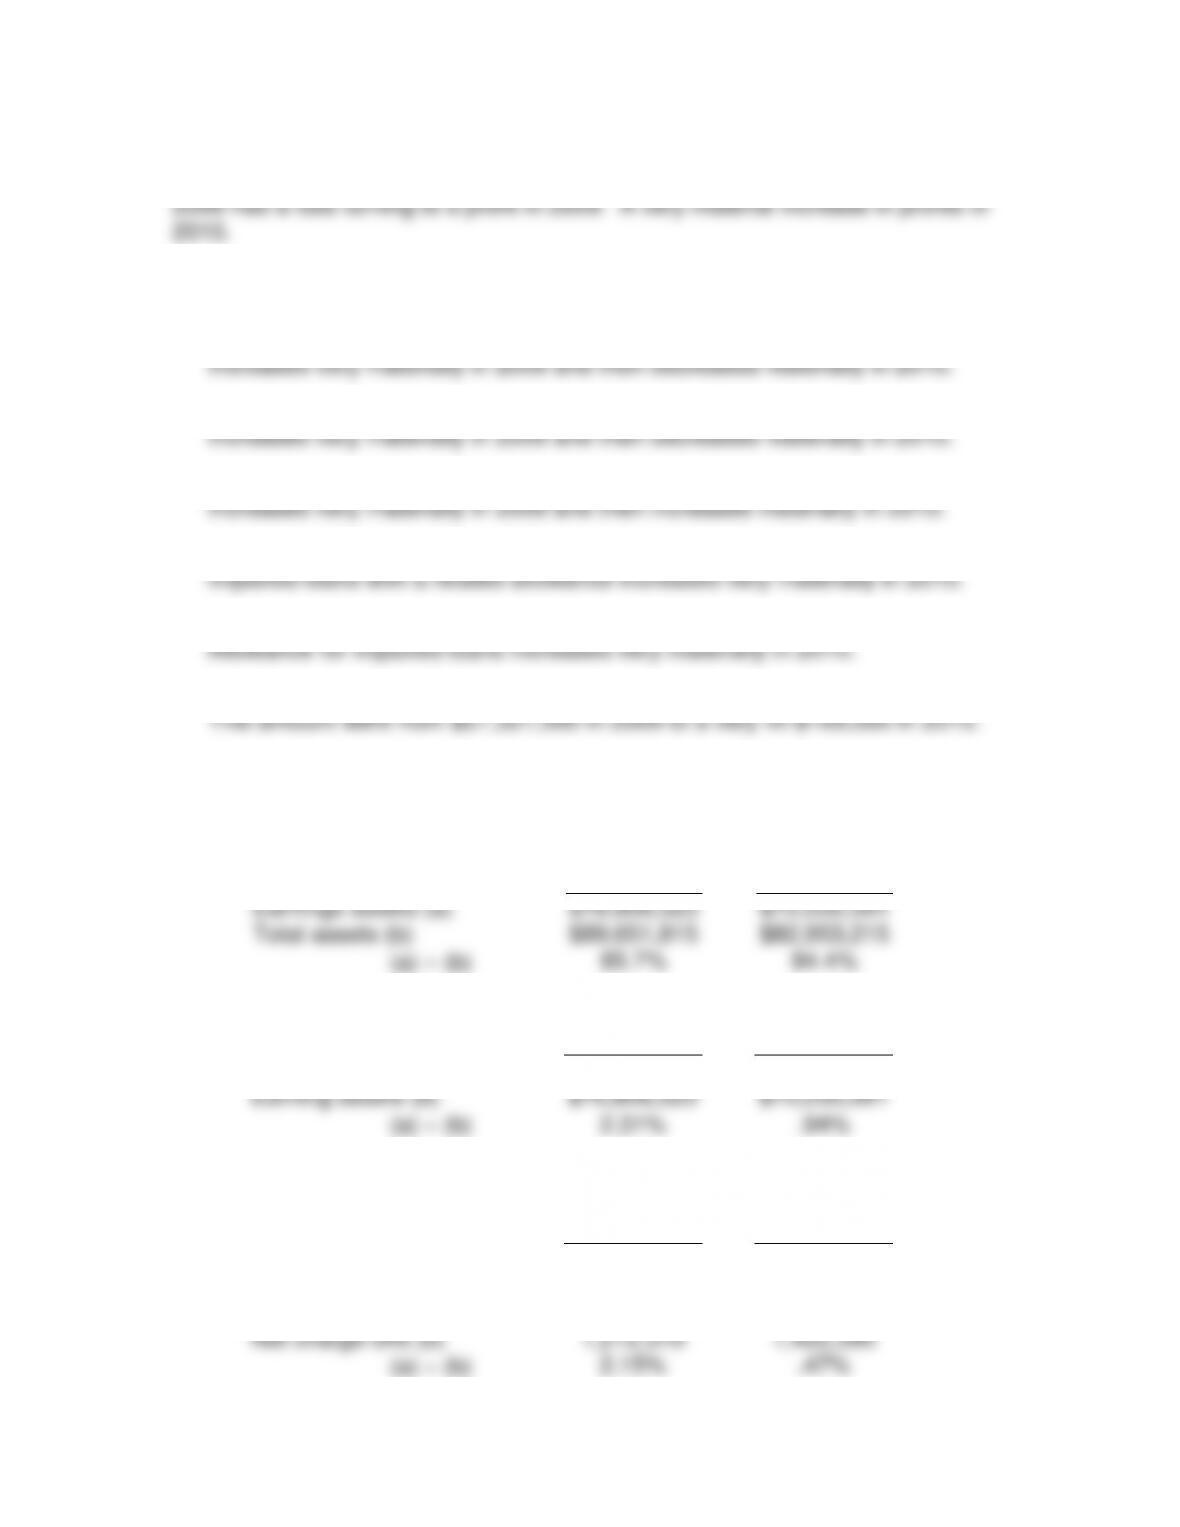
1. Earning assets to total assets = Earning Assets/Total Assets
2010
2009
Earnings assets (a)
$76,806,523
$70,035,591
Total assets (b)
$89,651,815
$82,953,215
(a) (b)
85.7%
84.4%
2. Interest margin to earning assets
2010
2009
Interest margin (a)
$1,771,613
$658,967
Earning assets (b)
$76,806,523
$70,035,591
(a) (b)
2.31%
.94%
3. Loan loss coverage ratio
2010
2009
Pretax income
1,018,985
($1,122,899)
Provision for loan losses
1,585,545
1,790,559
Total (a)
2,604,530
667,660
Net charge-offs (b)
1,212,310
1,422,390
(a) (b)
2.15%
.47%
429
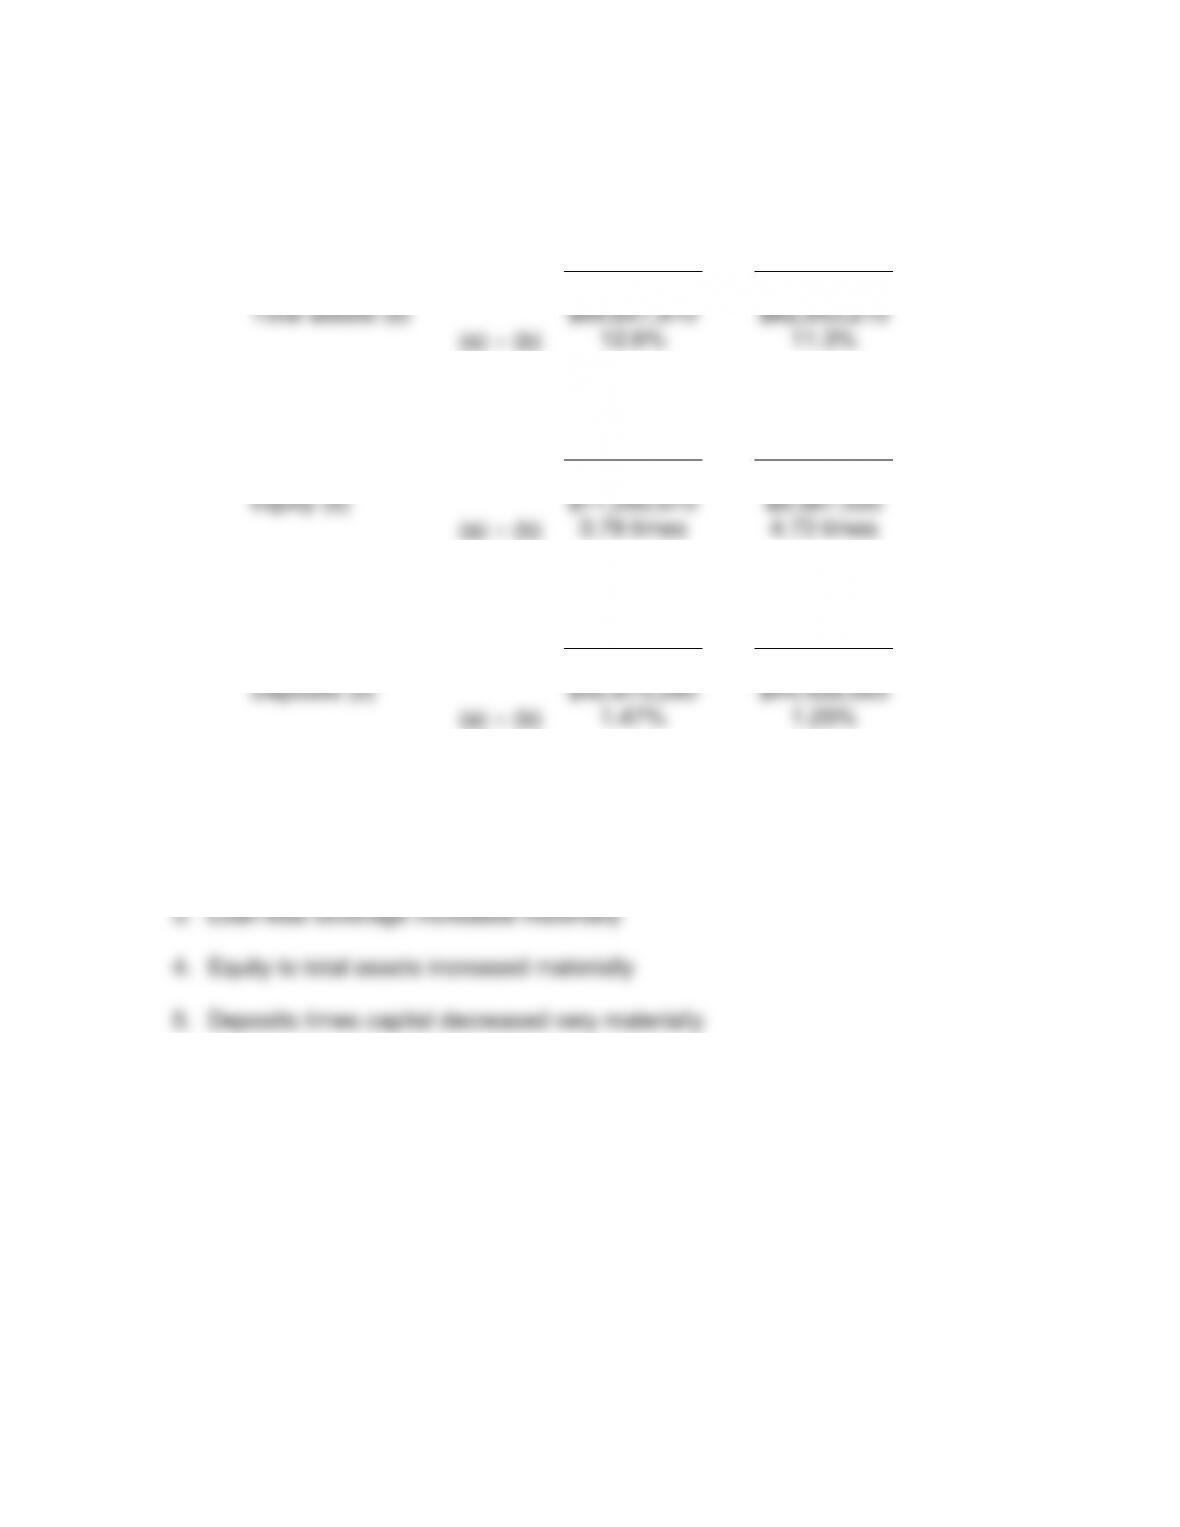
4. Equity to total assets
2010
2009
Equity (a)
$11,260,670
$9,387,535
Total assets (b)
$89,651,815
$82,953,215
(a) (b)
12.6%
11.3%
5. Deposits times capital
2010
2009
Deposits (a)
$42,673,293
$44,428,065
Equity (b)
$11,260,670
$9,387,535
(a) (b)
3.79 times
4.73 times
6. Loans to deposits
2010
2009
Loans (a)
$62,820,434
$55,733,953
Deposits (b)
$42,673,293
$44,428,065
(a) (b)
1.47%
1.25%
e. Trends indicated by the ratios
1. Earnings assets to total assets slightly increased
2. Interest margin to earning assets increased materially
6. Loans to deposits increased materially
CASE 12-5 COVERED
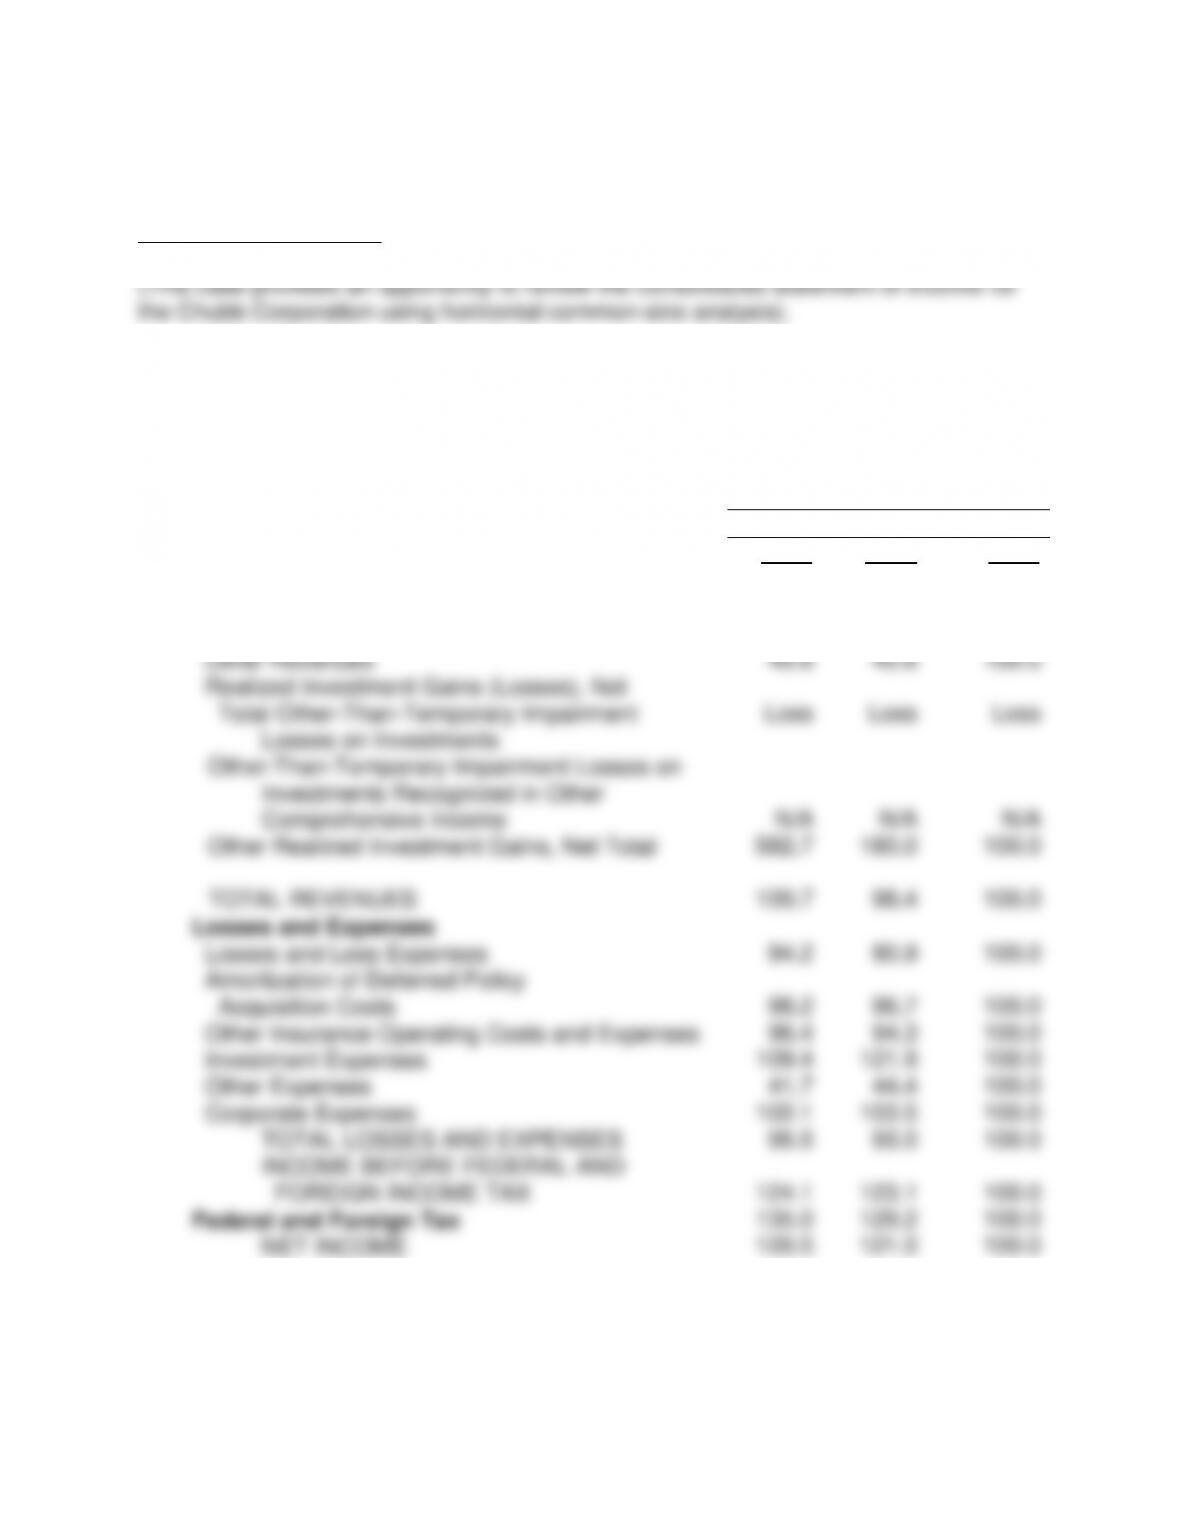
a.
The Chubb Corporation
Consolidated Statements of Income
Horizontal Common-Size
In Millions,
Years Ended December 31
2010
2009
2008
Revenues
Premiums Earned
Investment Income
Other Revenues
Realized Investment Gains (Losses), Net
Total Other-Than-Temporary Impairment
Losses on Investments
Other-Than-Temporary Impairment Losses on
Investments Recognized in Other
Comprehensive Income
Other Realized Investment Gains, Net Total
TOTAL REVENUES
94.8
96.1
40.6
Loss
N/A
582.7
100.7
95.8
95.2
40.6
Loss
N/A
180.0
98.4
100.0
100.0
100.0
Loss
N/A
100.0
100.0
Losses and Expenses
Losses and Loss Expenses
Amortization of Deferred Policy
Acquisition Costs
Other Insurance Operating Costs and Expenses
Investment Expenses
Other Expenses
Corporate Expenses
TOTAL LOSSES AND EXPENSES
INCOME BEFORE FEDERAL AND
NET INCOME
94.2
98.2
96.4
109.4
41.7
102.1
95.5
90.9
96.7
94.3
121.9
44.4
103.5
93.0
100.0
100.0
100.0
100.0
100.0
100.0
100.0
431
b. Revenues
2010
Losses and Expenses
moderately in 2010
Amortization of deferred policy acquisition costs decreased moderately in 2009
and then increased slightly in 2010
Investment expenses increased materially in 2009 and then decreased
Corporate expenses increased slightly in 2009 and decreases slightly in 2010
slightly in 2010
slightly in 2010
moderately in 2010
2010