419
b. The operating ratio decreased, indicating improved efficiency. Funded debt to
Percent earned to operating property increased, indicating improved profitability.
profitability.
be considered to be positive.
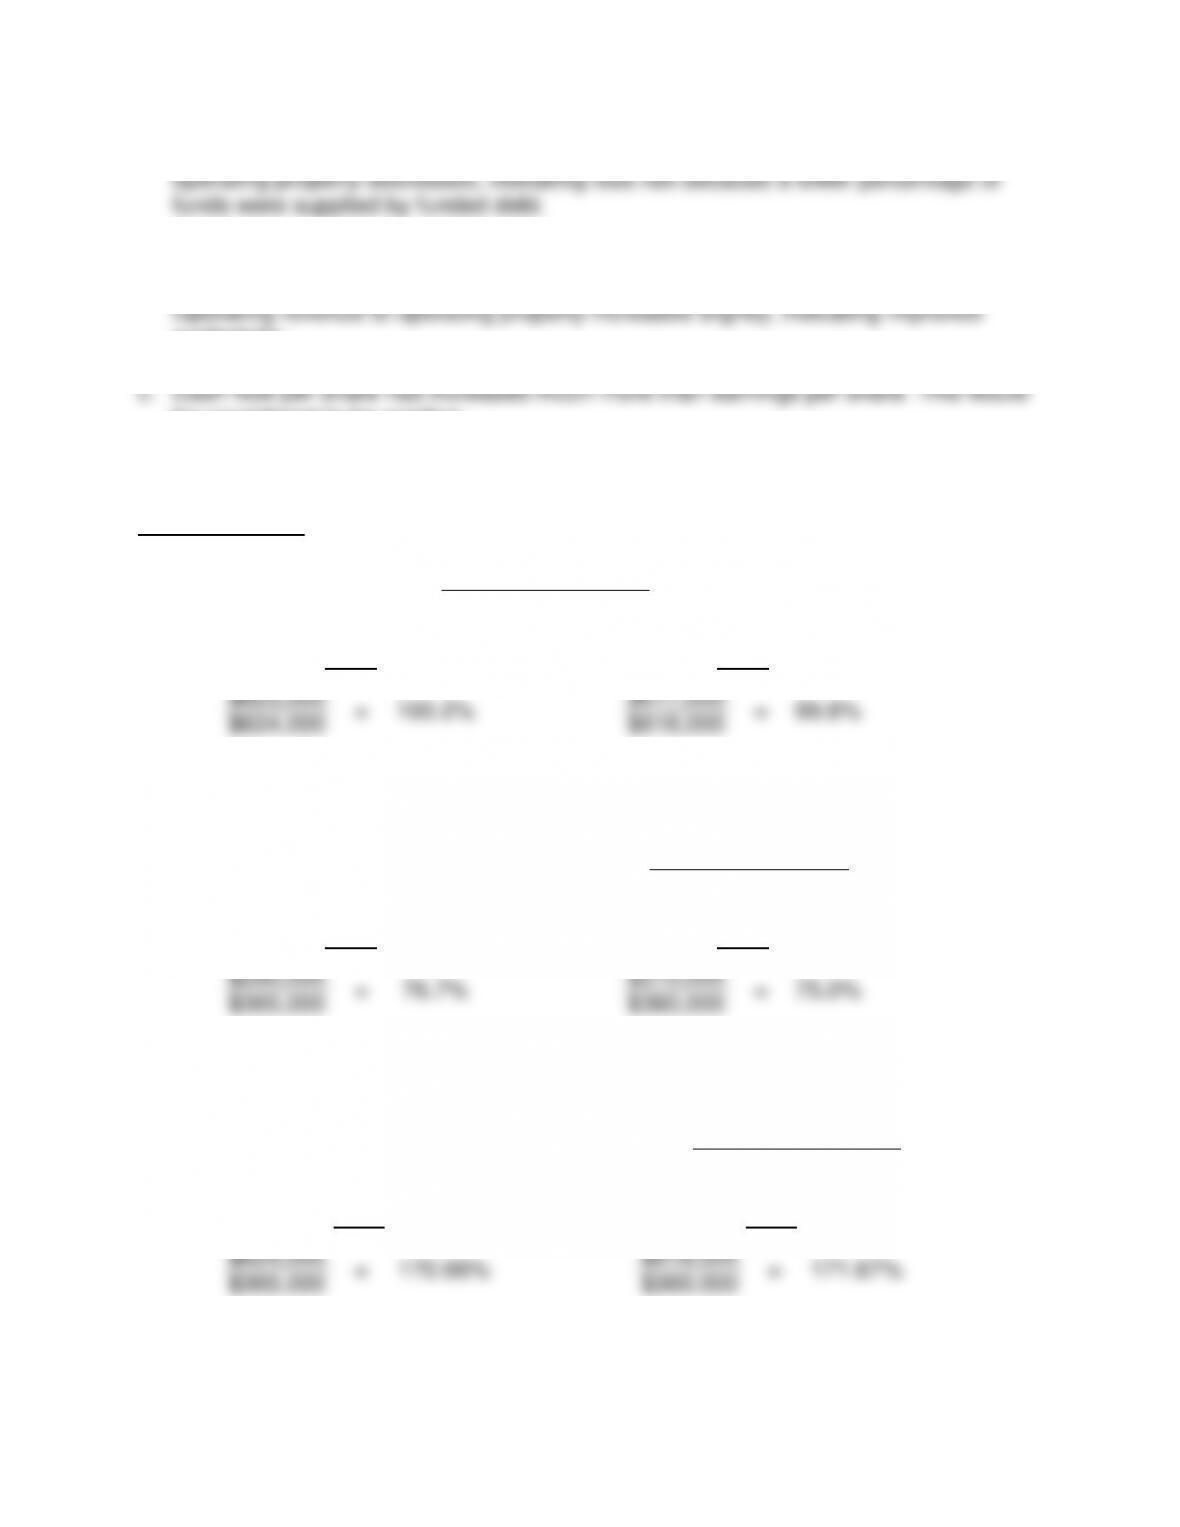
PROBLEM 12-5
a.
Operating Ratio
=
Operating Expense
Operating Revenue
2011
2010
$625,000
=
100.2%
$617,000
=
99.8%
$624,000
$618,000
This firm is having profit problems. Expenses have increased faster than revenues.
b.
Long-Term Debt to Operating Property
=
Long-Term Debt
Operating Property
2011
2010
$280,000
=
76.7%
$270,000
=
75.0%
$365,000
$360,000
This firm is using more debt in absolute terms and in relation to operating property.
c.
Operating Revenue to Operating Property
=
Operating Revenue
Operating Property
2011
2010
$624,000
=
170.96%
$618,000
=
171.67%
$365,000
$360,000
The turnover has remained relatively constant.
420
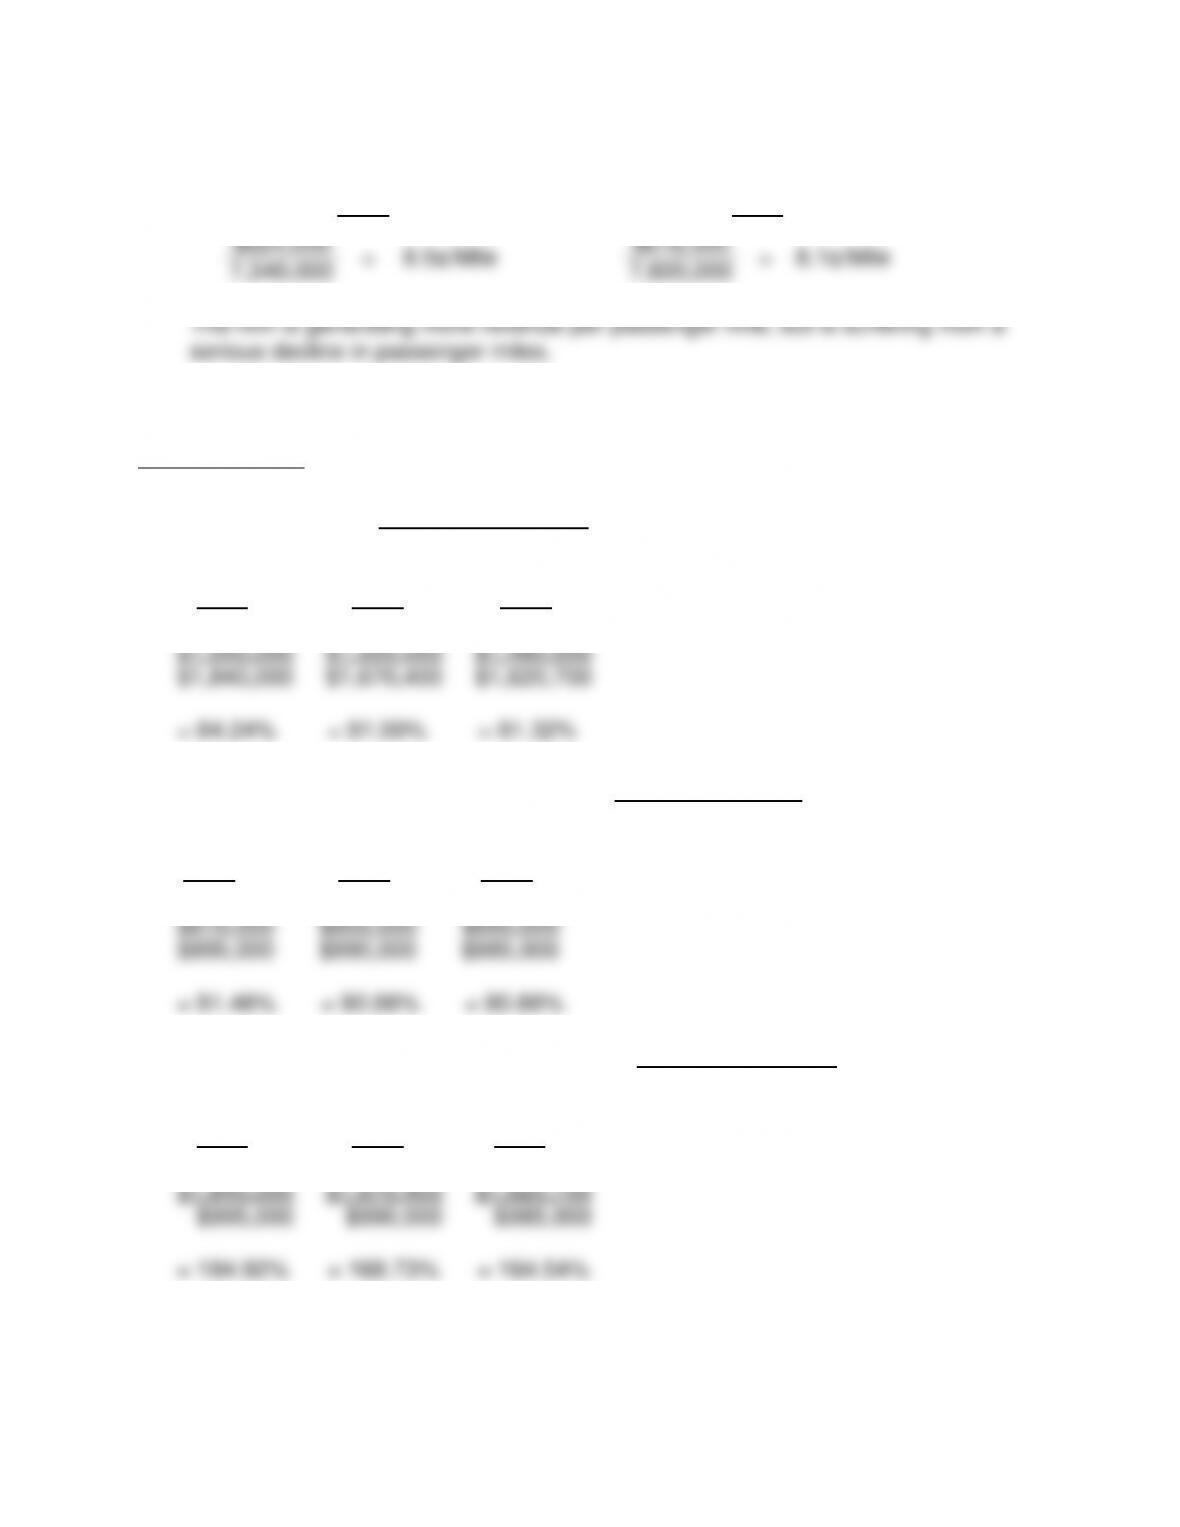
d. Revenue per Passenger Mile:
2011
2010
$624,000
=
8.5¢/Mile
$618,000
=
8.1¢/Mile
7,340,000
7,600,000
PROBLEM 12-6
a. 1. Operating Ratio = Operating Expenses
Operating Revenues
2011 2010 2009
2. Long-Term Debt To Operating Property = Long -Term Debt
Operating Property
2011 2010 2009
3. Operating Revenue to Operating Property = Operating Revenue
Operating Property
2011 2010 2009
b. The operating ratio decreased significantly, indicating improved profitability.
profitability.
c. The passenger load factor increased materially, indicating improved profitability.
PROBLEM 12-7
a.
2
Bond companies do not represent a basic type of insurance organization.
b.
1
For insurance financial reporting, the balance sheet is not a class.
c.
1
Investment gains/losses are not part of the quantification process when
estimating the reserves.
d.
5
For investment contracts, termination fees are not booked as revenue
over the period of the contract.
e.
3
After the annual reports are files with the individual state insurance
departments, a testing process is conducted by the NAIC. If a
company’s ratio is outside the prescribed limit, the NAIC brings that to the
attention of the state insurance department.
f.
5
All of the above contribute to the relatively low market value of insurance
companies.
422
PROBLEM 12-8
a.
5
Savings accounts would be a representative liability of a bank.
b.
3
Cash is not an earning asset of a bank for the earning assets to total
assets ratio.
c.
4
Interest margin to average total assets provides an indication of
management’s ability to control the spread between interest income and
interest expense.
d.
3
Cash on hand would not be a representative liability of a bank.
e.
5
Typically, the largest expense for a bank will be interest expense.
f.
4
Equity capital to total assets indicates the extent of equity ownership in a
bank.
PROBLEM 12-9
a.
4
The ratio funded debt to operating property indicates how funds are
supplied to a utility.
b.
2
The ratio percent earned on operating property relates net earnings to
the assets primarily intended to generate earnings for a utility.
c.
5
For a utility, the operating revenue to operating property ratio is basically
an operating assets turnover ratio.
d.
3
The operating ratio indicates a measure of operating efficiency for a
utility.
e.
3
For a transportation firm, long-term debt to operating property is a
measure of the source of funds with which property is obtained.
f.
5
The operating revenue to operating property ratio is a measure of
turnover of operating assets for a transportation firm.
g.
4
Banks, utilities, and transportation firms have a uniform system of
accounts. Oil and gas firms do not have a uniform system of accounts.
h.
5
None of the above types of companies have a balance sheet similar in
format to a manufacturing firm.
423
CASES
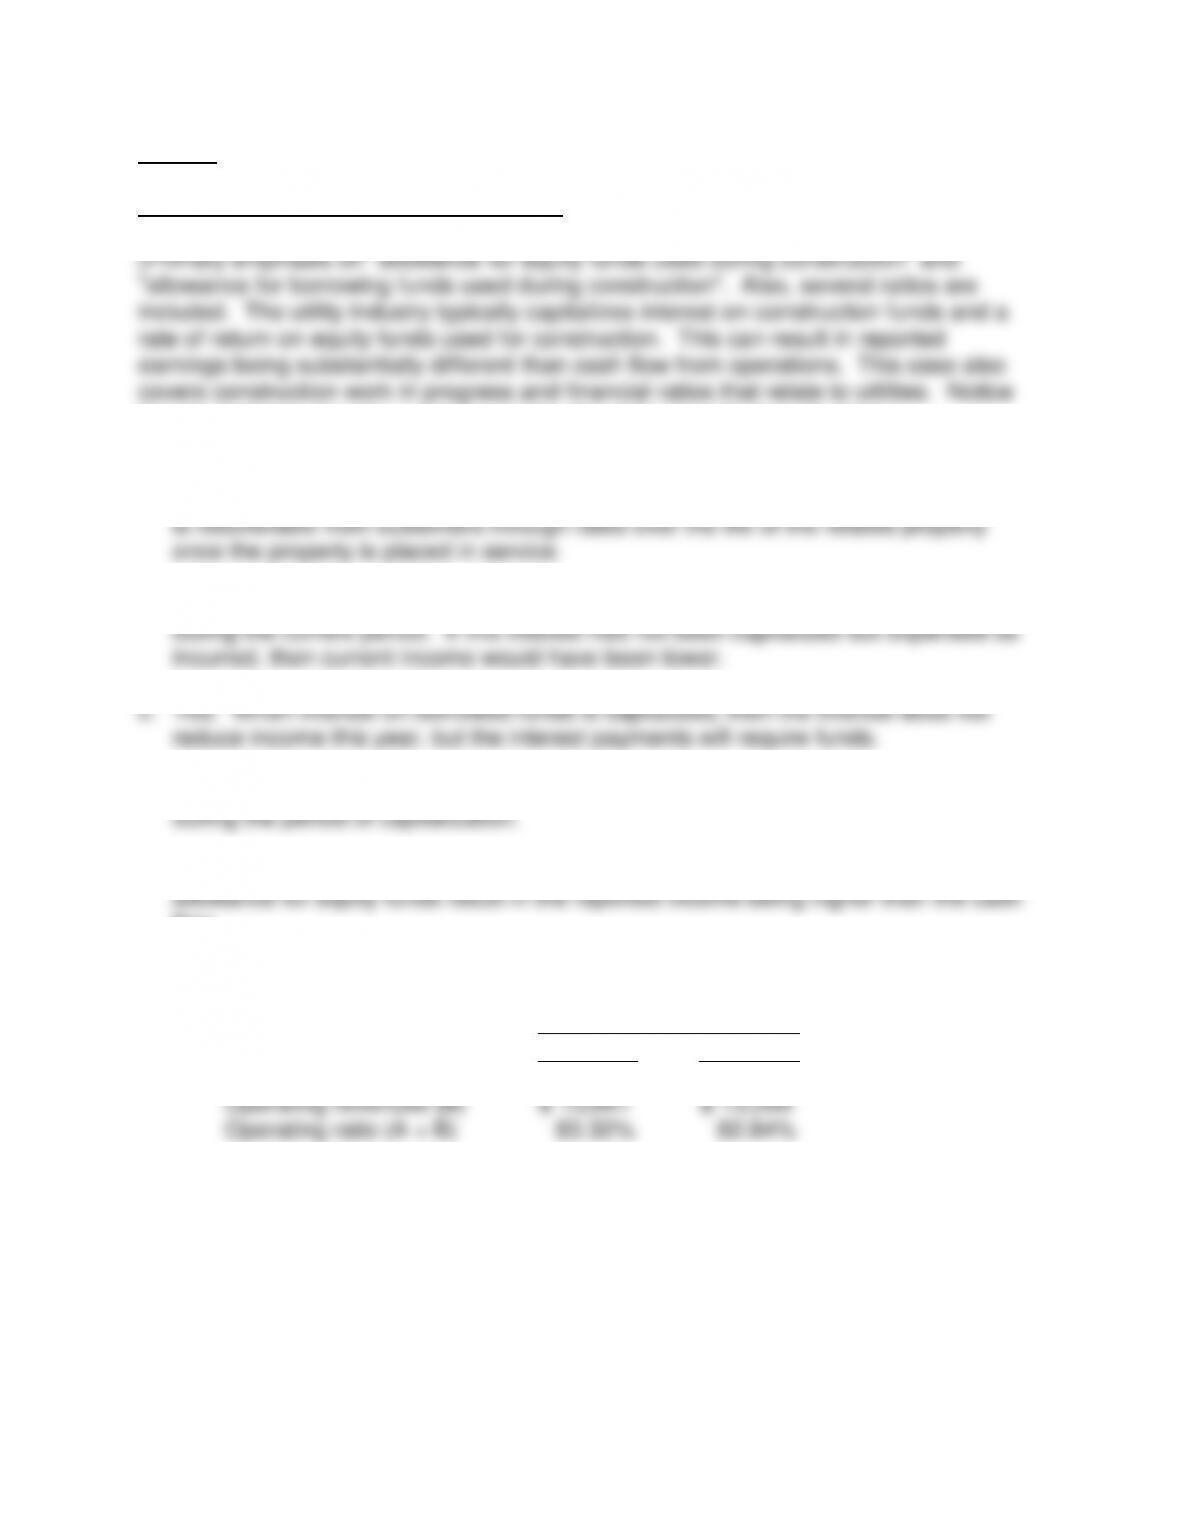
CASE 12-1 AFUDC EQUITY AND DEBT
that the balance sheet is not presented in the order described in the book.)
a. AFUDC is the estimated cost of debt and equity used to finance regulated plant
additions that can be recorded as part of the cost of construction projects. AFUDC
b. Capitalizing interest on borrowed funds prevents this expense from reducing income
d. Capitalizing allowance for equity funds used during construction increases income
e. Both the capitalization of interest on borrowed funds and the capitalization
flow.
f. 1. Operating ratio
In Millions
2010
2009
Operating expenses (A)
$
11,533
$
11,100
Operating revenues (B)
$
13,841
$
13,399
Operating ratio (A ÷ B)
83.32%
82.84%
424
2. Funded debt to operating property
In Millions
2010
2009
Funded debt* (A)
$809 + $10,906 +
$423 = $12,138
$342 + 10,381 +
$827 = $11,550
Operating property (B)
$31,449
$28,892
Funded debt to operating property
(A ÷ B)
38.60%
39.98%
*Included long-term debt and current maturities of long-term debt.
3. Percent earned on operating property
In Millions
2010
2009
Net income (A)
$1,113
$1,234
Operating property
$31,449
$28,892
Less: Construction in progress
$1,384
$1,888
Operating property adjusted for construction in
progress (B)
$30,065
$27,004
Percent earned on operating property (A ÷ B)
3.70%
4.57%
4. Operating revenue to operating property
In Millions
2010
2009
Operating revenues (A)
$13,841
$13,399
Operating property (B)*
$30,065
$27,004
Operating revenue to operating property (A ÷ B)
46.04%
49.62%
*Excluded construction in progress
425
Comment on the Above Ratios
1. Operating ratio
2. Funded debt to operating property
Decreased slightly
4. Operating revenue to operating property
A substantial decrease
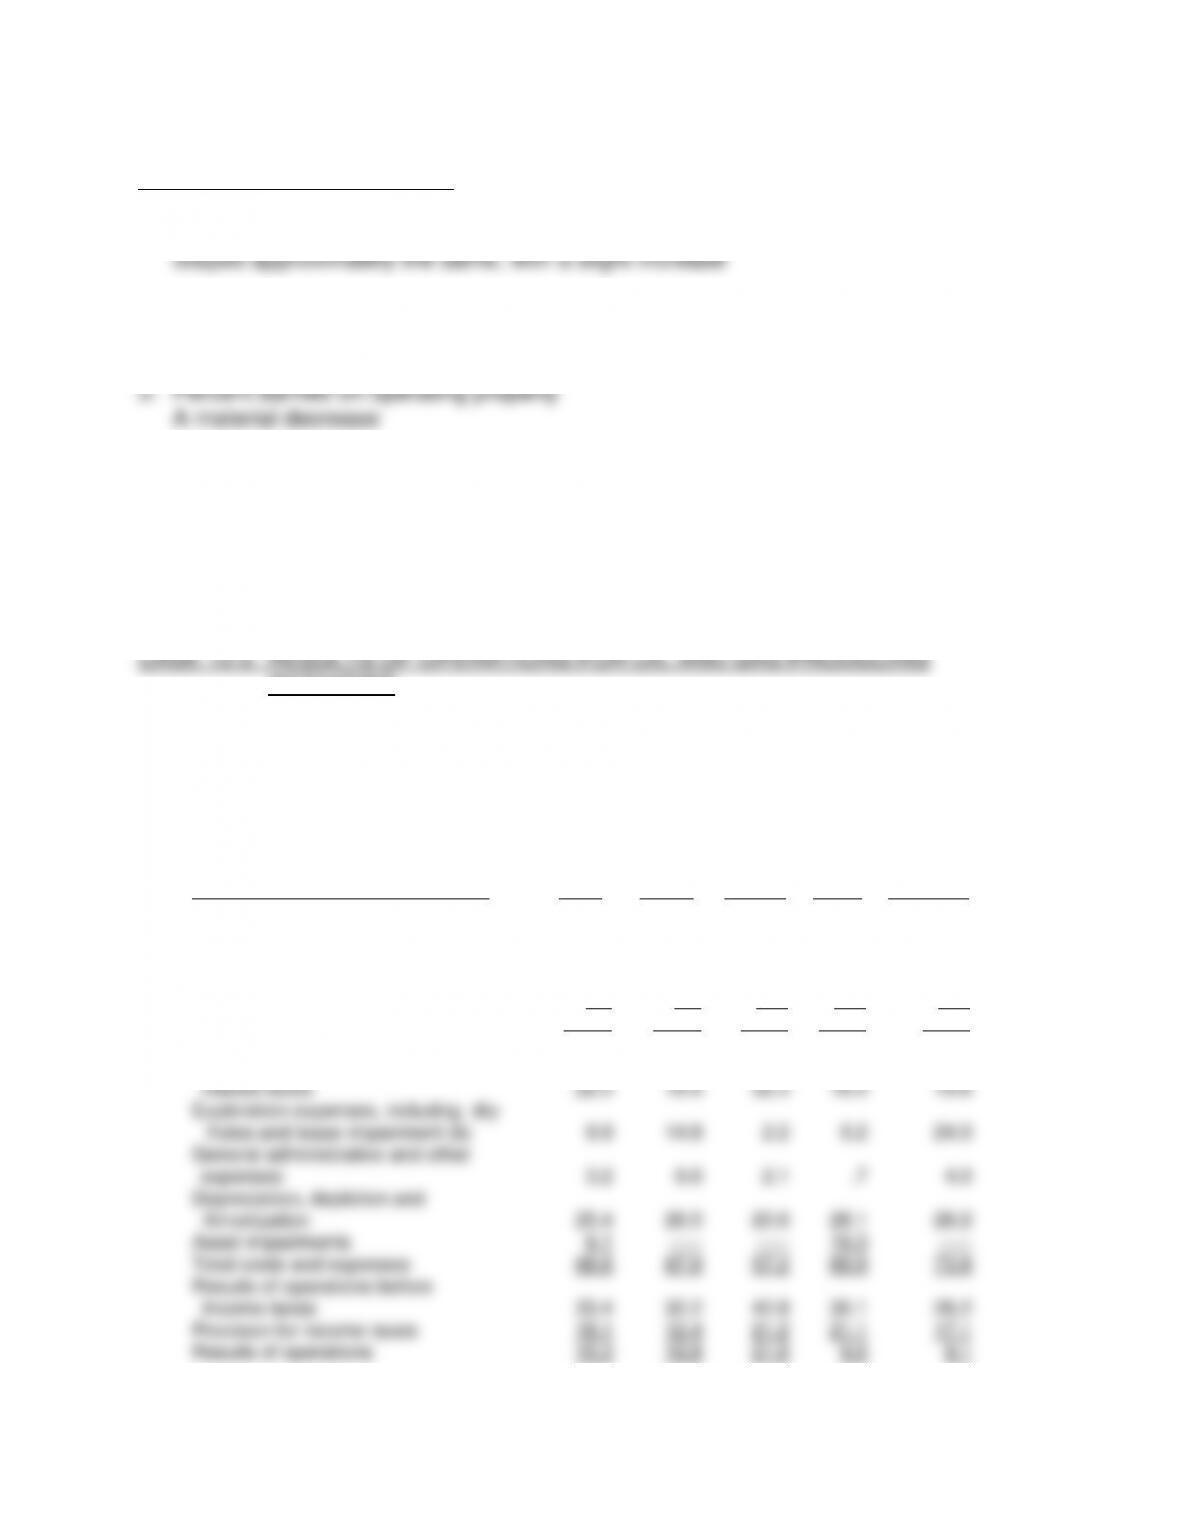
ACTIVITIES
(This case provides the opportunity to view results of operations for oil and gas
producing activities using vertical and horizontal common-size analysis.)
a. Vertical Common-Size
For the Years Ended December 31
Total
United
States
Europe
Africa
Asia
and other
2010
Sales and other operating revenues
Unaffiliated customers
Inter-company
Total revenues
98.4
1.6
100.0
94.2
5.8
100.0
100.0
—–
100.0
100.0
—–
100.0
100.0
—–
100.0
Cost and expenses
Production expenses, including
related taxes
22.0
19.9
32.3
16.5
19.6
Exploration expenses, including dry
holes and lease impairment (b)
9.9
14.8
2.2
5.2
24.0
General administrative and other
expenses
3.2
6.6
2.1
.7
4.0
Depreciation, depletion and
Amortization
25.4
26.5
20.6
28.1
26.2
Asset impairments
6.1
—–
—–
19.3
—–
Total costs and expenses
66.6
67.8
57.2
69.9
73.8
Results of operations before
income taxes
33.4
32.2
42.8
30.1
26.2
Provision for income taxes
18.1
12.4
21.2
21.1
17.1
Results of operations
15.3
19.8
21.6
9.0
9.1