Unlock document.
This document is partially blurred.
Unlock all pages and 1 million more documents.
Get Access
400
CASE 11-5 BOOKS UNLIMITED (Part 2)
(This case provides the opportunity to review Borders Group, Inc. per the 10-K for the
fiscal year ended January 29, 2011.)
This comment is included in Note 1:
On February 16, 2011 (the “Petition Date”), Borders Group, Inc., Borders, Inc. and
certain of our subsidiaries (collectively, the “Debtors”) filed voluntary petitions for relief
under Chapter 11 of the United States Code (the “Bankruptcy Code”) in the United
in the Chapter 11 Cases.
The Chapter 11 Cases were filed in response to an environment of curtailed customer
spending, increasing industry competition and an anticipated lack of sufficient liquidity,
Section 363 of the Bankruptcy Code or seek confirmation of a Chapter 11 plan
providing for such a sale or other arrangement, including liquidation. Confirmation of a
Chapter 11 plan or other arrangement could materially alter the classifications and
amounts reported in our consolidated financial statements, which do not give effect to
On February 16, 2011, the New York Stock Exchange (the “NYSE”) suspended trading
in our common stock following our announcement of the commencement of the
401
a.
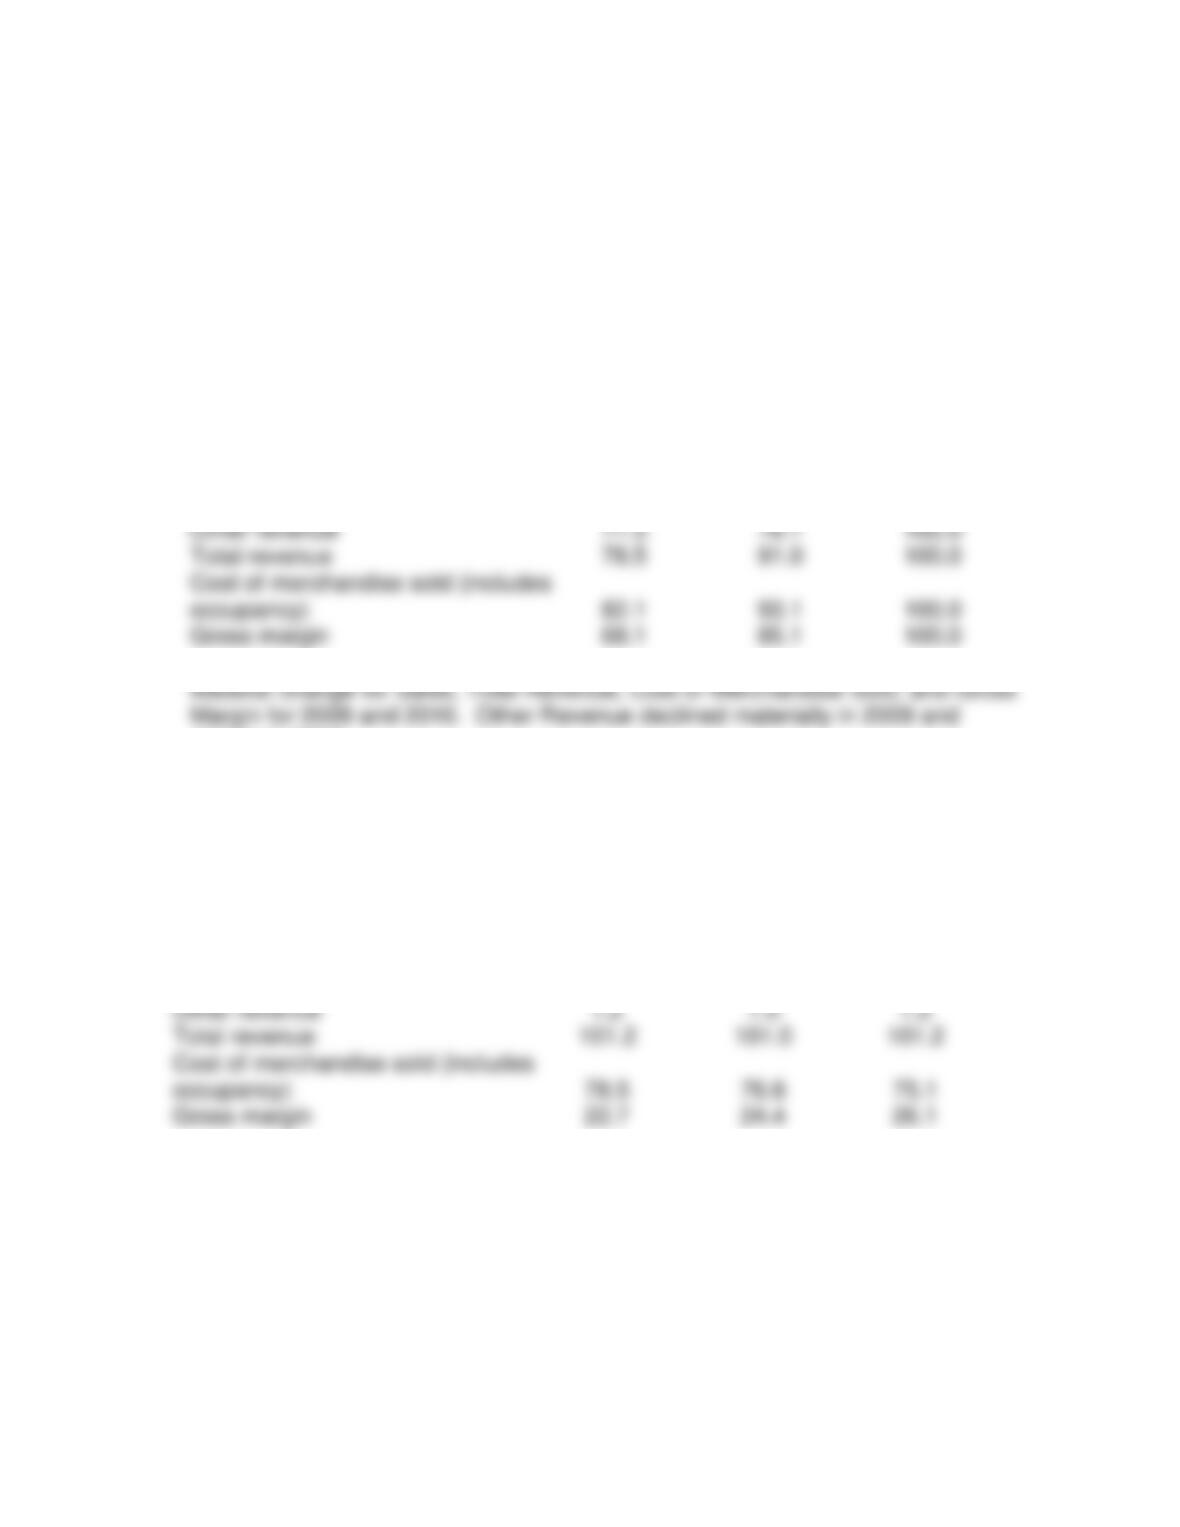
Horizontal Common-Size Analysis
Consolidated Statements of Operations (In Part)
Jan. 30,
2010
Jan. 31,
2009
Feb. 2,
2008
Sales
78.5
91.2
100.0
Other revenue
77.5
78.7
100.0
Total revenue
78.5
91.0
100.0
Cost of merchandise sold (includes
occupancy)
82.1
93.1
100.0
Gross margin
68.1
85.1
100.0
slightly in 2010.
b.
Vertical Common-Size Analysis
Consolidated Statements of Operations (In Part)
Jan. 30,
2010
Jan. 31,
2009
Feb. 2,
2008
Sales
100.0
100.0
100.0
Other revenue
1.2
1.0
1.2
Total revenue
101.2
101.0
101.2
Cost of merchandise sold (includes
occupancy)
78.5
76.6
75.1
Gross margin
22.7
24.4
26.1
Cost of Merchandise Sold Increased slightly in 2009 and 2010. This resulted in a
substantial decrease in gross margin for 2009 and 2010.
402
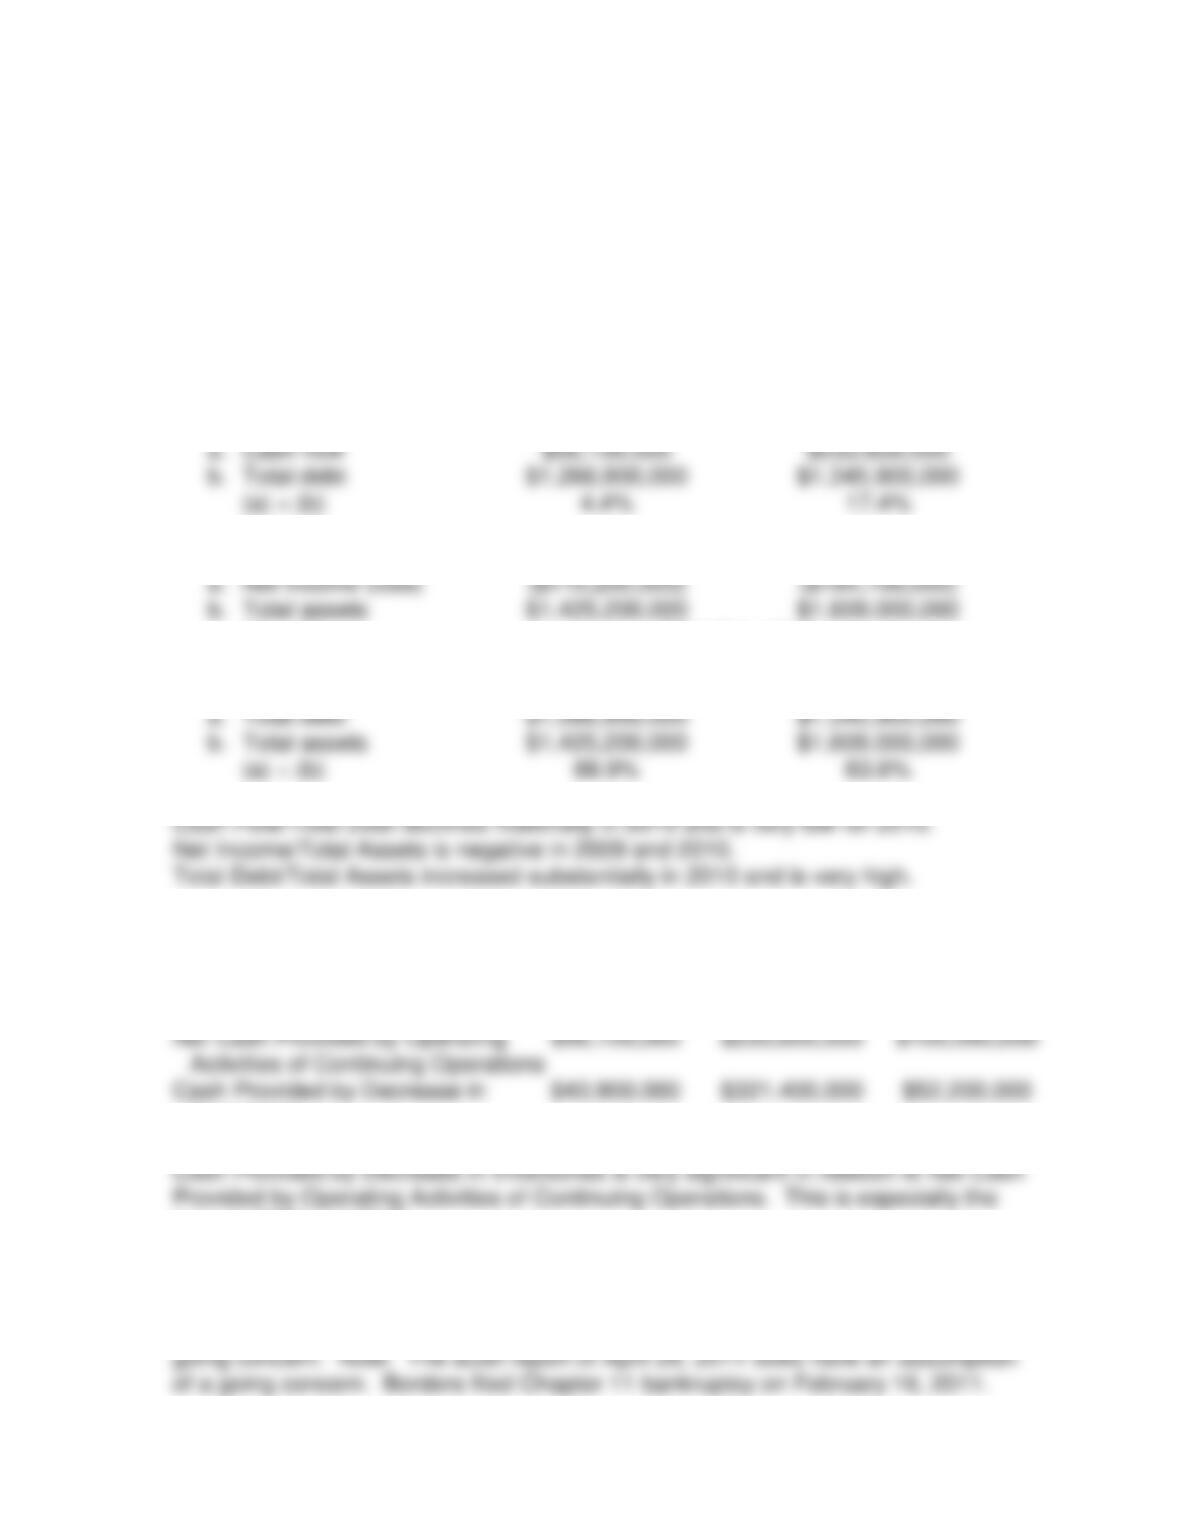
c.
Jan. 30,
2010
Jan. 31,
2009
1. Cash flow/total debt
a. Cash flow
$56,100,000
$233,600,000
b. Total debt
$1,266,900,000
$1,345,900,000
(a) ÷ (b)
4.4%
17.4%
2. Net income/total assets
a. Net income (loss)
($110,200,000)
($184,700,000)
b. Total assets
$1,425,200,000
$1,609,000,000
(a) ÷ (b)
Negative return
3. Total debt/total assets
a. Total debt
$1,266,900,000
$1,345,900,000
b. Total assets
$1,425,200,000
$1,609,000,000
(a) ÷ (b)
88.9%
83.6%
d.
Jan. 30,
2010
Jan. 31,
2009
Feb. 2,
2008
Net Cash Provided by Operating
Activities of Continuing Operations
$56,100,000
$233,600,000
$105,000,000
Cash Provided by Decrease in
Inventories
$43,900,000
$321,400,000
$52,200,000
case in 2009 and 2010.
e. Borders had losses in 2009 and 2010 that were carried back to prior profit years.
f. In general, a standard audit report. There is no indication of an assumption of a
403
CASE 11-5 VALUE NIKE
(This case represents an opportunity to value Nike.)
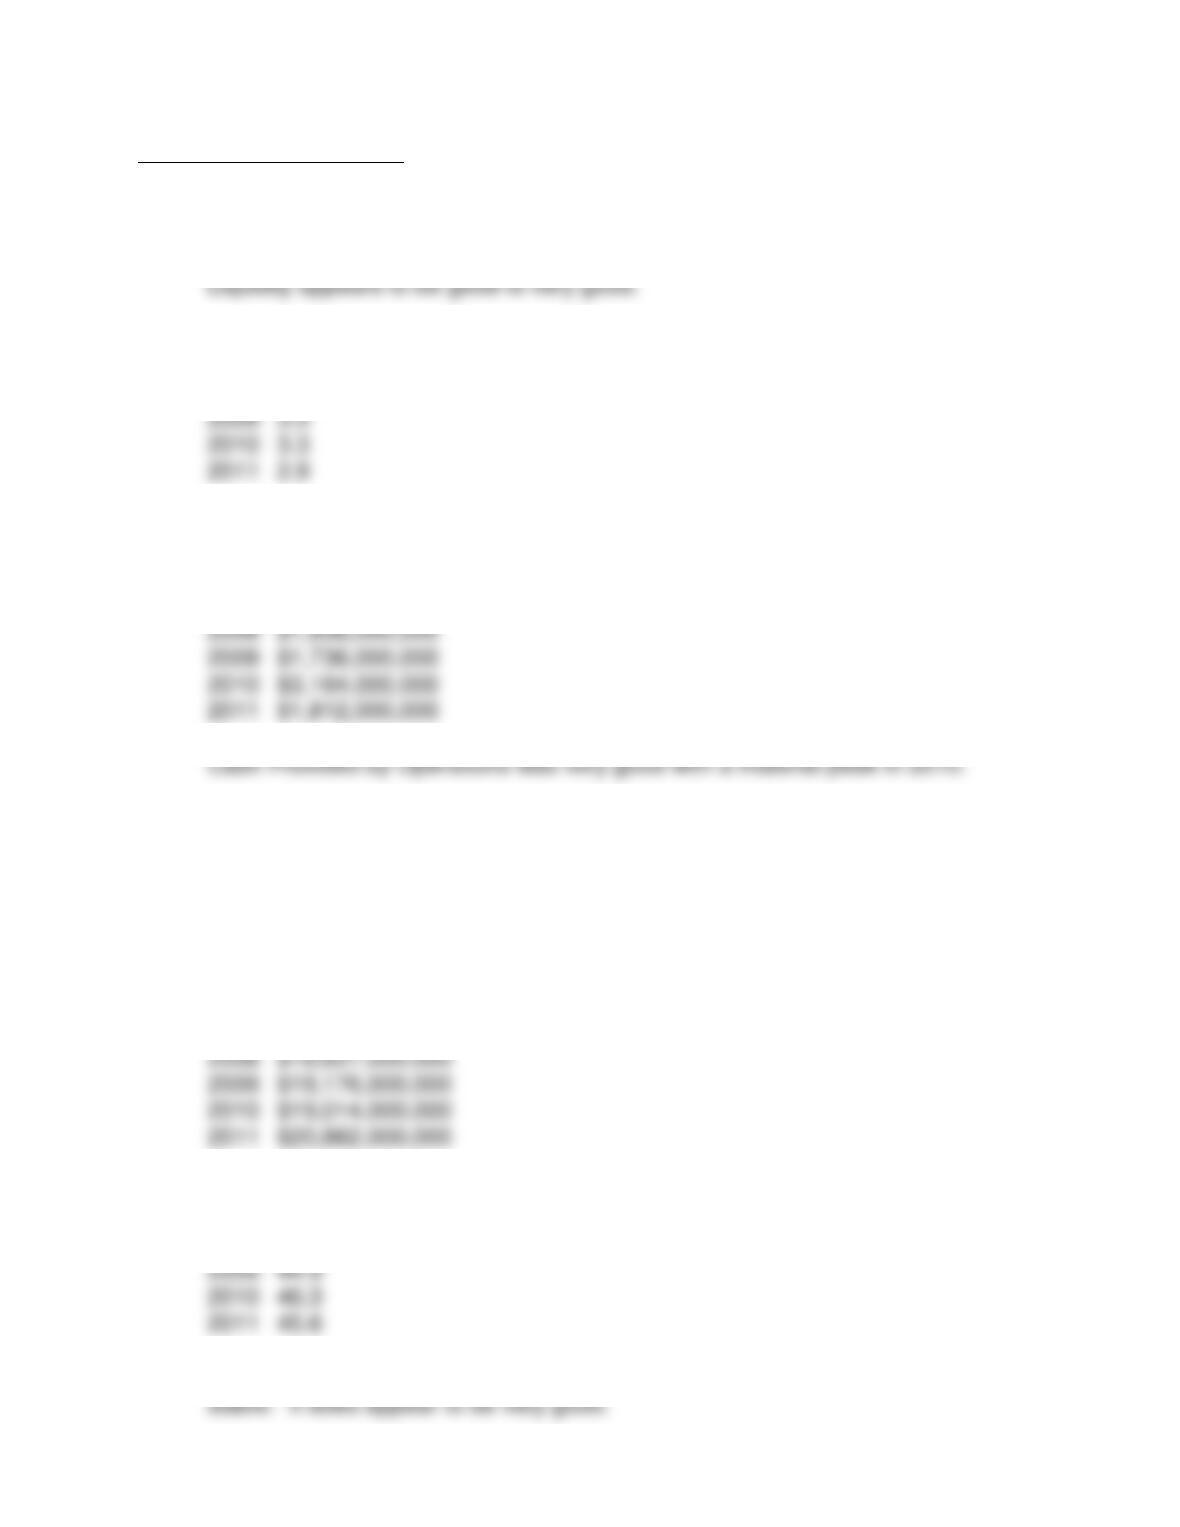
a. 1. Per summary-liquidity – (2009 – 2011)
2. Current Ratio
2007 3.1
2008 2.7
Current Ratio is very good
3. Cash Provided by Operations
2007 $1,879,000,000
b. Long-Term Debt-Paying Ability
1. The Long-Term Debt-Paying Ability was very good.
2. The Debt Ratio was very good in all three years.
c. Profitability
1. Profitability was very good
2. Trend in Revenues (2007 – 2011)
2007 $16,326,000,000
3. Trend in Gross Profit Margin
2007 43.9
2008 45.0
No particular trend in gross profit margin. The gross margin appears to be very
404
d. Investor Analysis
1. Price/Earnings Ratio
2007 19.4
2009 – 2011.
2. Trend in Market Capitalization
2007 $28,472,000,000
2008 $33,577,000,000
Market Capitalization increased materially between 2009 and 2011.
3. Cash Dividends Declared per Common Share 2007 - 2011
2007 0.71
2008 0.875
Yes. The Cash Dividends increased each year.
and 2013.
The Price/Earnings Ratio was very good and the gross margin % was very good.
It will be difficult to improve these indicators. Nike could increase its market price
by revenue increases.
Stock Price May 31, 2011
$84.45
Increase of 6% ($84.45 x 1.06) May 31, 2012
$89.52
Increase of 6% ($89.52 x 1.06) May 31, 2013
$94.89


