374
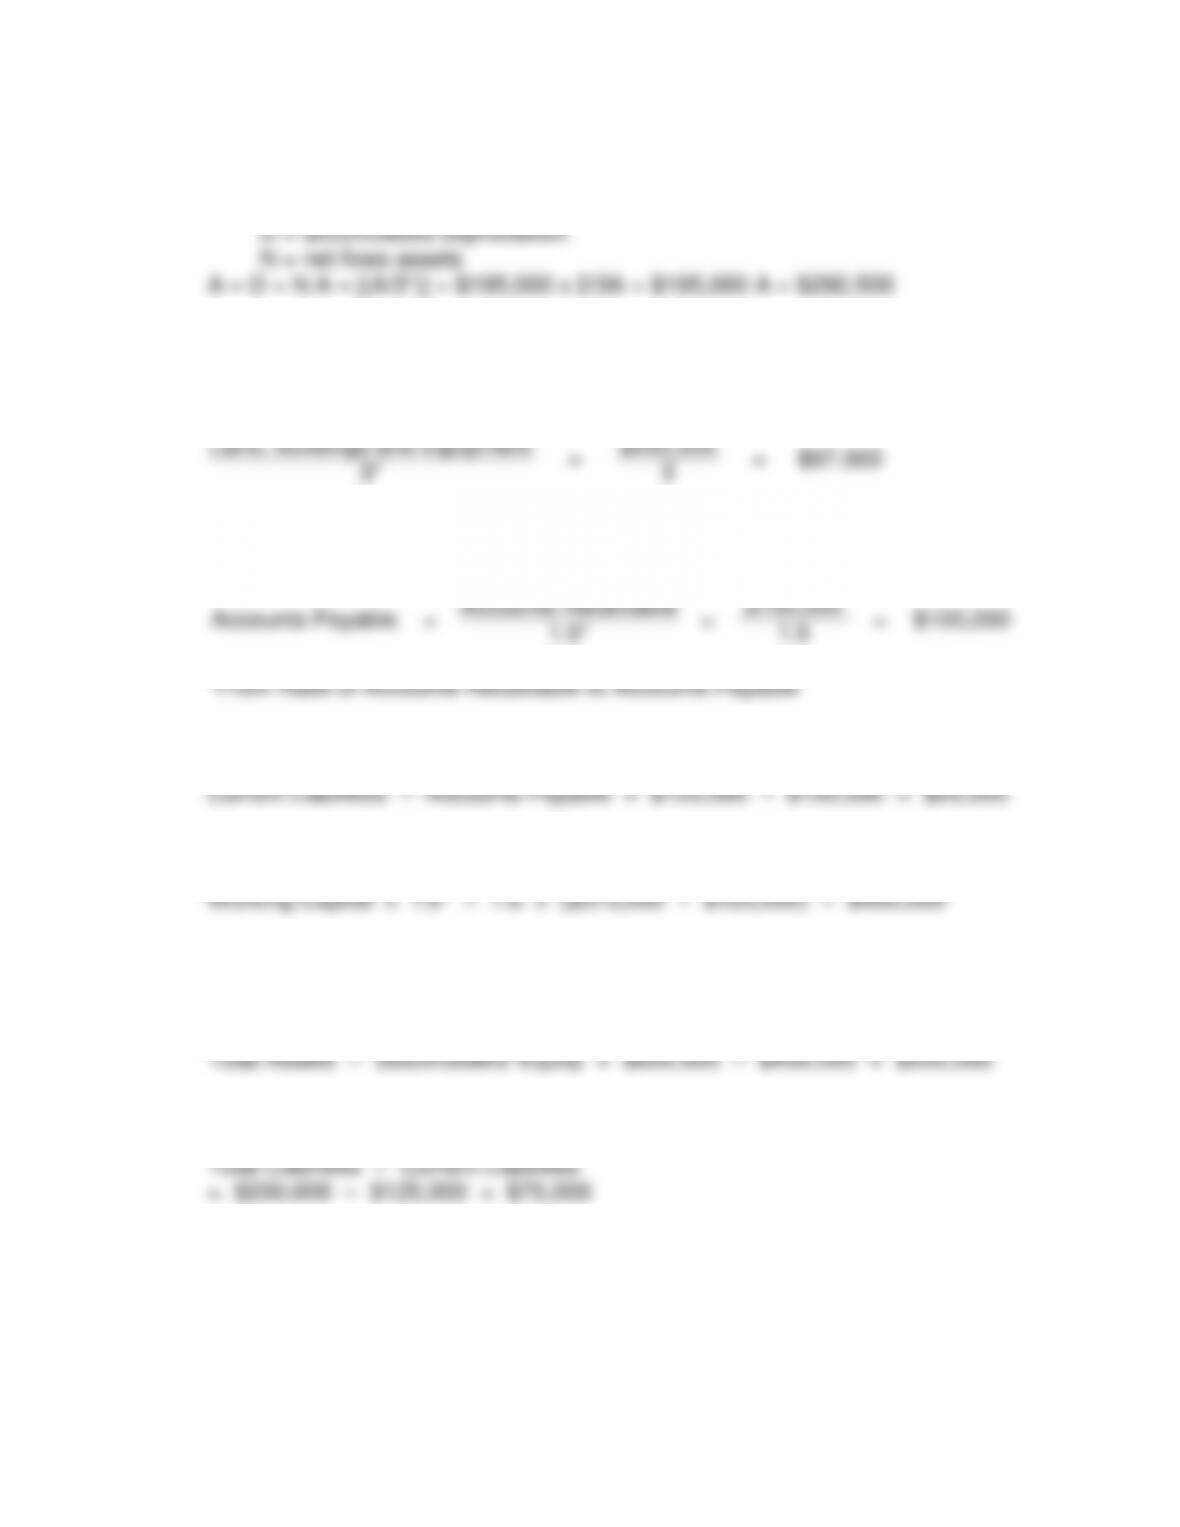
(15) Land, Buildings, and Equipment:
Let:
A = land, buildings, and equipment
D = accumulated depreciation
N = net fixes assets
A – D = N A – [(A/3*)] = $195,000 x 2/3A = $195,000 A = $292,500
*From Ratio of Depreciation to Cost
(16) Accumulated Depreciation:
Land, Buildings and Equipment
=
$292,500
=
$97,500
3*
3
*From Ratio of Depreciation to Cost
(17)
Accounts Payable
=
Accounts Receivable
=
$150,000
=
$100,000
1.5*
1.5
(18) Accrued Expenses Payable:
(19) Total Stockholders’ Equity:
*From Ratio of Working Capital to Stockholders’ Equity
(20) Total Liabilities:
(21) 5% Bonds Payable – Due 2017:
375
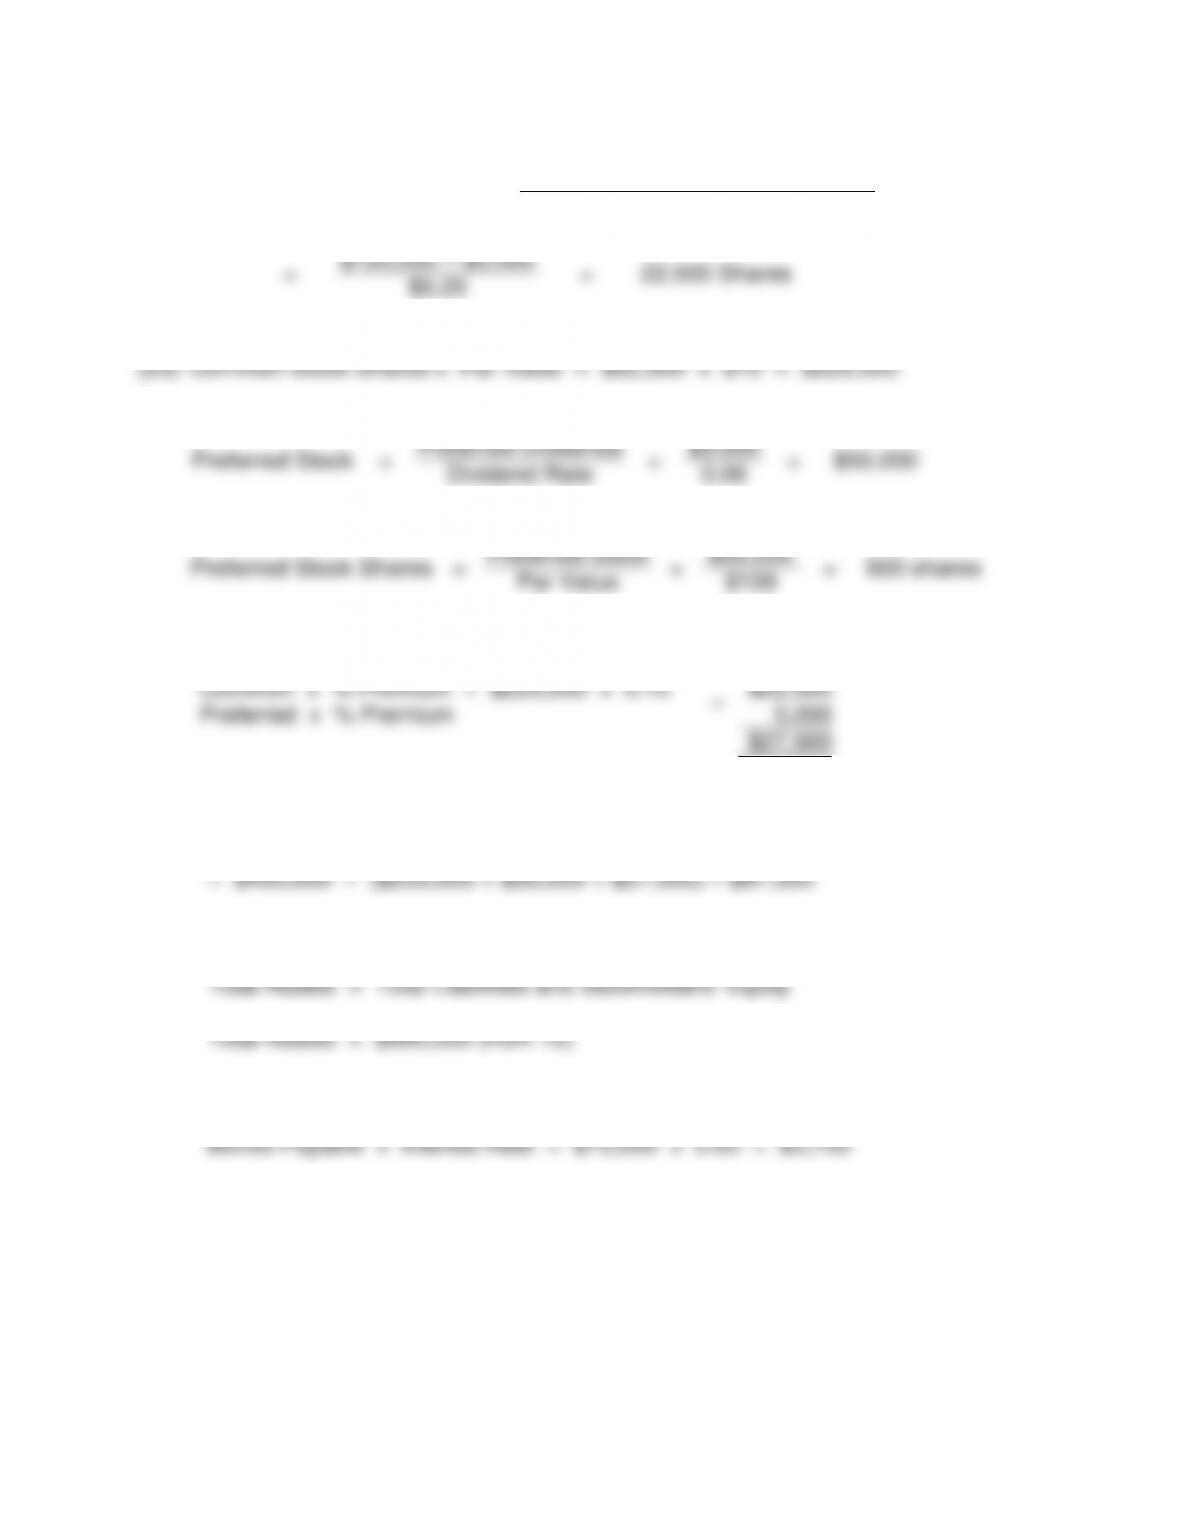
(22)
Common Stock Shares
=
Net Income – Preferred Dividends
Earnings Per Share
=
$120,000 – $3,000
=
22,500 Shares
$5.20
(24)
Preferred Stock
=
Preferred Dividends
=
$3,000
=
$50,000
Dividend Rate
0.06
(25)
Preferred Stock Shares
=
Preferred Stock
=
$50,000
=
500 shares
Par Value
$100
(26) Contributed Capital in Excess of Par Value:
Common x % Premium = $225,000 x 0.10
=
$22,500
Preferred x % Premium
5,000
$27,500
(27) Retained Earnings:
Stockholders’ Equity – (Common + Preferred + Premium)
(28) Total Liabilities and Stockholders’ Equity:
(29) Interest Expense:
376
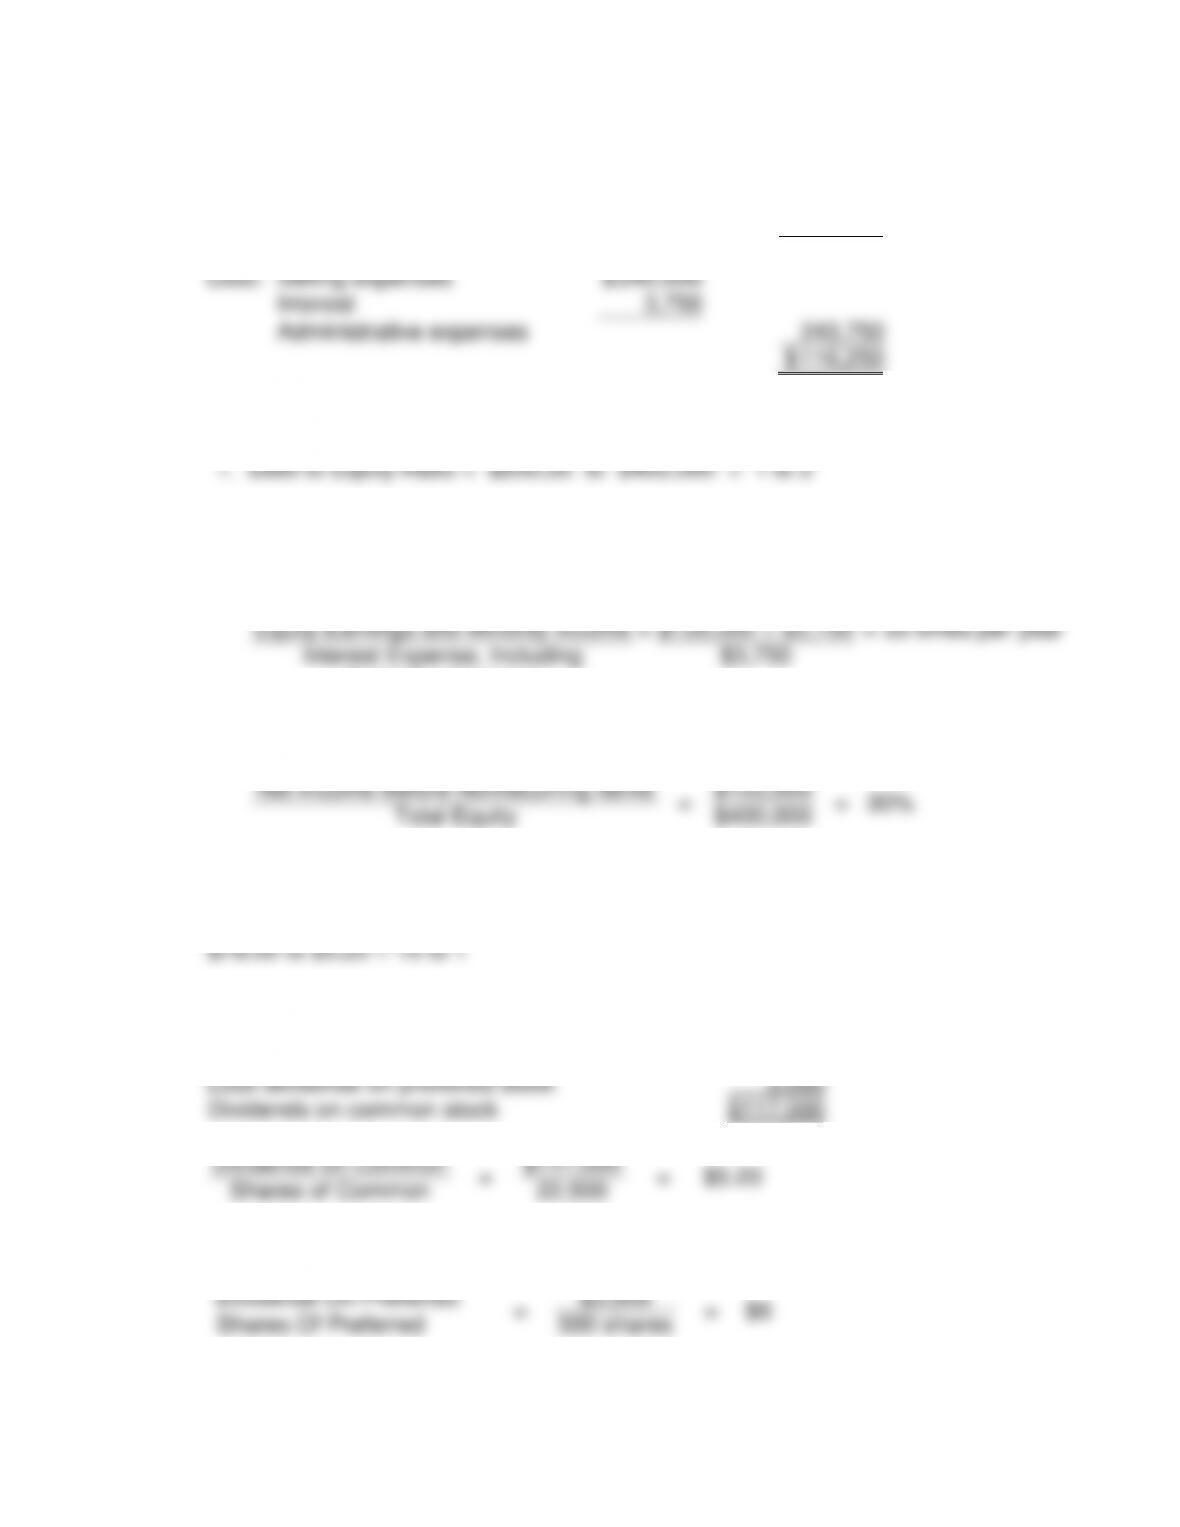
(30) Administrative Expenses:
Gross profit
$
480,000
Less net income
120,000
Total expenses
360,000
Less: Selling expenses
$
240,000
Interest
3,750
Administrative expenses
243,750
$
116,250
Proof statistics supplied:
2. Times Interest Earned =
Recurring Earnings, Excluding
Interest Expense, Tax Expense,
Equity Earnings and Minority Income
=
$120,000 + $3,750
=
33 times per year
Interest Expense, Including
Capitalized Interest
$3,750
b. 1. Rate of Return on Stockholders’ Equity:
Net Income Before Nonrecurring Items
=
$120,000
=
30%
Total Equity
$400,000
2. Price-Earnings Ratio for Common Stock:
Market Value Per Share to Earnings Per Share
3. Dividends Paid Per Share Of Common Stock:
Net income $120,000
Dividends on Common
=
$117,000
=
$5.20
Shares of Common
22,500
4. Dividends Paid Per Share of Preferred Stock:
Dividends On Preferred
=
$3,000
=
$6
Shares Of Preferred
500 shares
377
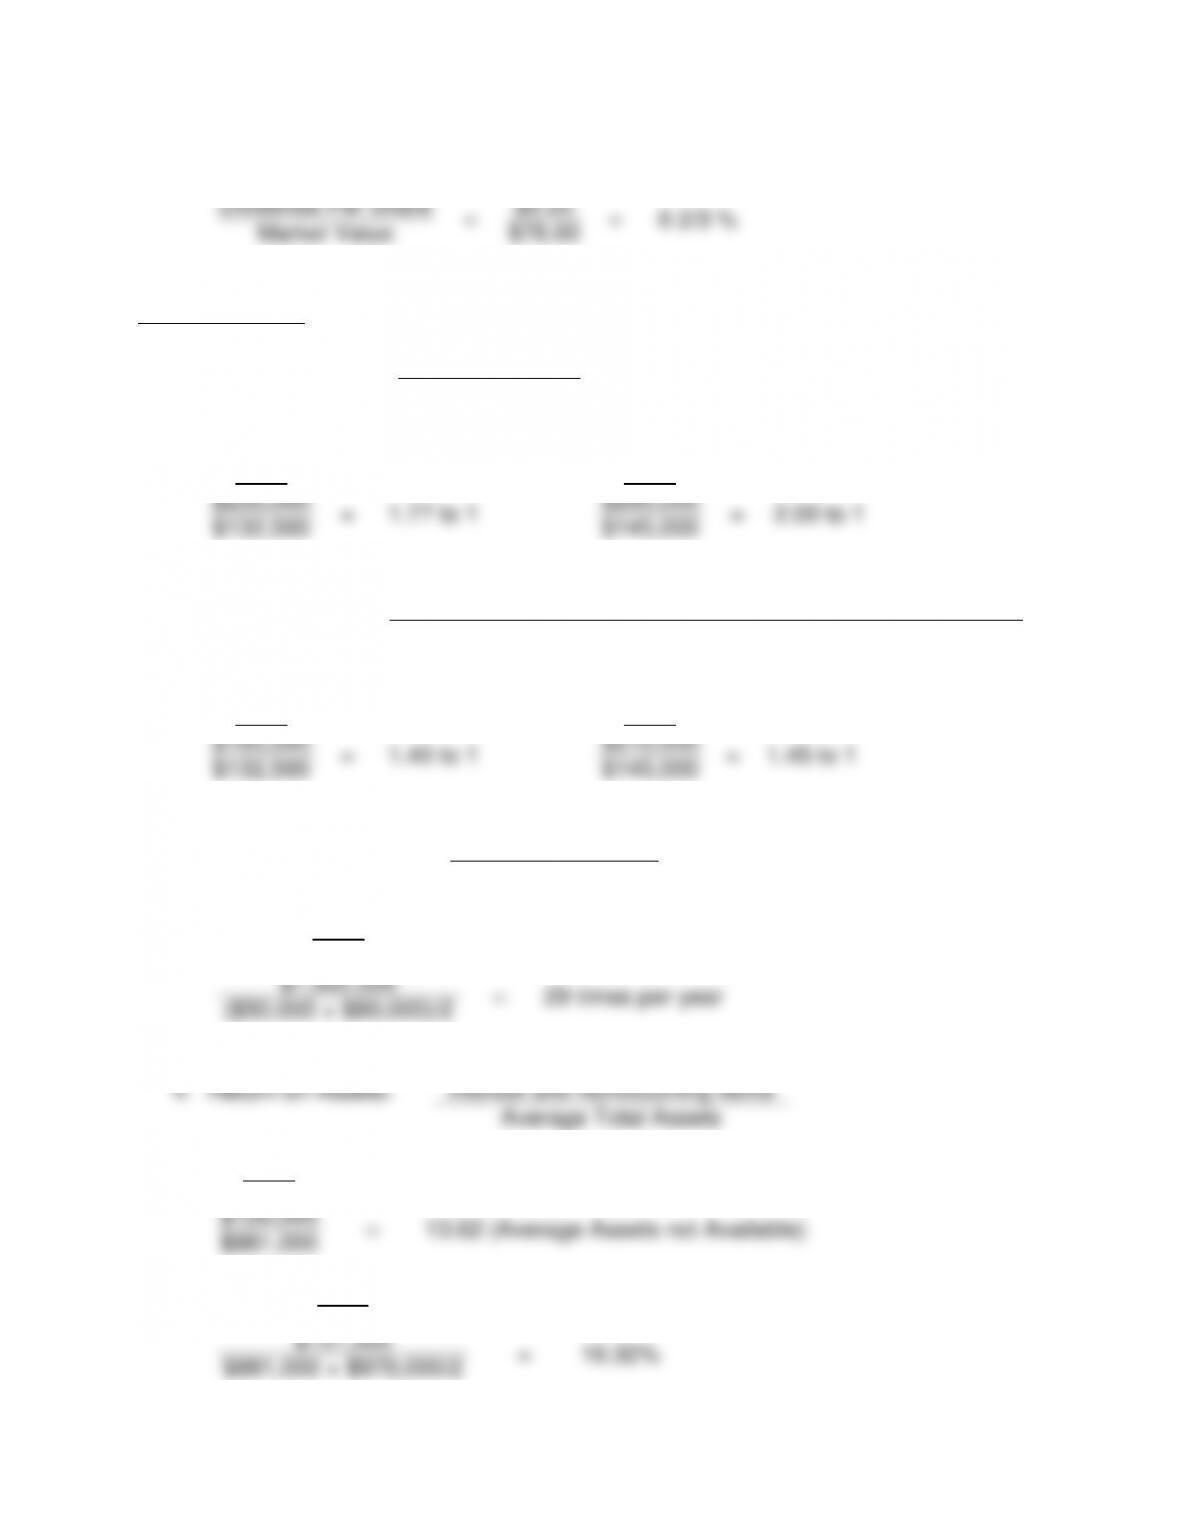
5. Yield on Common Stock:
Dividends Per Share
=
$5.20
=
6 2/3 %
Market Value
$78.00
PROBLEM 11-9
a.
1.
Current Ratio:
Current Assets
Current Liabilities
2010
2011
$235,000
=
1.77 to 1
$290,000
=
2.00 to 1
$132,500
$145,000
2.
Acid-Test Ratio:
Cash Equivalents & Marketable Securities & Net Receivables
Current Liabilities
2010
2011
$185,000
=
1.40 to 1
$210,000
=
1.45 to 1
$132,500
$145,000
3.
Inventory Turnover:
Cost of Goods Sold
Average Inventory
2011
$1,902,500
=
29 times per year
($50,000 + $80,000)/2
4.
Return on Assets:
Net Income Before Noncontrolling
Interest and Nonrecurring Items
Average Total Assets
2010
$120,000
=
13.62 (Average Assets not Available)
$881,000
2011
$151,000
=
16.32%
$881,000 + $970,000/2
378
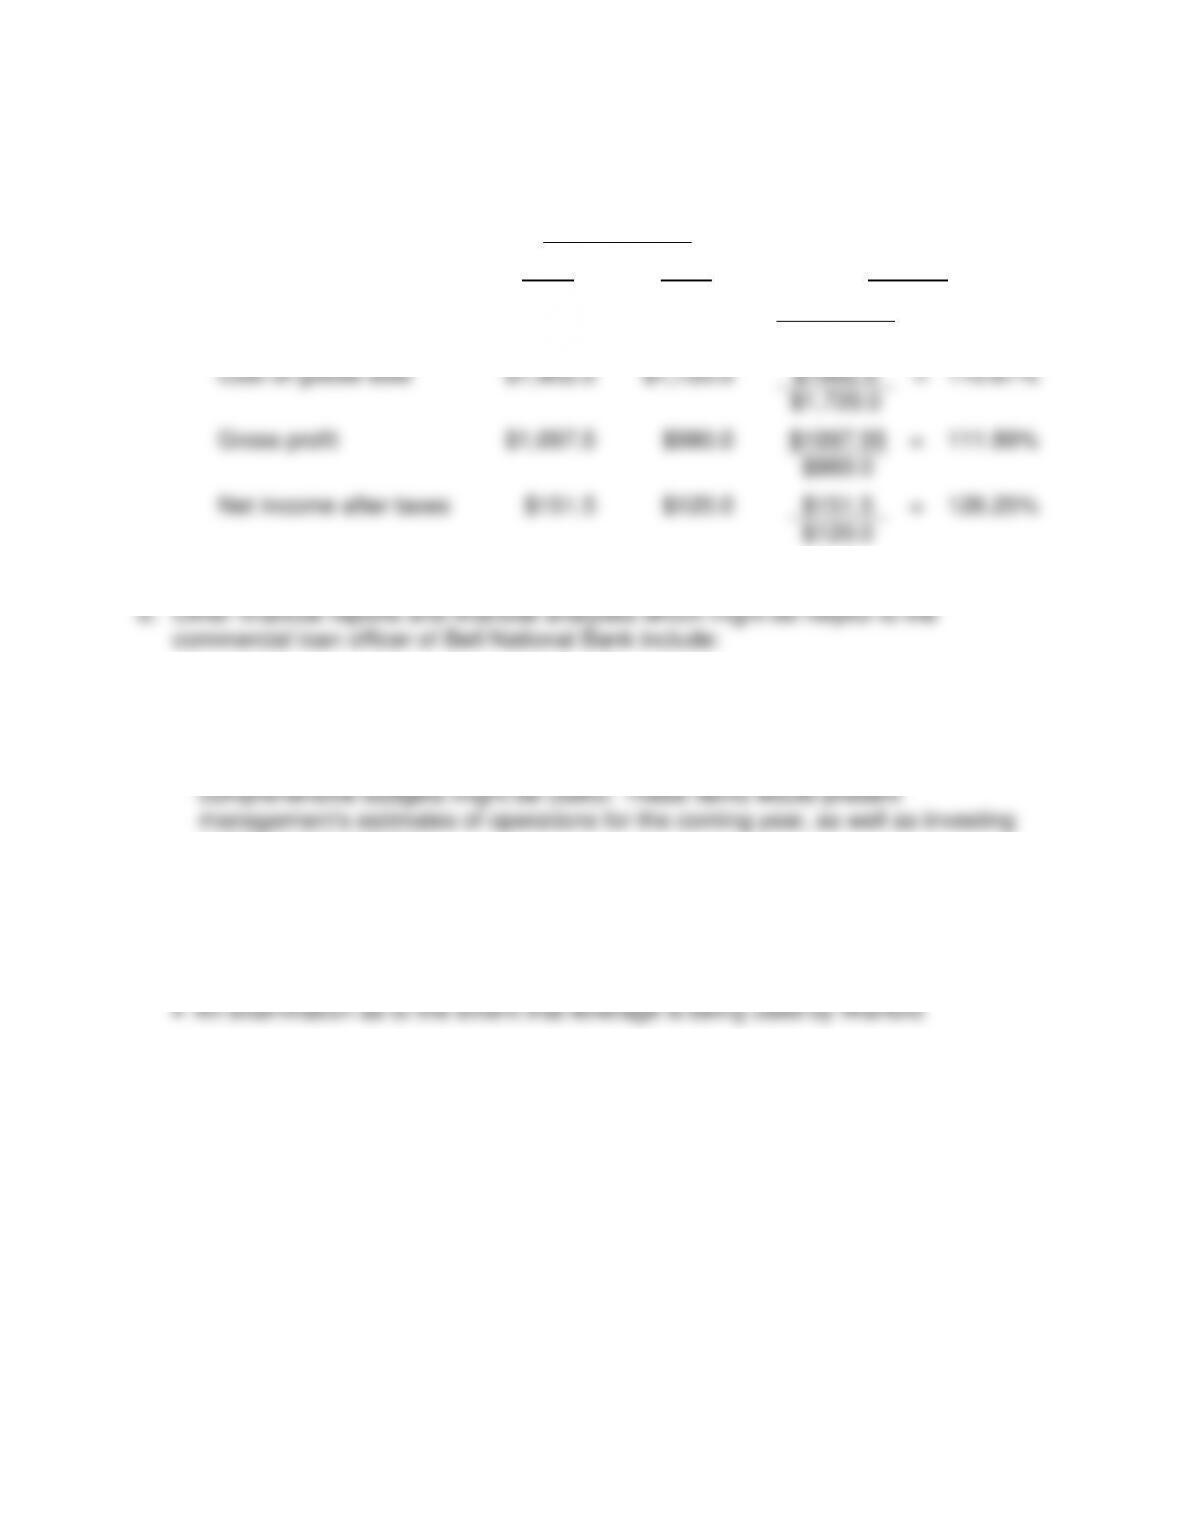
5. Percent Changes:
Amounts
(000s omitted)
2011
2010
Percent
Sales
$3,000.0
$2,700.0
$3000
=
111.11%
$2,700.0
Cost of goods sold
$1,902.5
$1,720.0
$1902.5
=
110.61%
$1,720.0
Gross profit
$1,097.5
$980.0
$1097.55
=
111.99%
$980.0
Net income after taxes
$151.5
$120.0
$151.5
=
126.25%
$120.0
Statement of cash flows would highlight the amount of cash flows from
operations, investing, and financing activities
Projected financial statements for 2012. In addition, a review of Warford’s
and financing activities.
A closer examination of Warford liquidity by calculating some additional ratios
such as days’ sales in receivables, accounts receivable turnover, and days’ sales
in inventory
379
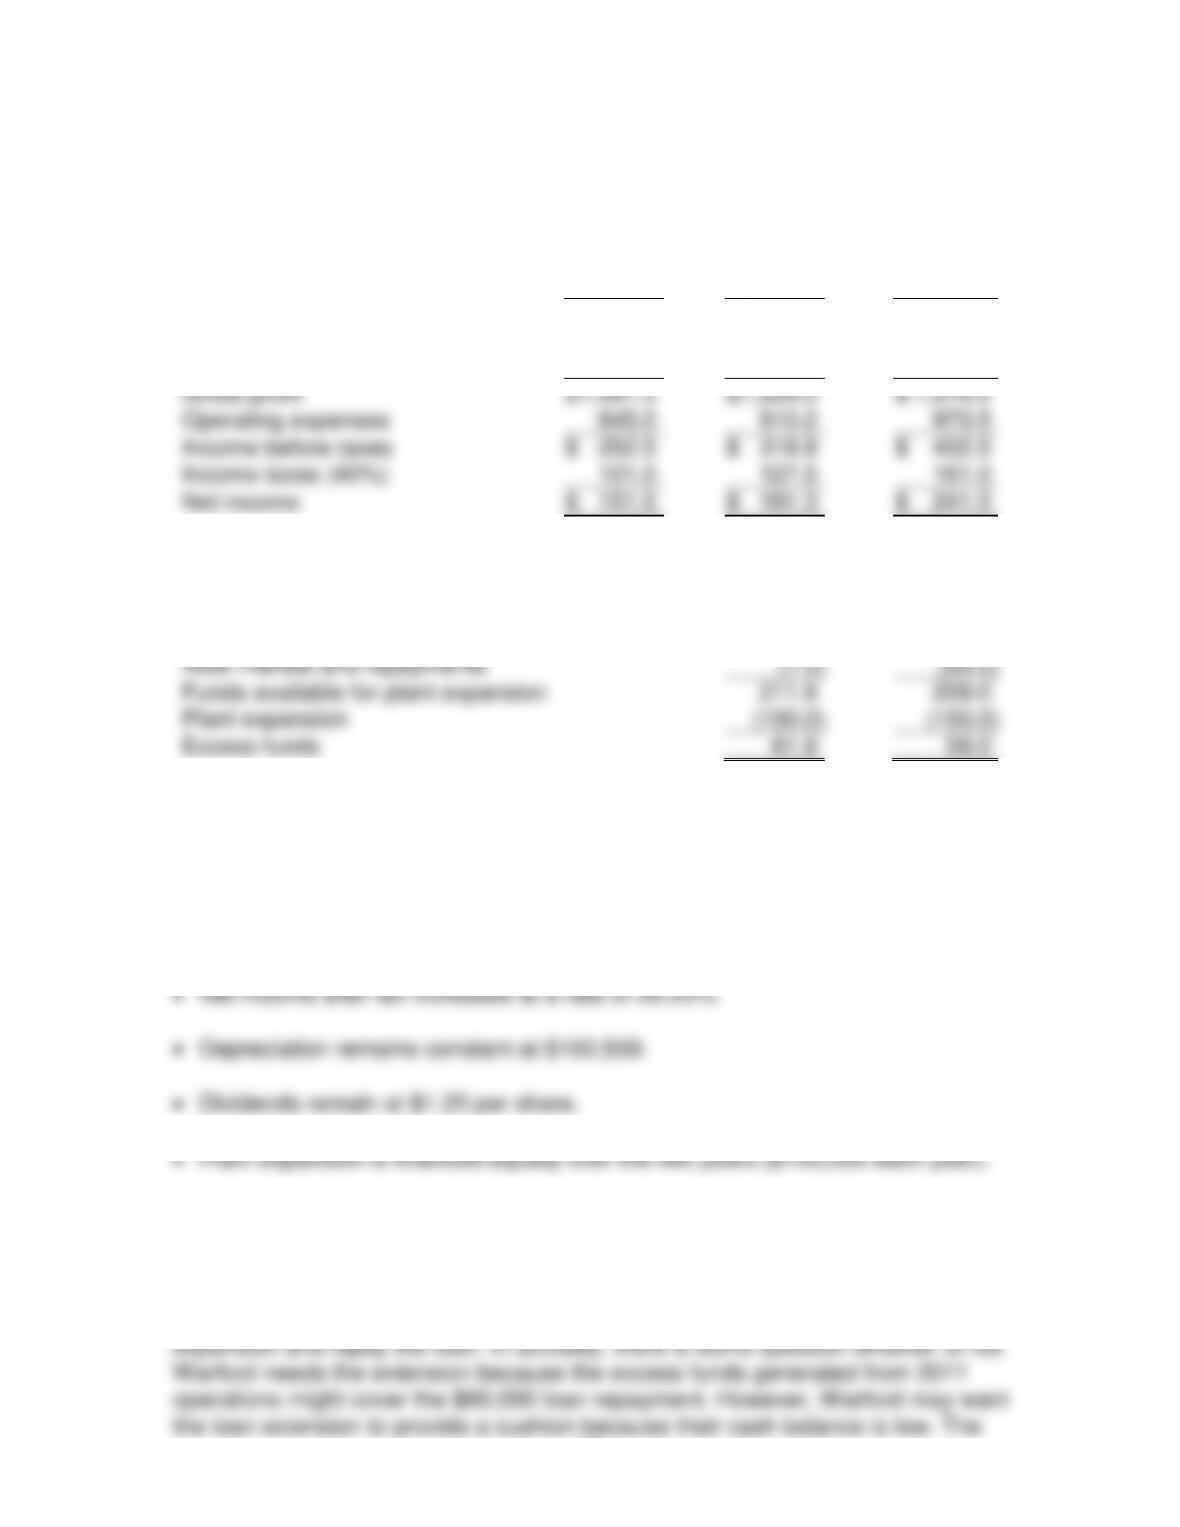
c. Warford Corporation should be able to finance the plant expansion from internally
generated funds as shown in the calculations presented below.
(000’s omitted)
2011
2012
2013
Sales
$
3,000.0
$
3,333.3
$
3,703.6
Cost of goods sold
1,902.5
2,104.3
2,327.6
Gross profit
$
1,097.5
$
1,229.0
$
1,376.0
Operating expenses
845.0
910.2
973.5
Income before taxes
$
252.5
$
318.8
$
402.5
Income taxes (40%)
101.0
127.5
161.0
Net income
$
151.5
$
191.3
$
241.5
Add:
Depreciation
102.5
102.5
Deduct:
Dividends
(75.0)
(75.0)
Note interest and repayments
(7.0)
(60.0)
Funds available for plant expansion
211.8
209.0
Plant expansion
(150.0)
(150.0)
Excess funds
61.8
59.0
Assumptions:
Sales increase at a rate of 11.1%.
Cost of goods sold increases at a rate of 10.6%.
Loan extension is granted.
d. Bell National Bank should probably grant the extension of the loan, if it is really
required, because the projected cash flows for 2012 and 2013 indicate that an
adequate amount of cash will be generated from operations to finance the plant
380
financial ratios indicate that Warford has a solid financial structure. If the bank
PROBLEM 11-10
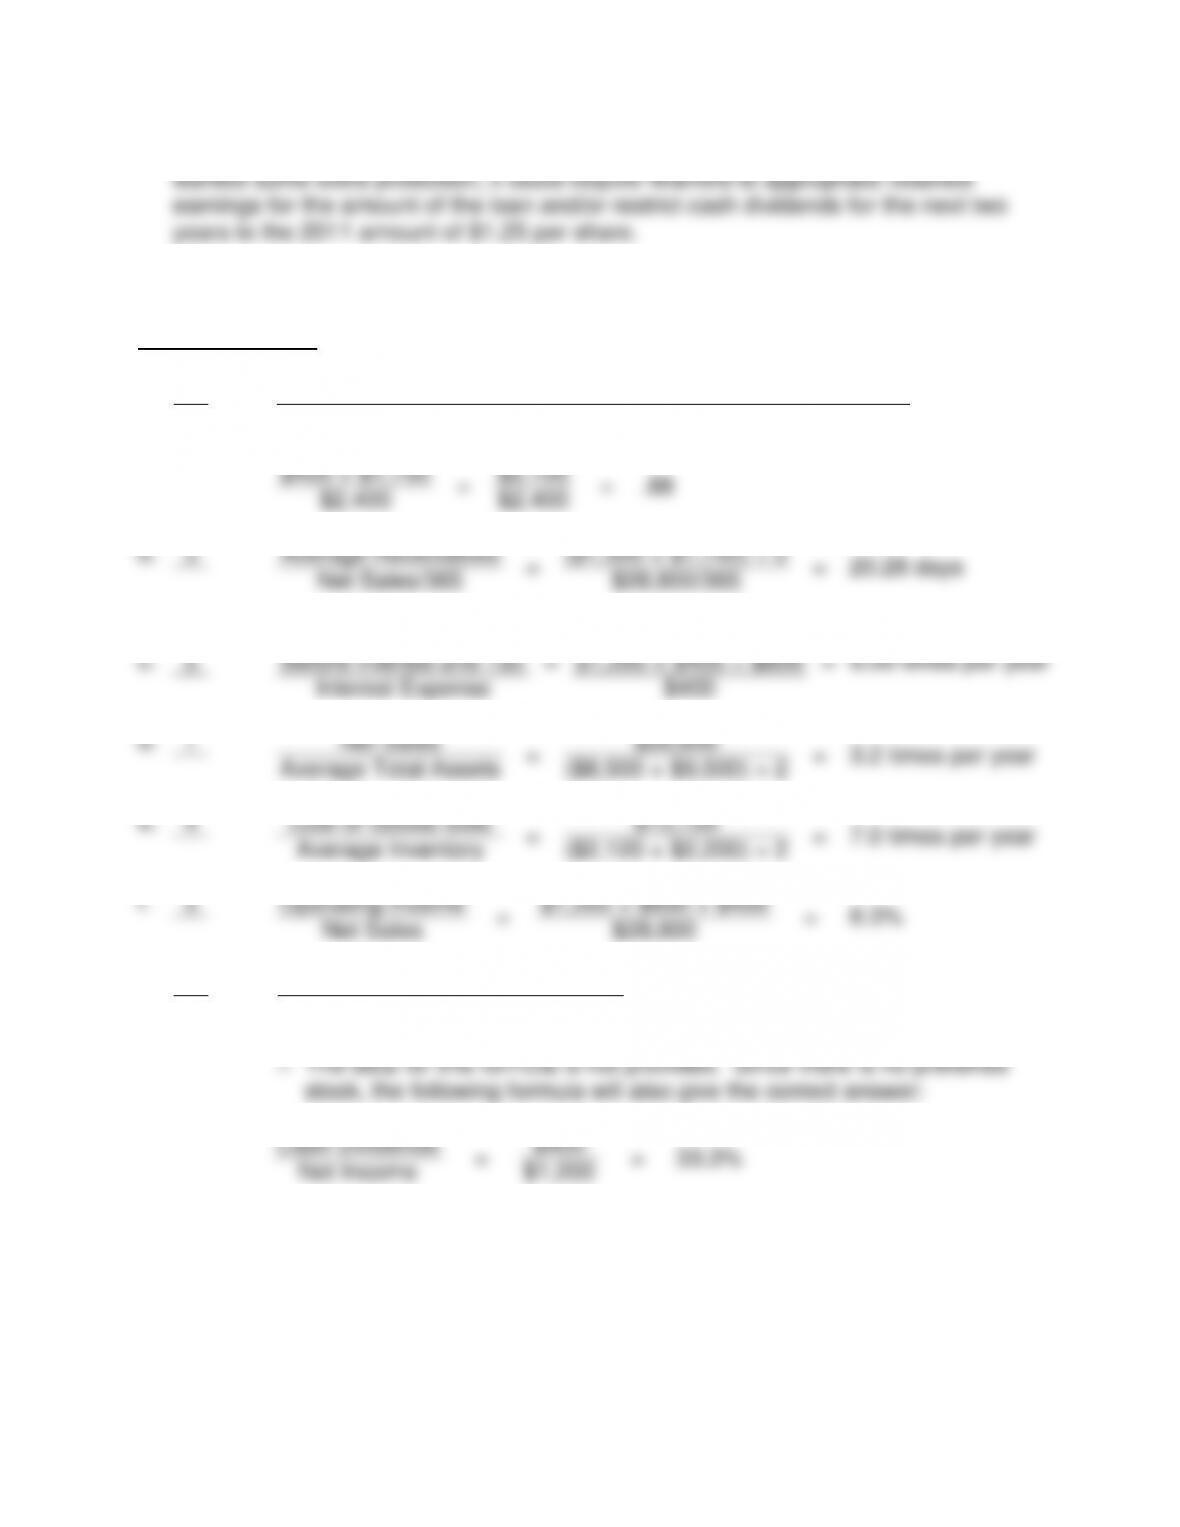
a.
2
Cash Equivalents + Marketable Securities + Net Receivables
Current Liabilities
$400 + $1,700
=
$2,100
=
.88
$2,400
$2,400
b.
3
Average Receivables
=
($1,500 + $1,700) ÷ 2
=
20.28 days
Net Sales/365
$28,800/365
c.
5
Recurring Earnings
Before Interest and Tax
=
$1,200 + $400 + $800
=
6.00 times per year
Interest Expense
$400
d.
1
Net Sales
=
$28,800
=
3.2 times per year
Average Total Assets
($8,500 + $9,500) ÷ 2
e.
4
Cost of Goods Sold
=
$15,120
=
7.0 times per year
Average Inventory
($2,120 + $2,200) ÷ 2
f.
5
Operating Income
=
$1,200 + $800 + $400
=
8.3%
Net Sales
$28,800
g.
5
Dividends Per Share
Fully Diluted Earnings Per Share
Cash Dividends
=
$400
=
33.3%
Net Income
$1,200
381
PROBLEM 11-11
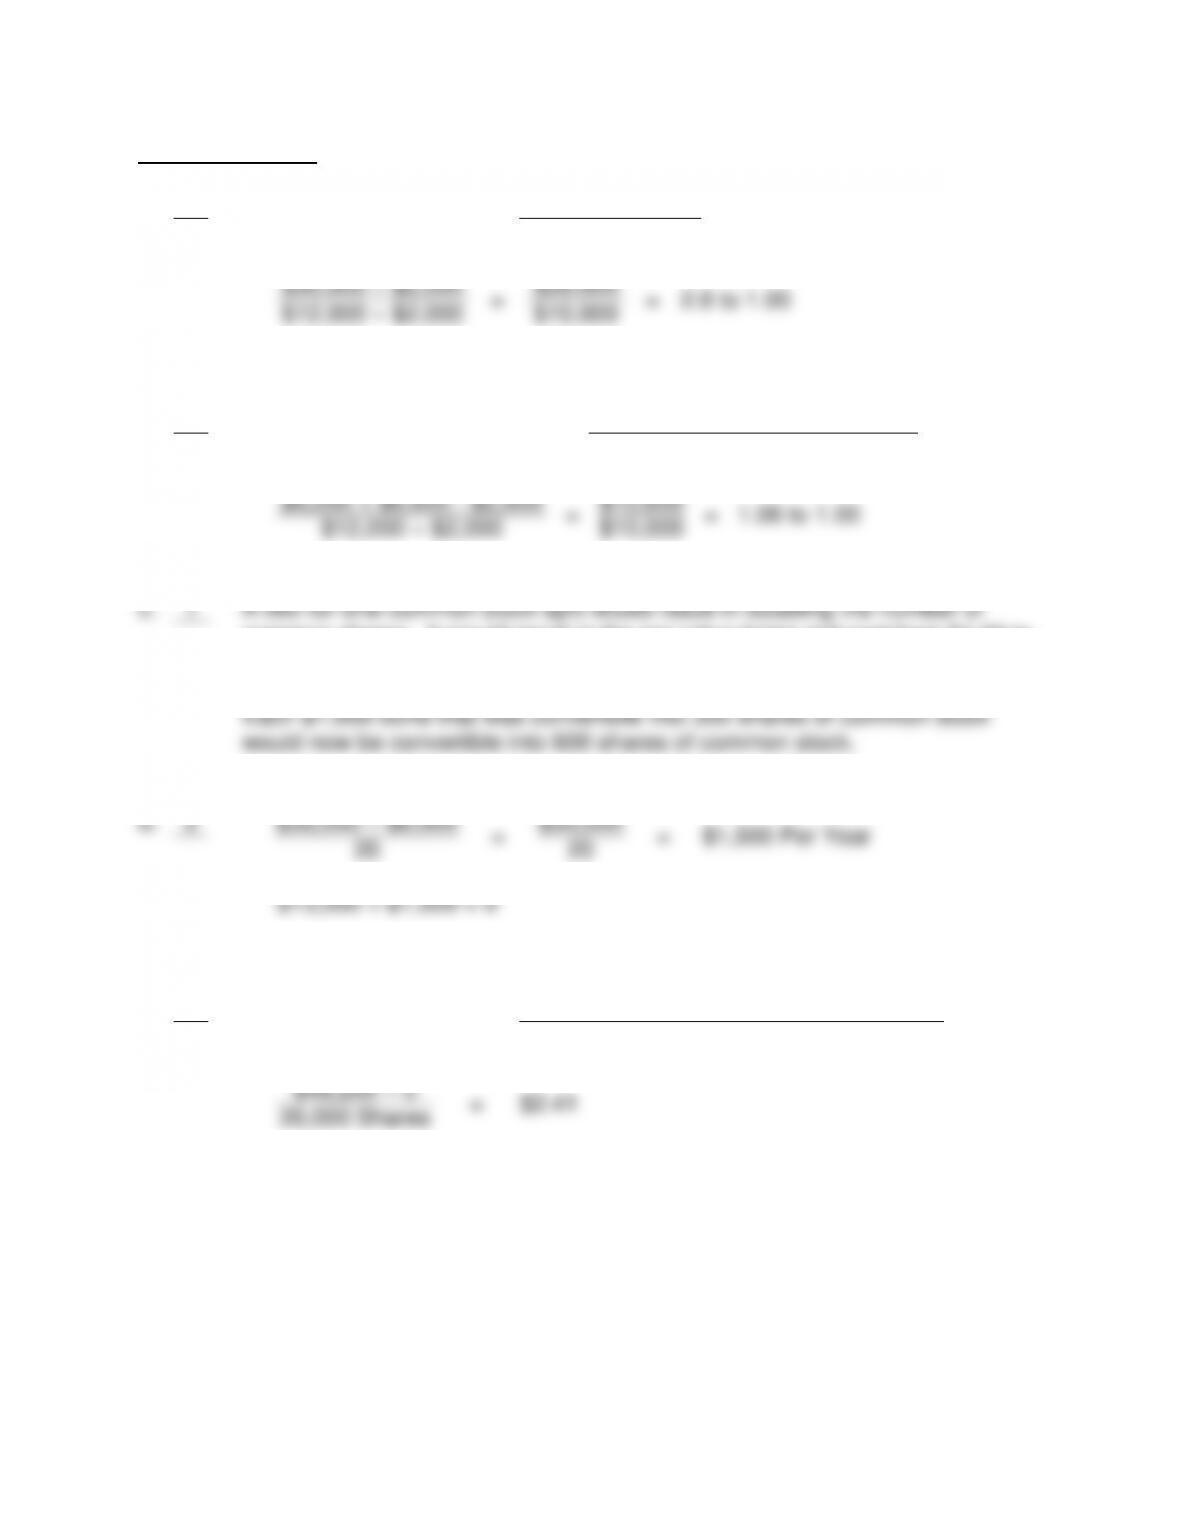
a.
2
Current Ratio
=
Current Assets
Current Liabilities
$30,000 – $2,000
=
$28,000
=
2.8 to 1.00
$12,000 – $2,000
$10,000
b.
1
Quick (Acid-Test) Ratio
=
Cash Equivalents + Marketable
Securities + Net Receivables
Current Liabilities
$6,000 + $6,600 – $2,000
=
$10,600
=
1.06 to 1.00
$12,000 – $2,000
$10,000
c.
1
A two-for-one common stock split would result in doubling the number of
common shares. It would result in the par value being reduced from $1.00 to
50¢. It would not influence retained earnings or total stockholders’ equity.
Each $1,000 bond that was convertible into 300 shares of common stock
would now be convertible into 600 shares of common stock.
d.
3
$36,000 – $6,000
=
$30,000
=
$1,500 Per Year
20
20
e.
4
Book Value
=
Total Stockholders’ Equity
– Preferred Stock Equity
Number of Common Shares Outstanding
$48,200 – 0
=
$2.41
20,000 Shares
382
f. 2 Sales $90,000,000
Gross profit 20 percent
Cost of goods sold 80 percent
Cost of goods sold $72,000,000
Divided by turnover 5
g. 3 Payout ratio of 80 percent (this is,80 percent of net income is being paid out in
dividends):
Retained earnings, November 30, 2011 $16,000
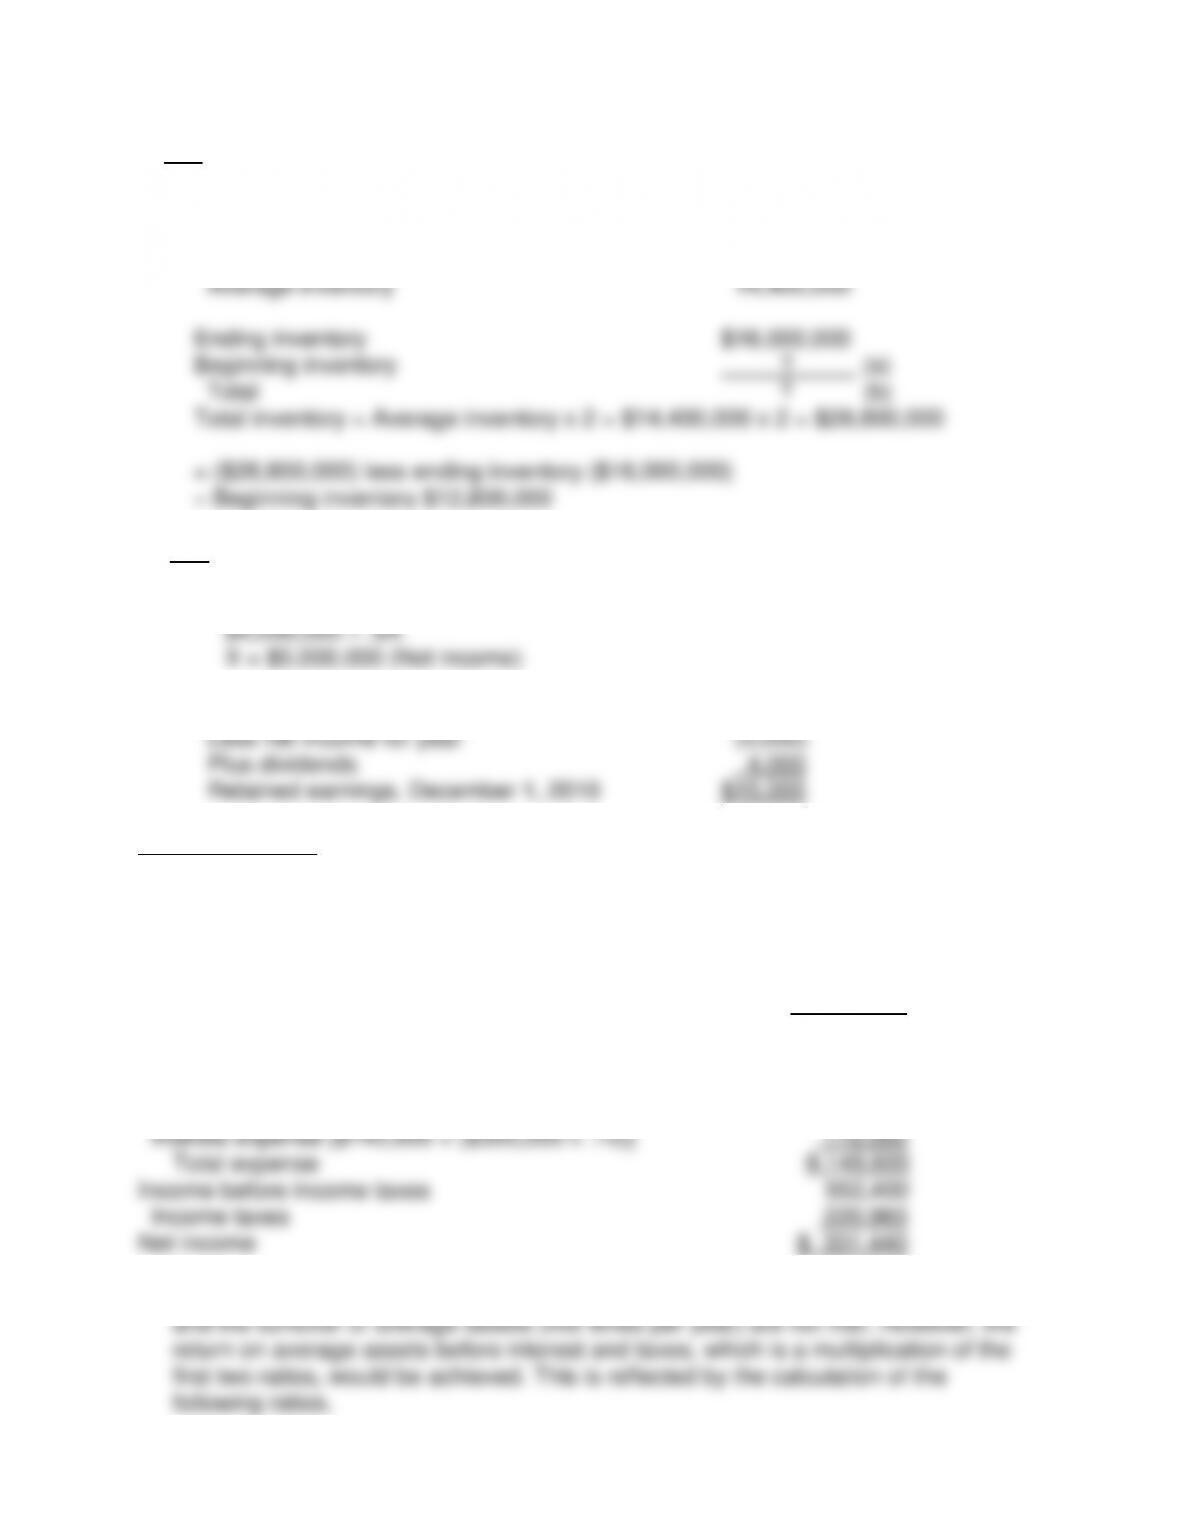
PROBLEM 11-12
a. Calcor Company
Pro Forma Income Statement
For the Year Ending November 30, 2012
Net sales ($8,400,000 x 1.05 x 1.10) $9,702,000
Expenses:
Cost of goods sold ($6,300,000 x 1.05 x 1.04) 6,879,600
Selling expense ($780,000 + $420,000) 1,200,000
Administrative expense 900,000
b. President Kuhn‘s entire goal is not achieved because the return on sales (8 percent)
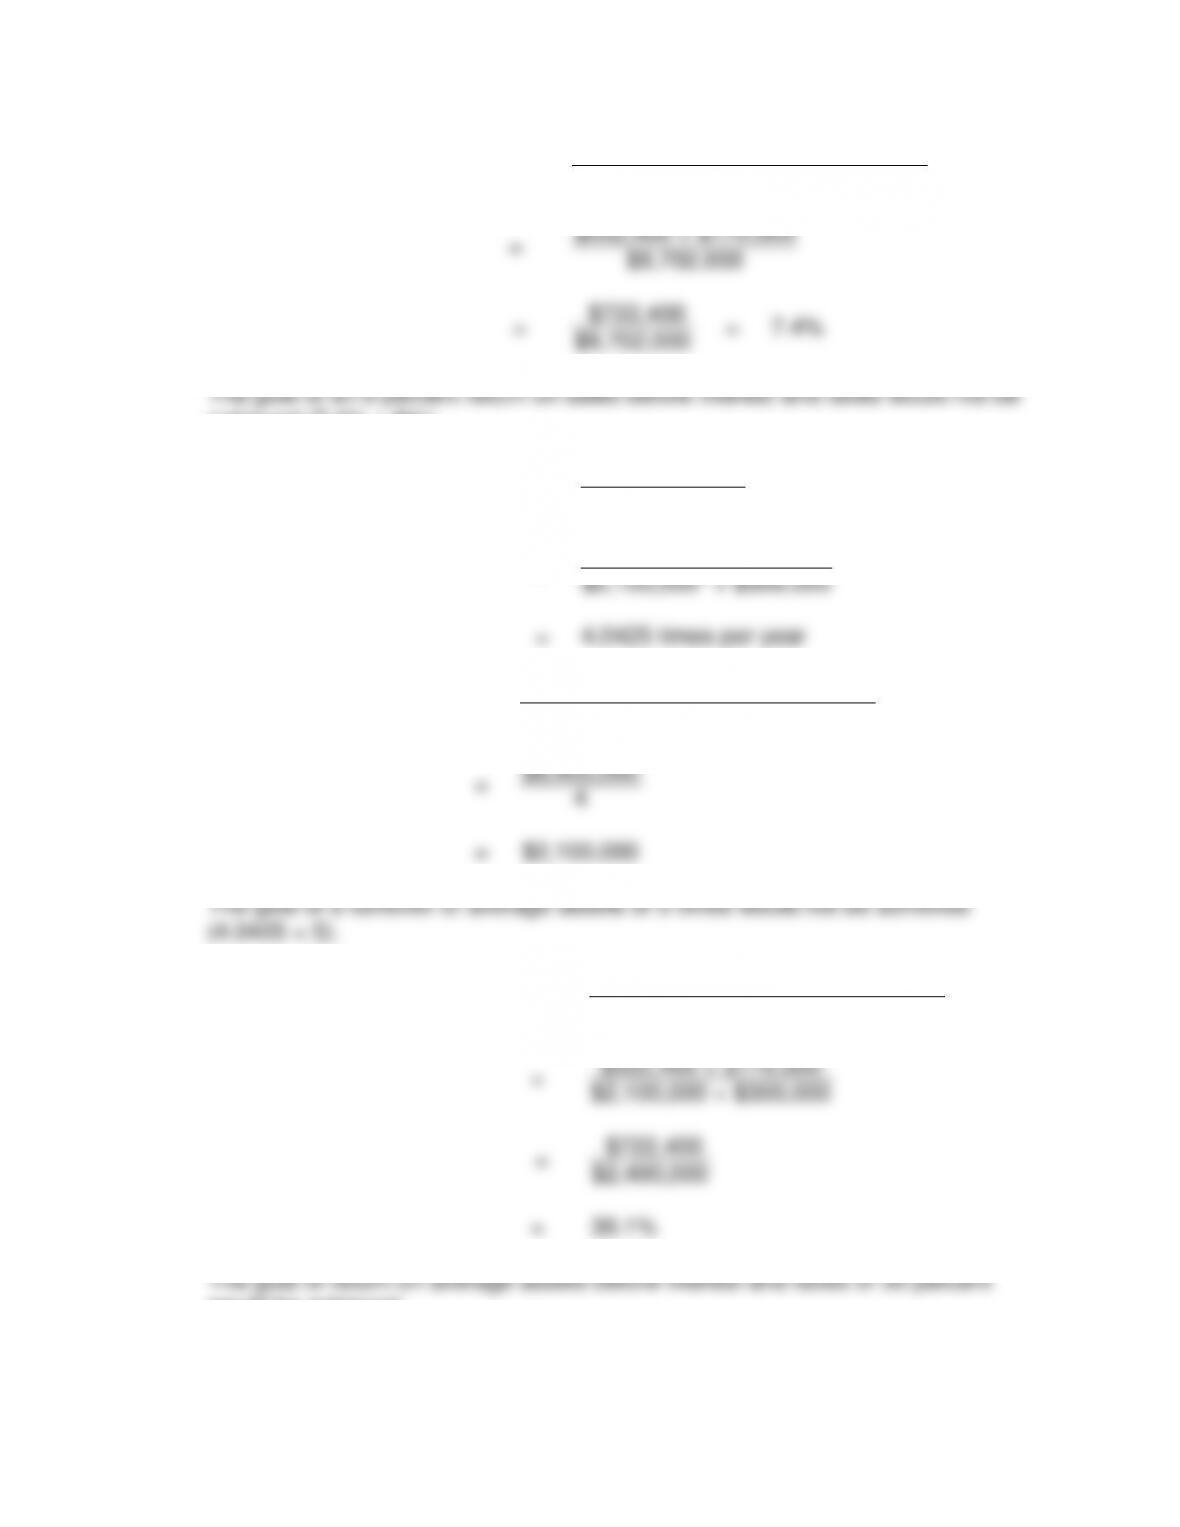
1.
Return on Sales Before
Interest and Taxes
=
Income Before Interest and Taxes
Sales
=
$552,400 + $170,000
$9,702,000
=
$722,400
=
7.4%
$9,702,000
achieved (7.4% < 8%).
2.
Turnover of Average Assets
=
Sales
Average Assets
=
$9,702,000
$2,100,000* + $300,000
*2008 Average Assets
=
$8,400,000
$2,100,000
3.
Income Before Interest and Taxes
=
$722,400
$2,400,000
30.1%