341
CASE 10-4 THE RETAIL MOVER
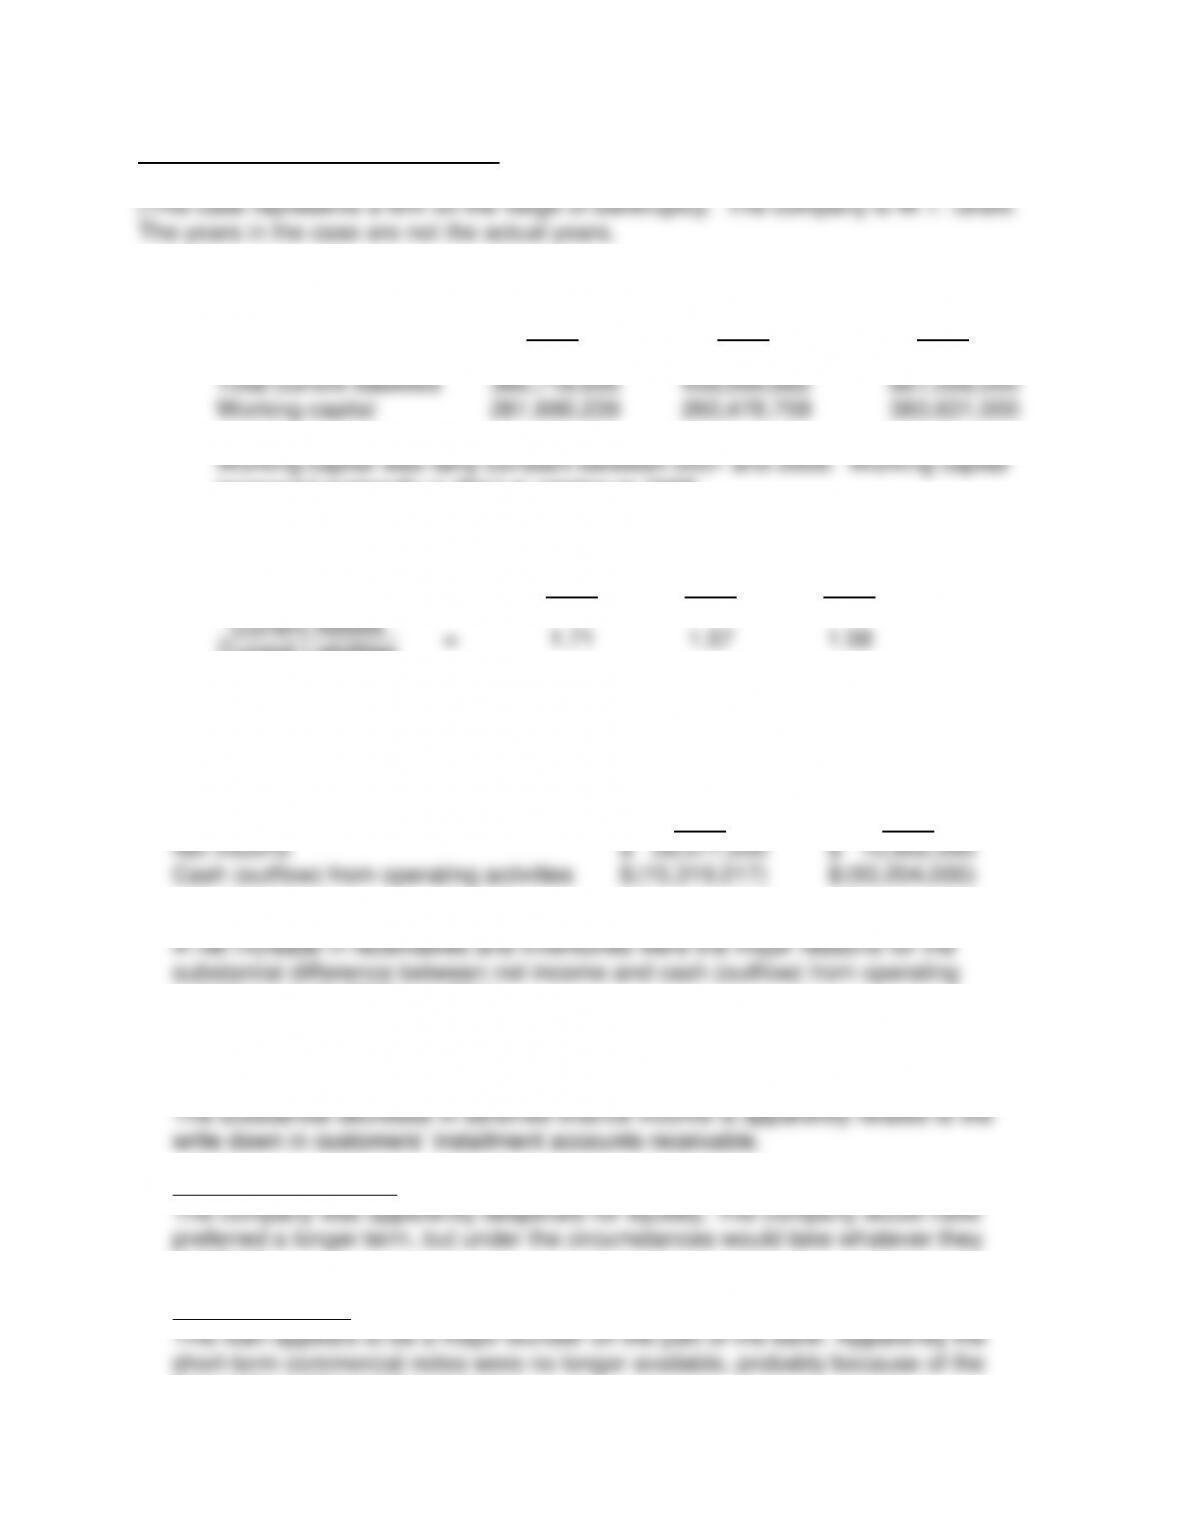
a. 1.
2007
2008
2011
Total current assets
$
628,408,895
$
719,478,441
$
1,044,689,000
Total current liabilities
366,718,656
458,999,682
661,058,000
Working capital
261,690,239
260,478,759
383,631,000
increased materially in 2011 in relation to 2008.
2.
Current ratio
2007
2008
2011
Current Assets
=
1.71
1.57
1.58
Current Liabilities
The absolute current ratios appear to be too low. There was a substantial
decline in the current ratio between 2007 and 2008.
b.
2008
2011
Net income
$
39,577,000
$
10,902,000
Cash (outflow) from operating activities
$
(15,319,217)
$
(93,204,000)
activities in both 2008 and 2011.
c. There was an apparent write down in customers’ installment accounts receivable
and merchandise inventories.
d. Company perspective
could get.
Bank perspective
financial condition of the company.
342
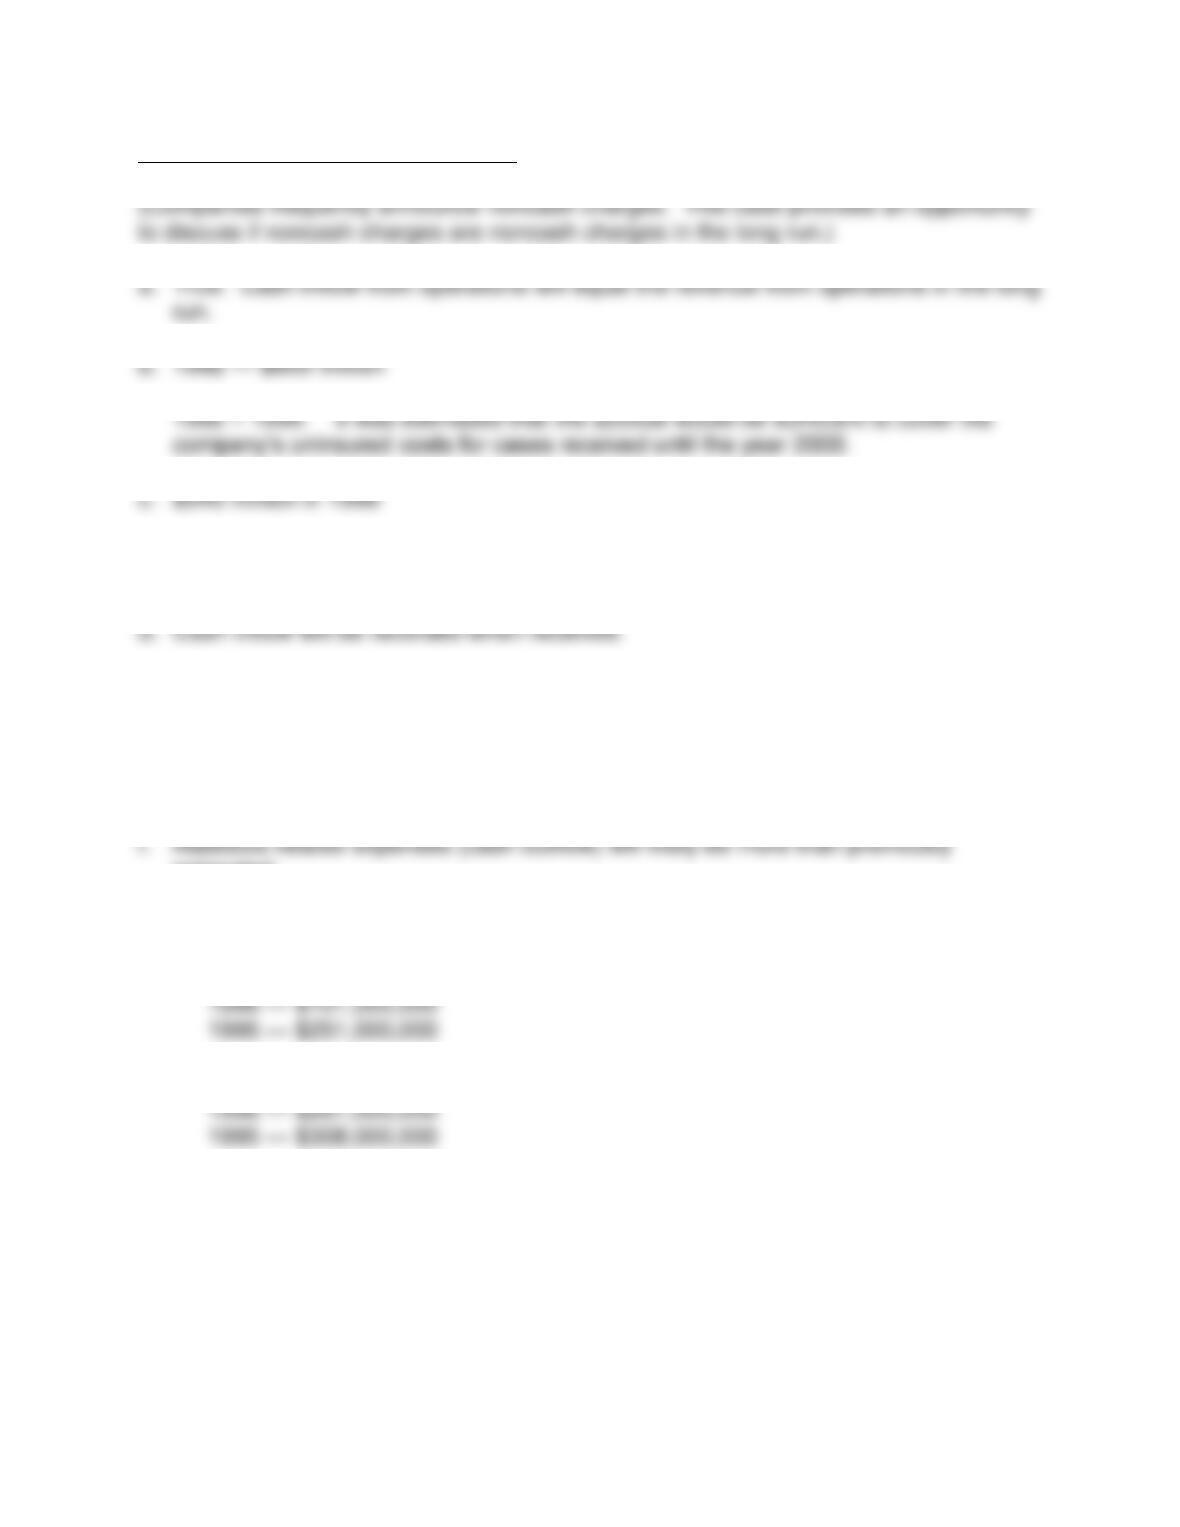
CASE 10-5 NON-CASH CHARGES
Cash payments associated with charge will begin after the year 2000 and will be
spread over 15 years or more.
The related revenue will likely be recorded in the same period that the cash is
received. This is an example of conservatism.
e. If they do not win the suit, the expenses (cash outflow) for asbestos claims will likely
be substantially higher than previously provided for.
estimated.
g. 1. 1996 — $875,000,000
2. 1997 — $97,000,000
3. 1997 — $300,000,000
Note: On Thursday, October 5, 2000, Owens Corning voluntarily filed a petition
for reorganization under Chapter 11 bankruptcy protection in the United States
Bankruptcy Court in Wilmington, Delaware.
343
Owens Corning News release, January 17, 2003
“Owens Corning file Joint Plan of Reorganization with Asbestos Creditors in Chapter 11
Case.” . . . “The plan sets forth a proposed consensual framework to determine creditor
distributions, with recoveries based on aggregate asbestos claims of $16 billion, and a
preferred recovery to holders of bank claims of $400 million, in addition to pro rata
recovery on the balance of their claims. . . .”
CASE 10-6 CASH MOVEMENTS AND PERIODIC INCOME DETERMINATION
a. Income determination is not an exact science. A substantial amount of subjectivity
b. Cash flow is determined in an objective manner.
c. In theory, this is a true statement. United States accounting principles provide for
the income statement.
d. In the short run, a negative cash flow from operations could be compensated for by
cash flow from investing and financing activities.
344
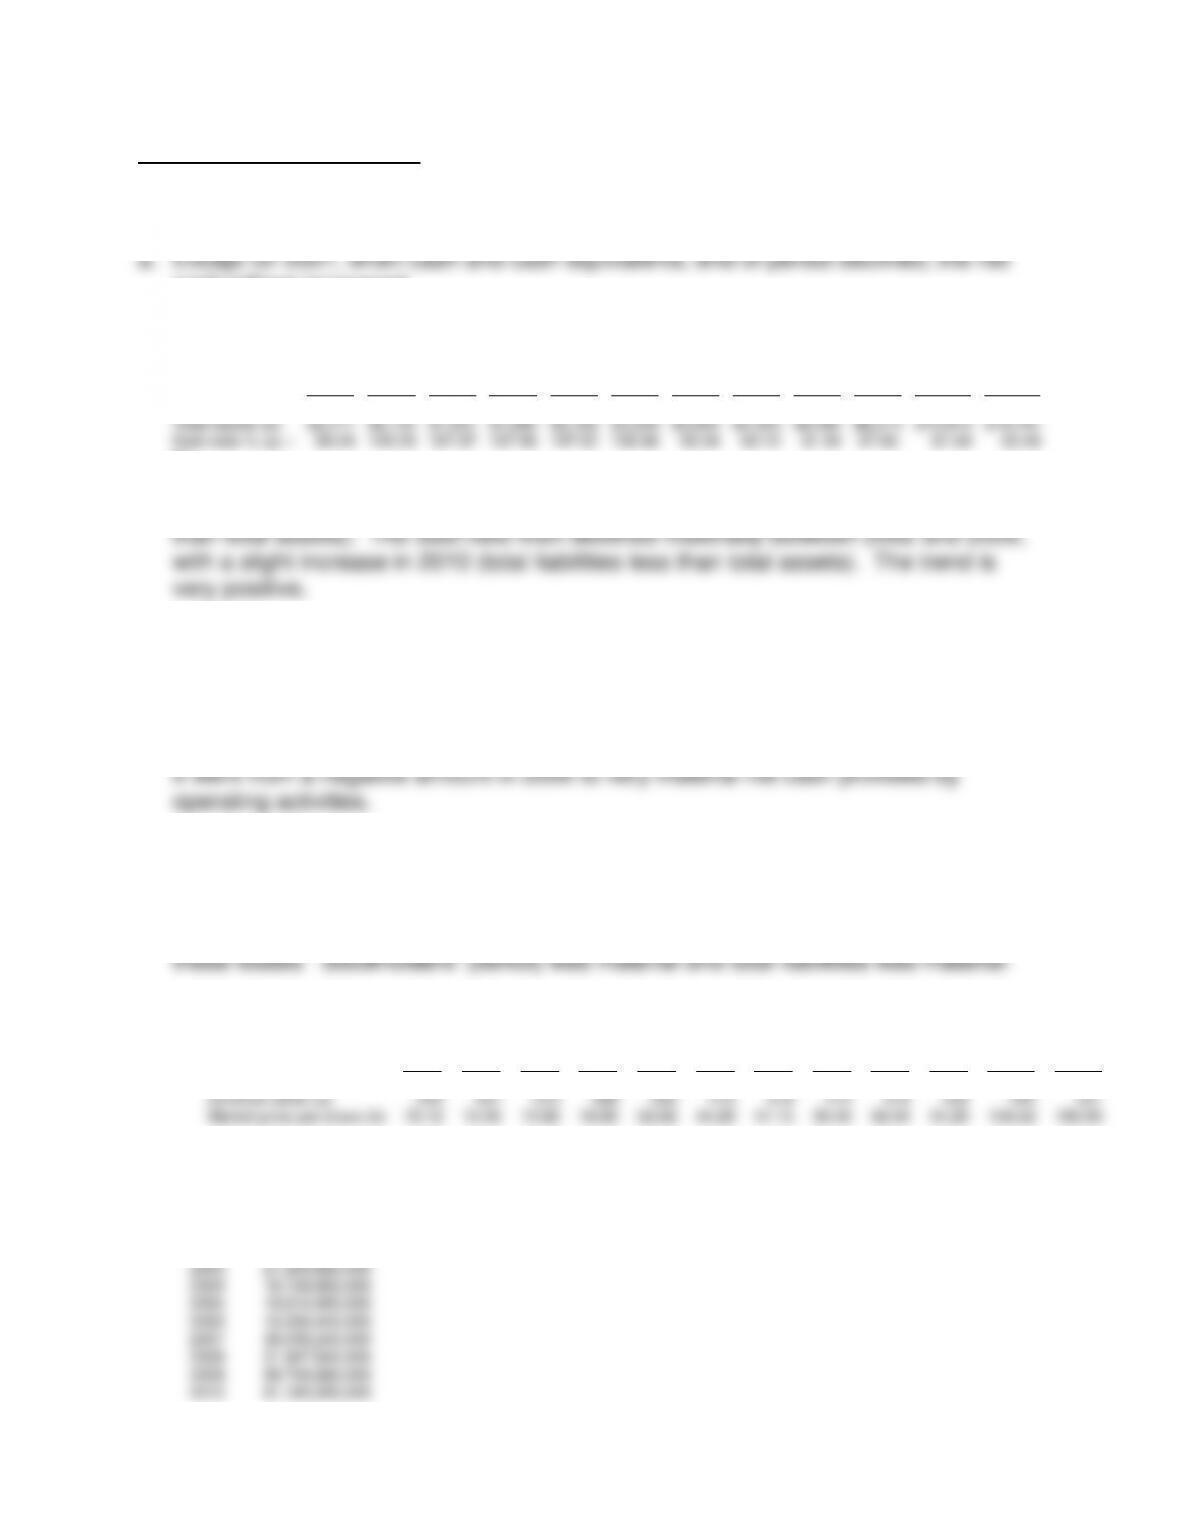
CASE 10-7 THE BIG.COM
(This case represents an opportunity to review Amazon.com over a 10-year period.)
cash inflows increased.
b. Debt ratio
1999
2000
2001
2002
2003
2004
2005
2006
2007
2008
2009
2010
Total liabilities (a)
$2,205
$3,102
$3,077
$3,343
$3,198
$3,475
$3,450
$3,932
$5,288
$5,642
$8,556
$11,933
Total assets (b)
$2,471
$2,135
$1,637
$1,990
$2,162
$3,249
$3,696
$4,363
$6,485
$8,314
$13,813
$18,797
Debt ratio % (a) ÷
(b)
89.24
145.29
187.97
167.99
147.92
106.96
93.34
90.12
81.54
67.86
61.94
63.48
The debt ratio increased materially between 1999 and 2002 (total liabilities more
c. Net cash provided by financing activities (1998 – 2002)
There was substantial cash provided by financing activities during the period of 1998
– 2002.
d. The trend in net cash provided by operating activities 2002 – 2010 was very positive.
e. Net sales increased materially each year. The net income (loss) trended up
materially, but with material fluctuations.
f. Net loss was material in each of these years. The market apparently responded to
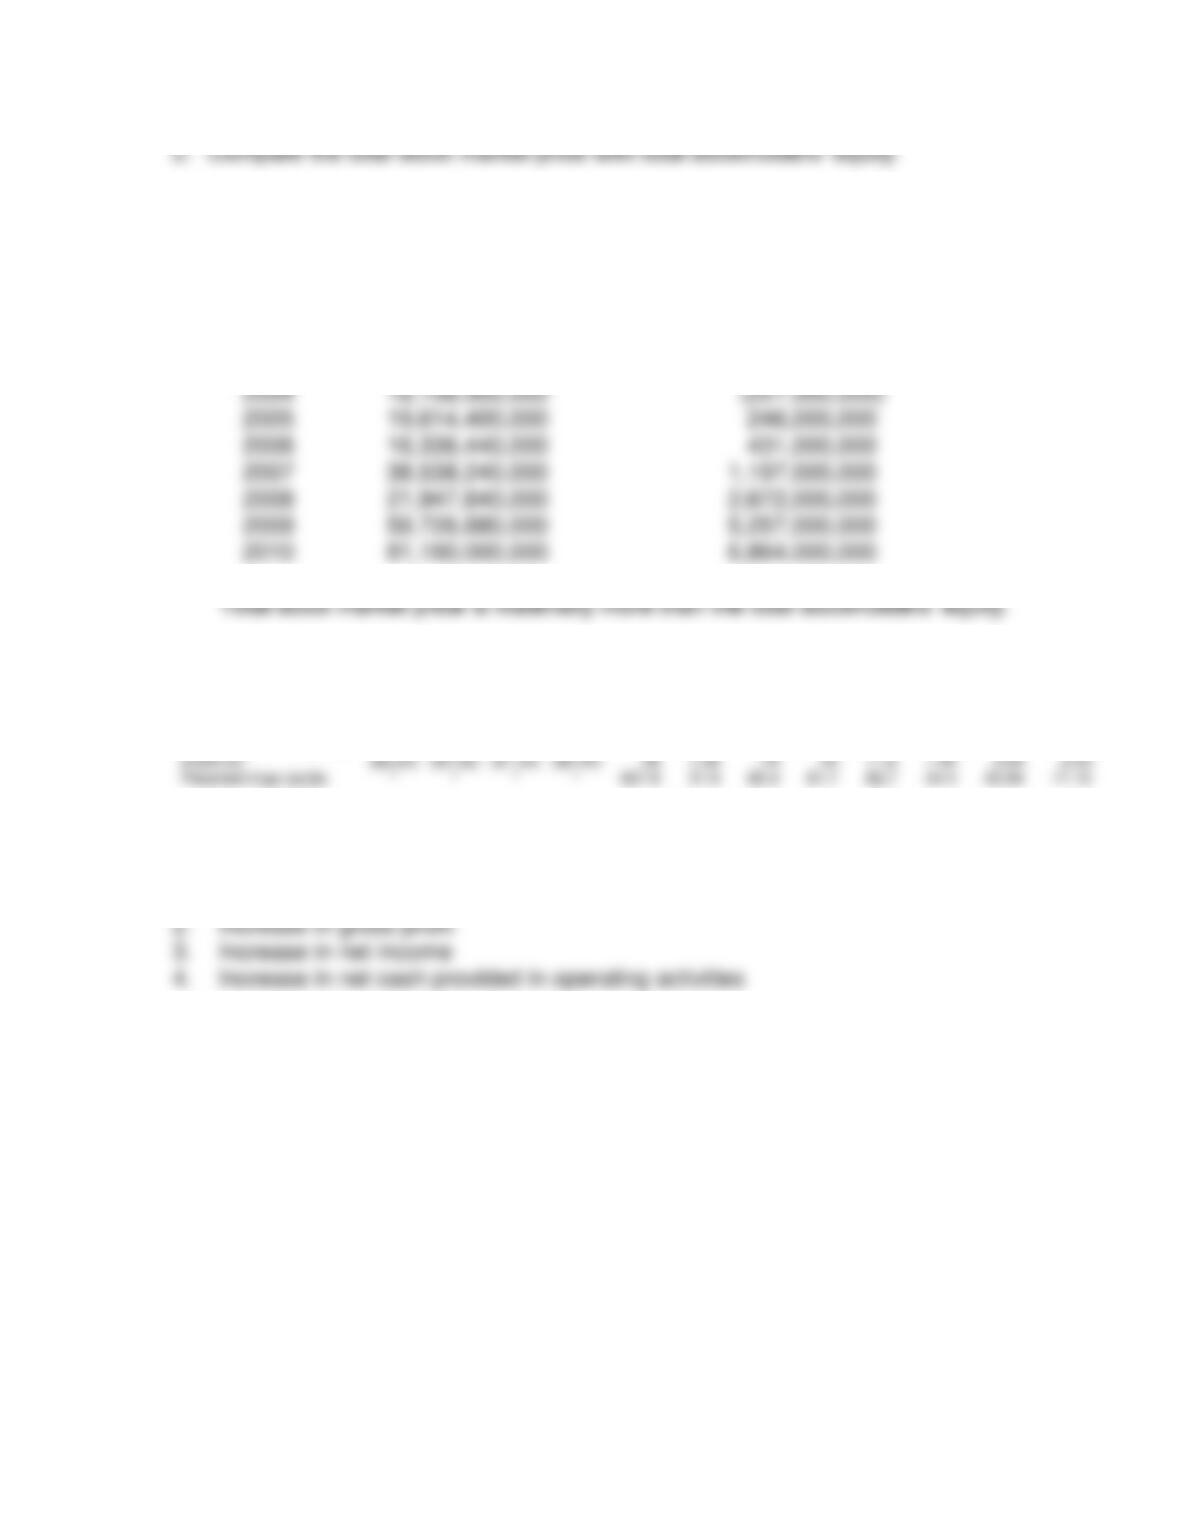
1. Total market capitalization
1999
2000
2001
2002
2003
2004
2005
2006
2007
2008
2009
2010
Outstanding shares of
common stock (a)
345
357
373
388
403
410
416
414
416
428
444
451
Market price per share (b)
76.12
15.56
10.82
18.89
52.62
44.29
47.15
39.46
92.64
51.28
134.52
180.00
(a) x (b)
1999
26,261,400,000
2000
5,554,920,000
2001
4,035,860,000
2002
7,329,320,000
2003
21,205,860,000
2004
18,158,900,000
2005
19,614,400,000
2006
16,336,440,000
2007
38,538,240,000
2008
21,947,840,000
2009
59,726,880,000
2010
81,180,000,000
345
Total Stock
Market Price
Stockholders’
Equity
1999
$26,261,400,000
$266,000,000
2000
5,554,920,000
(967,000,000)
2001
4,035,860,000
(1,440,000,000)
2002
7,329,320,000
(1,353,000,000)
2003
21,205,860,000
(1,036,000,000)
2004
18,158,900,000
(227,000,000)
2005
19,614,400,000
246,000,000
2006
16,336,440,000
431,000,000
2007
38,538,240,000
1,197,000,000
2008
21,947,840,000
2,672,000,000
2009
59,726,880,000
5,257,000,000
2010
81,180,000,000
6,864,000,000
g. Price/earnings ratio
1999
2000
2001
2002
2003
2004
2005
2006
2007
2008
2009
2010
Market price (a)
$76.12
$15.56
$10.82
$18.89
$52.62
$44.29
$47.15
$39.46
$92.64
$51.28
$134.52
$180.00
Fully diluted earnings per
share (b)
($2.20)
($4.02)
($1.53)
($0.40)
.08
1.39
.78
.45
1.12
1.49
2.04
2.53
Price/earnings (a)/(b)
*
*
*
*
657.8
31.9
60.4
87.7
82.7
34.4
65.94
71.15
*Negative earnings
h. Yes. Many positive items including the following:
1. Increase in sales
346
CASE 10-8 GLASS CONTAINERS
asbestos.)
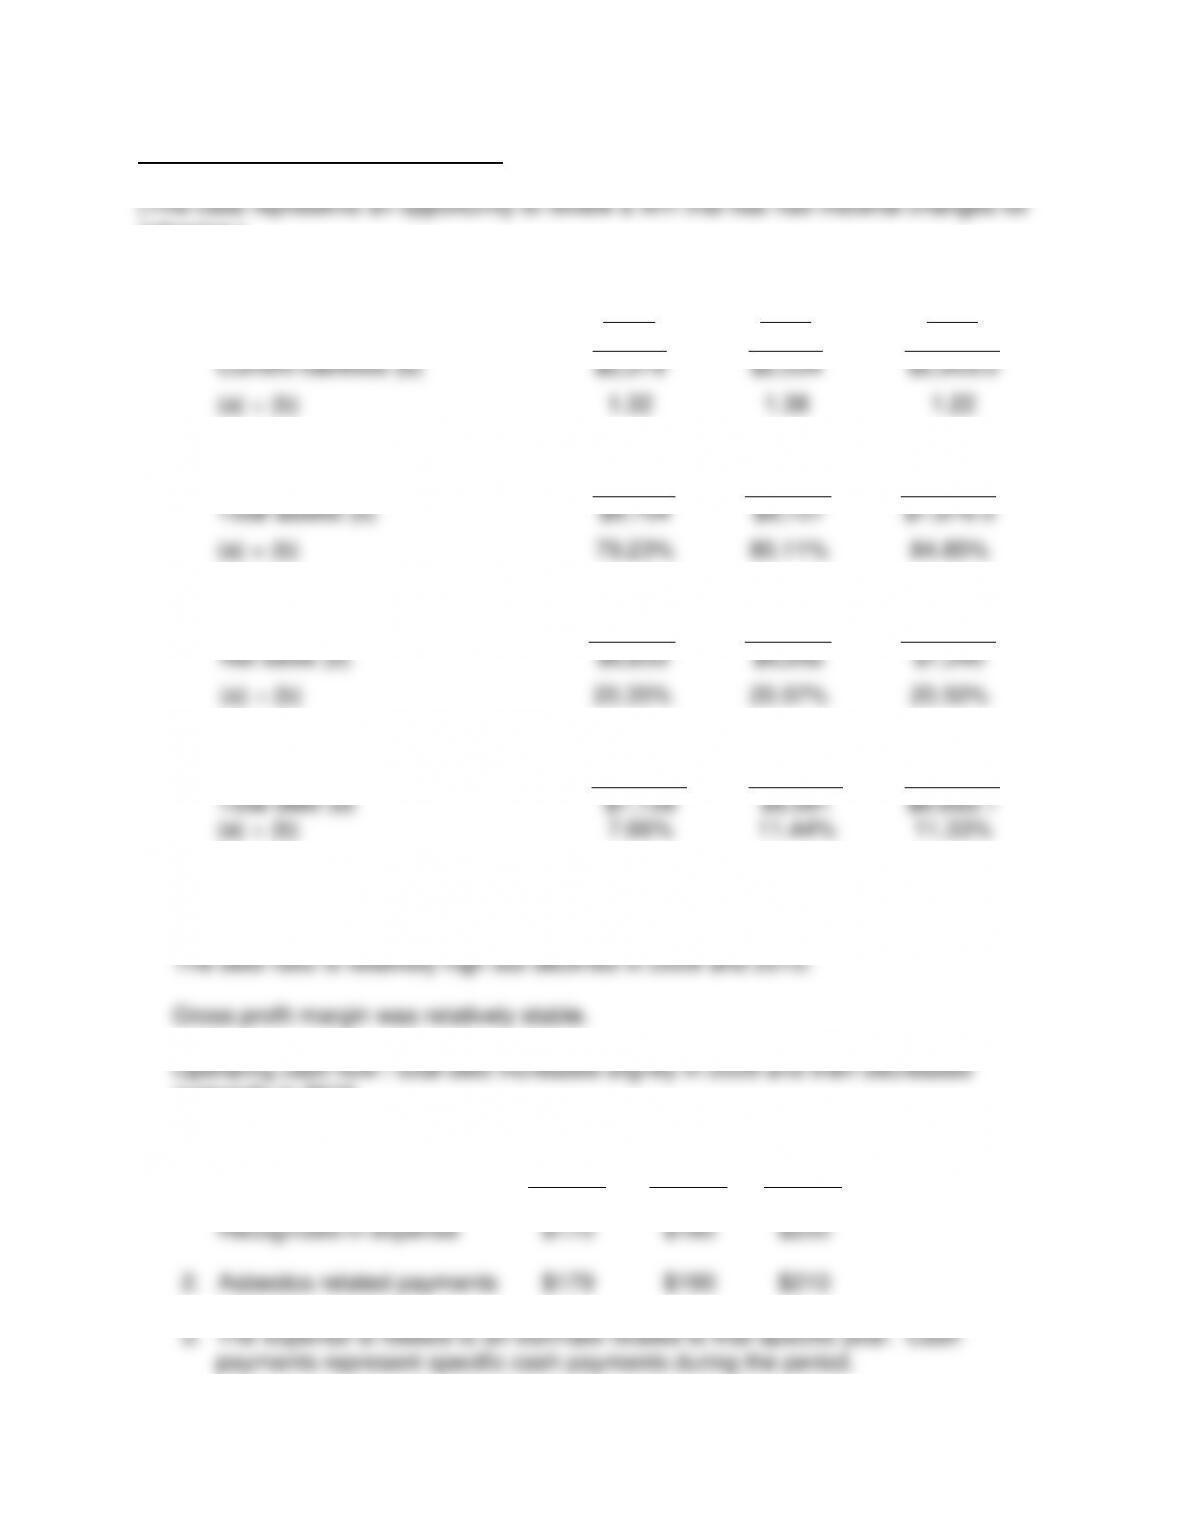
a.
1.
Current ratio
2010
2009
2008
Current assets (a)
$2,738
$2,797
$2,444.7
Current liabilities (b)
$2,079
$2,034
$2,003.0
(a) ÷ (b)
1.32
1.38
1.22
2.
Debt ratio
Total liabilities (a)
$7,728
$6,991
$6,683.1
Total assets (b)
$9,754
$8,727
$7,876.5
(a) ÷ (b)
79.23%
80.11%
84.85%
3.
Gross profit margin
Gross profit (a)
$1,350
$1,335
$1,546
Net sales (b)
$6,633
$6,652
$7,540
(a) ÷ (b)
20.35%
20.07%
20.50%
4.
Operating cash flow/total debt
Operating cash flow (a)
$592
$800
$757
Total debt (b)
$7,728
$6,991
$6,683.1
(a) ÷ (b)
7.66%
11.44%
11.33%
b. The current ratio has improved materially in 2009 and then declined in 2010. It
appears to be relatively low.
materially in 2010.
c. Asbestos related
1.
2010
2009
2008
Millions
Recognized in expense
$170
$180
$250
2.
Asbestos related payments
$179
$190
$210
347
4.
2010
2009
2008
Millions
Expense did not require cash
—–
—–
—–
Payments did require cash
$179
$190
$210
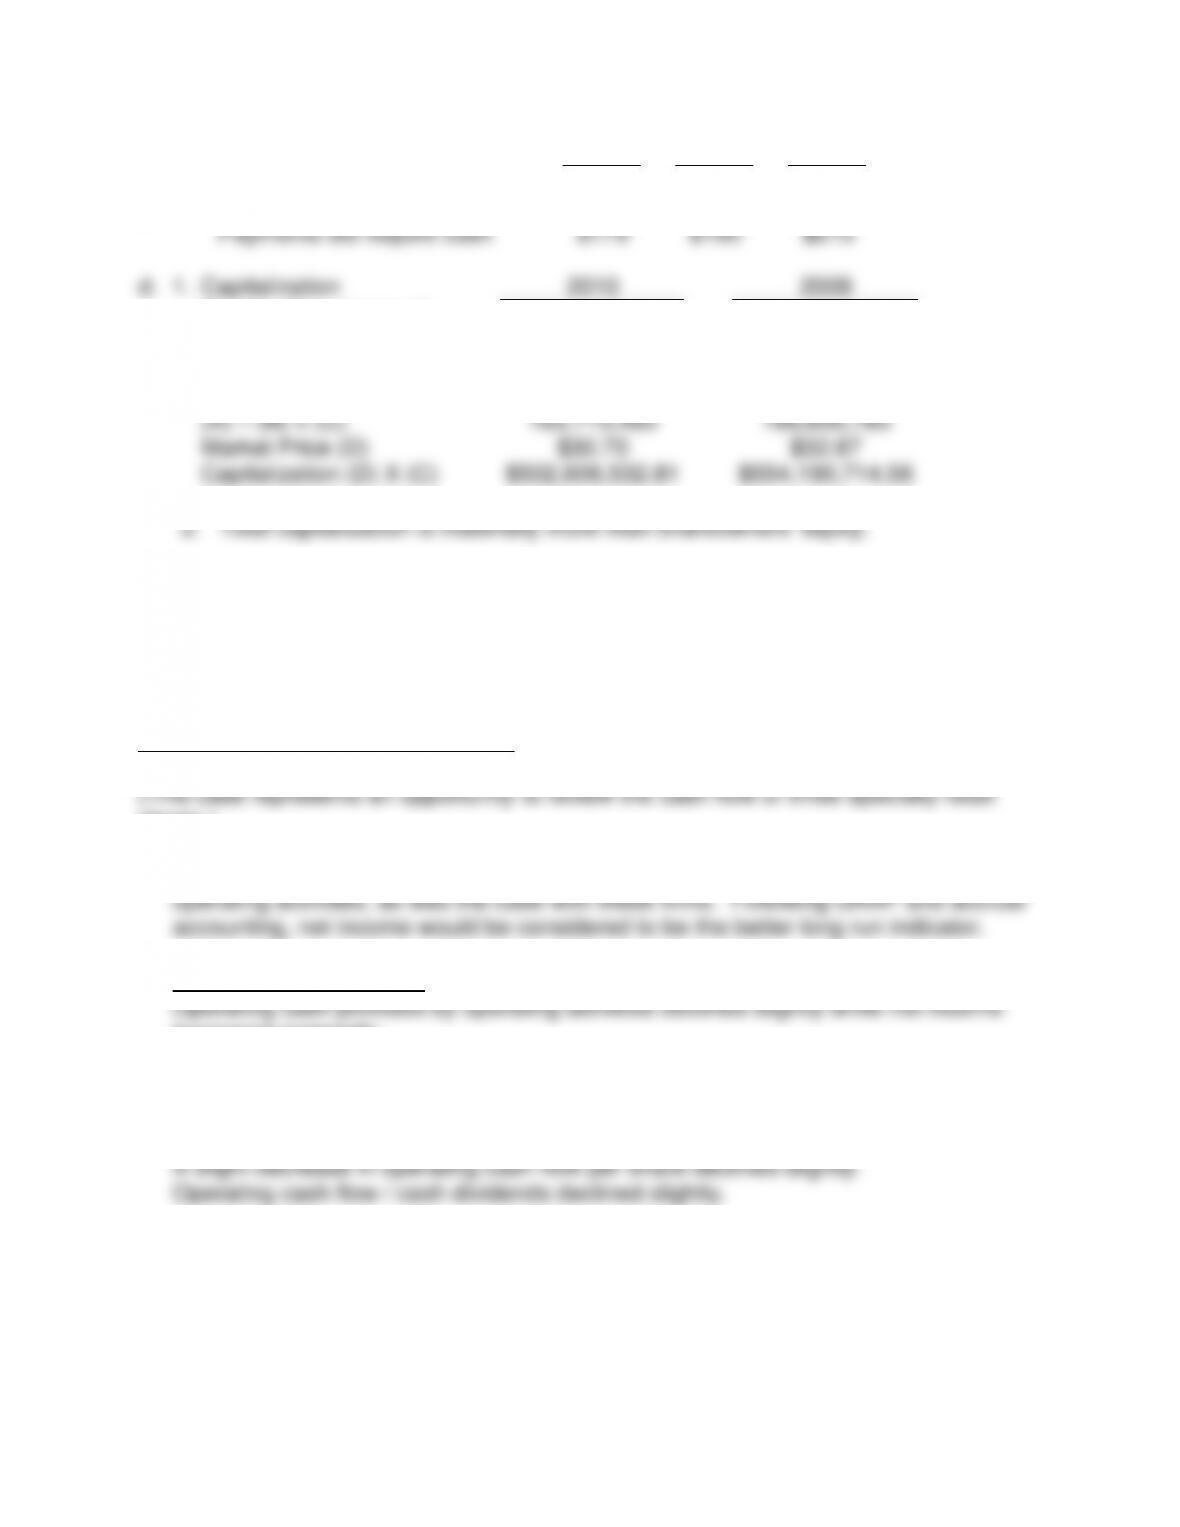
d.
1.
Capitalization
2010
2009
Outstanding shares of
common stock (a)
Shares Issued (A)
180,808,992
179,923,309
Treasury Stock (B)
17,093,509
11,322,544
(A) – (B) = (C)
163,715,483
168,600,765
Market Price (D)
$30.70
$32.87
Capitalization (D) X (C)
$502,606,532.81
$554,190,714.56
CASE 10-9 SPECIALTY RETAILER
stores.)
a. There can be material differences between income and net cash provided by
b. Abercrombie & Fitch Co.
increased materially.
There was no current maturities of long-term debt and current notes payable.
Operating cash flow / total debt declined substantially.
348
Limited Brands, Inc.
No current maturities of long-term debt and current notes payable.
Operating cash flow per share increased materially.
Operating cash flow/cash dividends decreased materially.
GAP, Inc.
Net income increased materially.
Operating cash flow/cash dividends decreased materially.
cash dividends.
CASE 10-10 EAT AT MY RESTAURANT – CASH FLOW
companies.)
a. There was a material difference between net cash provided by operating activities
indicator of long-term profitability.
349
b. Yum Brands, Inc.
Net income, including noncontrolling interest increased substantially.
Operating cash flow/current maturities of long-term debt and current notes payable
decreased materially.
Operating cash flow/total debt increased materially.
Panera Bread
Net income including noncontrolling interest increased materially.
Operating cash flow per share increased materially.
There were no dividends.
Starbucks
No current maturities of long-term debt and current notes payable.
Operating cash flow/cash dividends appears to be very good in 2010 and there was
no cash dividend in 2009.
very good in 2010 in relation to 2009.