297
Fiscal year ended October 3, 2009 statements – September 27, 2008
$5.78
Fiscal year ended October 2, 2010 statements – September 27, 2008
$5.80
c. September 7, 2008
1. October 2, 2010 statements
2. October 3, 2009 statements
3. September 27, 2008 statements
4. Reverse stock split July 20, 2009
September 27, 2008 statements
CASE 9-3 GLOBAL DIVERSIFIED FINANCIAL SERVICES
(This case provides an opportunity to review a reverse stock split.)
a. The stock price should increase by a factor of ten times.
Year Ended December 31,
2010
2009
2008
In Millions
Citigroup’s Net Income (Loss)
$10,602
($1,606)
($27,684)
298
c.
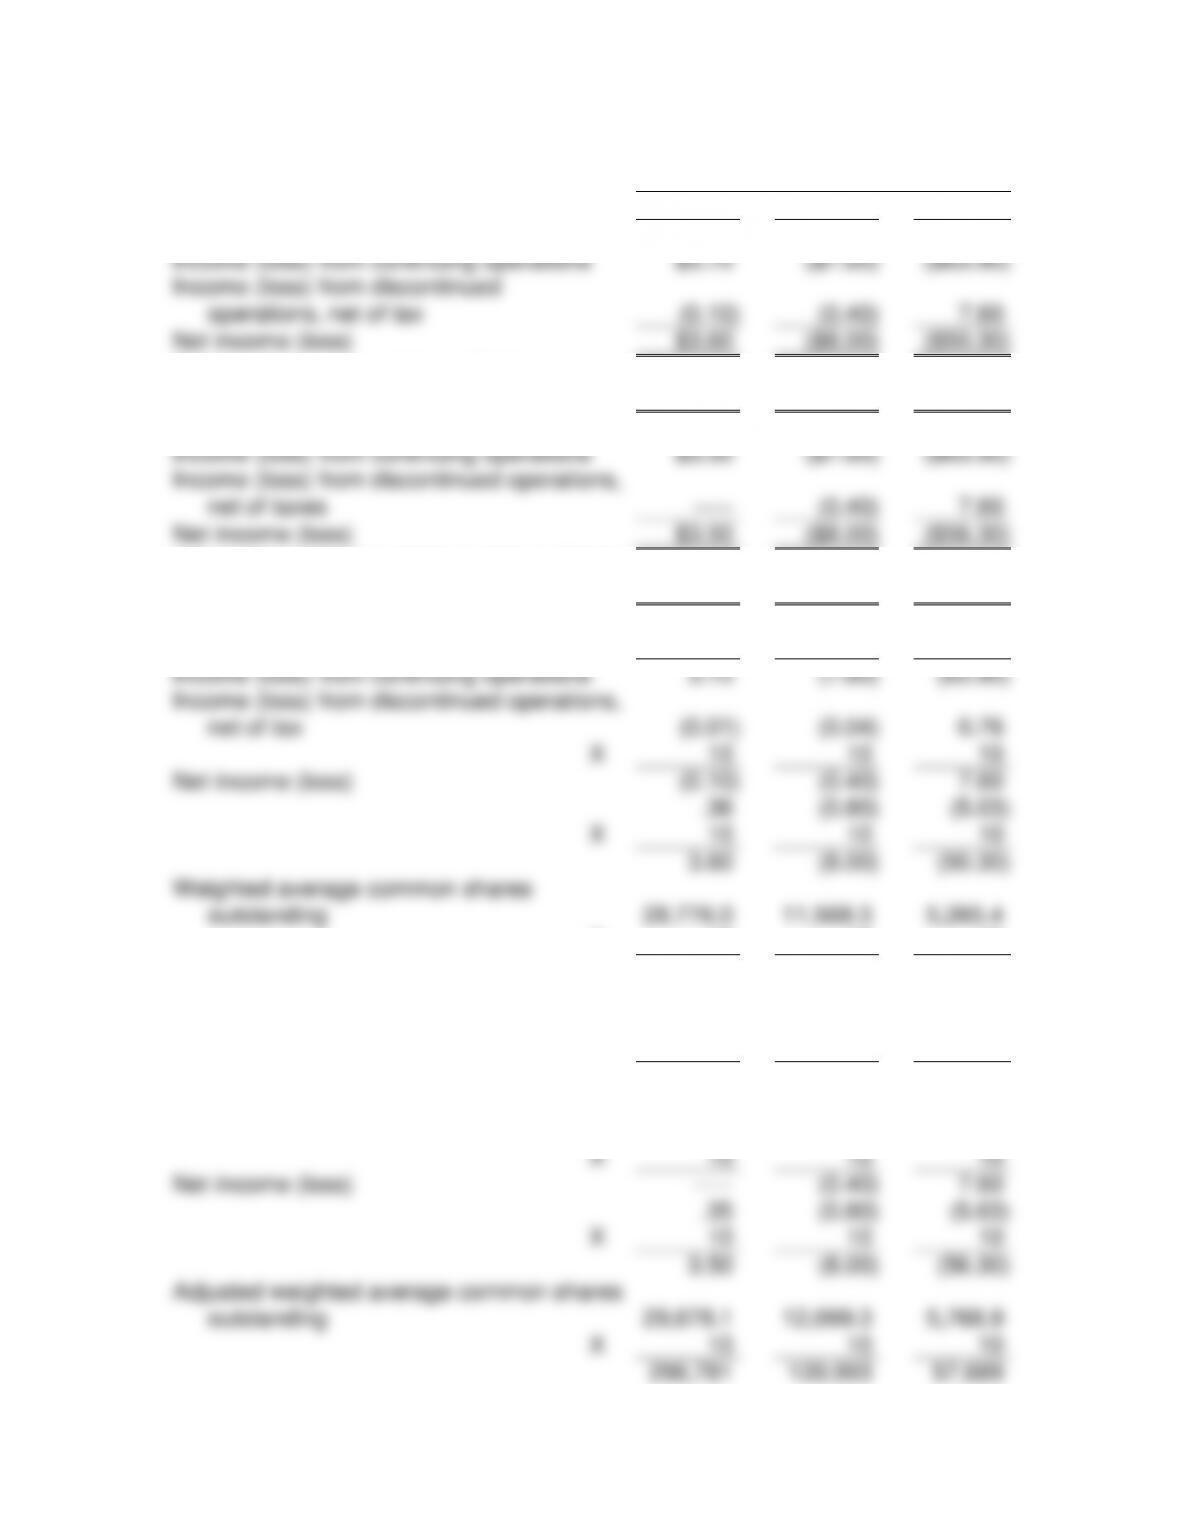
Year Ended December 31,
2010
2009
2008
Basic earnings per share
Income (loss) from continuing operations
$3.70
($7.60)
($63.90)
Income (loss) from discontinued
operations, net of tax
(0.10)
(0.40)
7.60
Net income (loss)
$3.60
($8.00)
($50.30)
Weighted average common shares
outstanding
287,760
115,683
52,654
Diluted earnings per share
Income (loss) from continuing operations
$3.50
($7.60)
($63.90)
Income (loss) from discontinued operations,
net of taxes
—–
(0.40)
7.60
Net income (loss)
$3.50
($8.00)
($56.30)
Adjusted weighted average common shares
outstanding
296,781
120,993
57,689
Basic earnings per share
$0.37
($0.76)
($6.39)
X
10
10
10
Income (loss) from continuing operations
3.70
(7.60)
(63.90)
Income (loss) from discontinued operations,
net of tax
(0.01)
(0.04)
0.76
X
10
10
10
Net income (loss)
(0.10)
(0.40)
7.60
.36
(0.80)
(5.03)
X
10
10
10
3.60
(8.00)
(50.30)
Weighted average common shares
outstanding
28,776.0
11,568.3
5,265.4
X
10
10
10
287,760
115,683
52,654
Diluted earnings per share
Income (loss) from continuing operations
.35
(.76)
(6.39)
X
10
10
10
3.50
(7.60)
(63.90)
Income (loss) from discontinued operations,
net of taxes
—–
(0.04)
.76
X
10
10
10
Net income (loss)
—–
(0.40)
7.60
.35
(0.80)
(5.63)
X
10
10
10
3.50
(8.00)
(56.30)
Adjusted weighted average common shares
outstanding
29,678.1
12,099.3
5,768.9
X
10
10
10
296,781
120,993
57,689
299
CASE 9-4 FAMILY STYLE
chapter.)
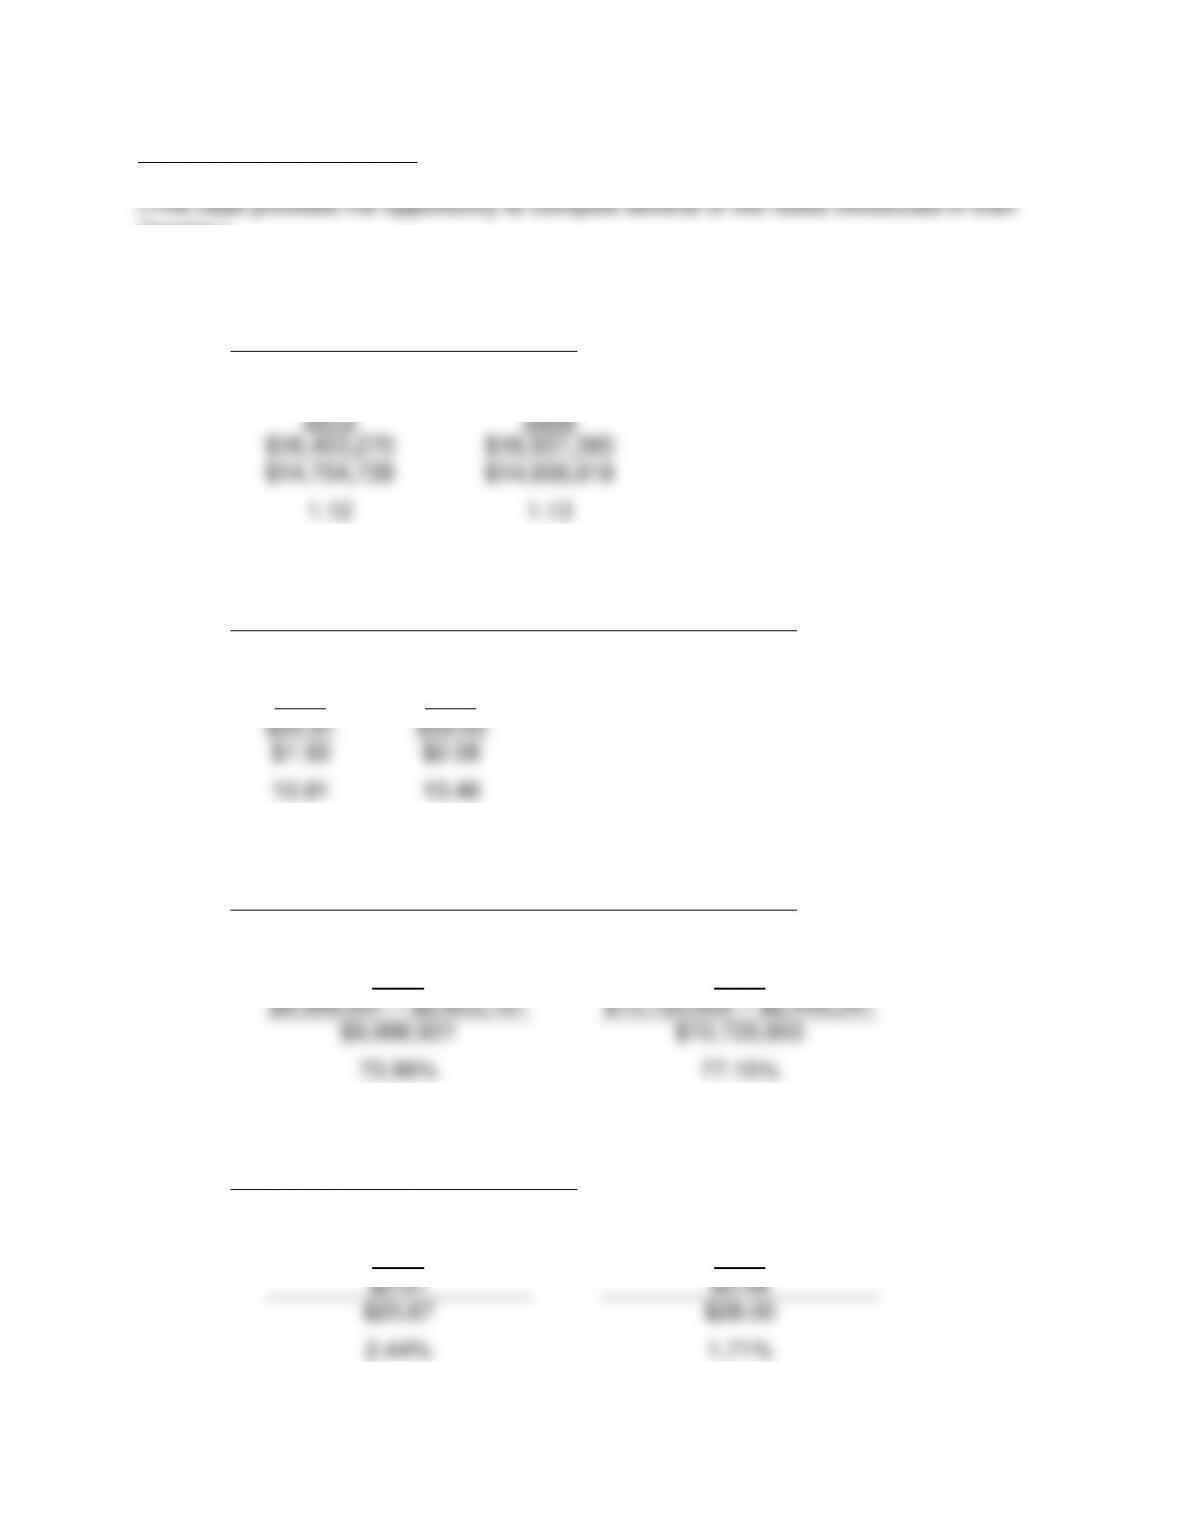
a. 1. Degree of Financial Leverage =
Earnings Before Interest and Tax
Earnings Before Tax
2010
2009
$16,453,270
$16,937,360
$14,704,728
$14,936,918
1.12
1.13
2. Price / Earnings Ratio =
Market Price Per Share
Diluted Earnings Per Share, Before Nonrecurring Items
2010
2009
$20.87
$28.00
$1.93
$2.08
10.81
13.46
3. Percentage of Earnings Retained =
Net Income Before Nonrecurring Items – All Dividends
Net Income Before Nonrecurring Items
2010
2009
$9,998,931 – $2,603,767
$10,720,855 – $2,449,347
$9,998,931
$10,720,855
73.96%
77.15%
4. Dividend Yield =
Dividends Per Common Share
Market Price Per Common Share
2010
2009
$0.51
$0.48
$20.87
$28.00
2.44%
1.71%
300
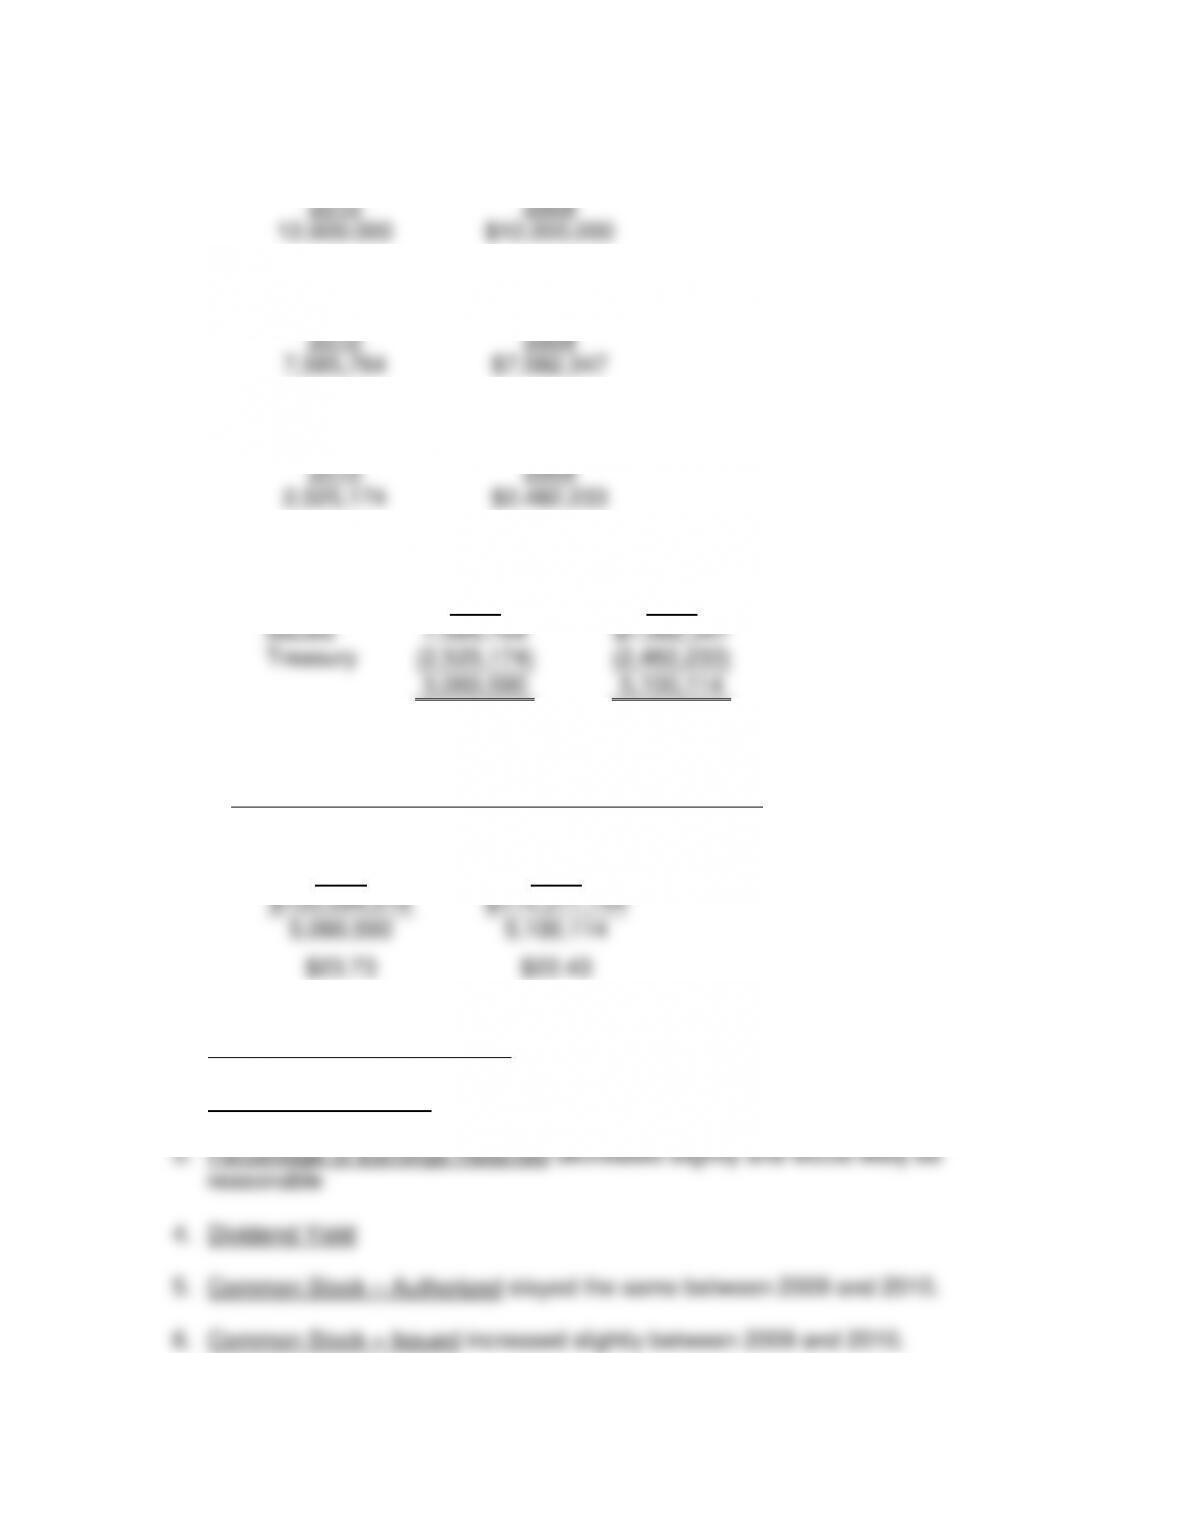
5. Common Stock – Authorized
2010
2009
12,000,000
$12,000,000
6. Common Stock – Issued
2010
2009
7,585,764
$7,582,347
7. Treasury Stock
2010
2009
2,525,174
$2,482,233
8. Common Stock Outstanding
2010
2009
Issued
7,585,764
$7,582,347
Treasury
(2,525,174)
(2,482,233)
5,060,590
5,100,114
9. Book Value Per Share =
Total Shareholders’ Equity – Preferred Stock Equity
Number of Common Shares Outstanding
2010
2009
$120,094,016
$114,377,144
5,060,590
5,100,114
$23.73
$22.43
b. 1. Degree of Financial Leverage decreased slightly and appears to be moderate.
2. Price / Earnings Ratio
301
c. 1. Special Items
2010
2009
CASE 9-5 DELICIOUS APPLE
a. 1.
Apple Inc.
Consolidated Statements of Operations
Three Fiscal Years Ended September 25, 2010
Horizontal Common-Size
2010
2009
2008
Net sales
174.0
114.4
100.0
Cost of sales
162.8
105.7
100.0
Gross margin
194.6
130.5
100.0
Operating expenses:
Research and development
160.7
120.2
100.0
Selling, general and administrative
146.7
110.3
100.0
Total operating expenses
149.9
112.6
100.0
Operating income
220.8
141.0
100.0
Other income and expense
25.0
52.6
100.0
Income before provision for income taxes
207.2
134.9
100.0
Provision for income taxes
160.1
135.5
100.0
Net income
229.0
134.6
100.0
302
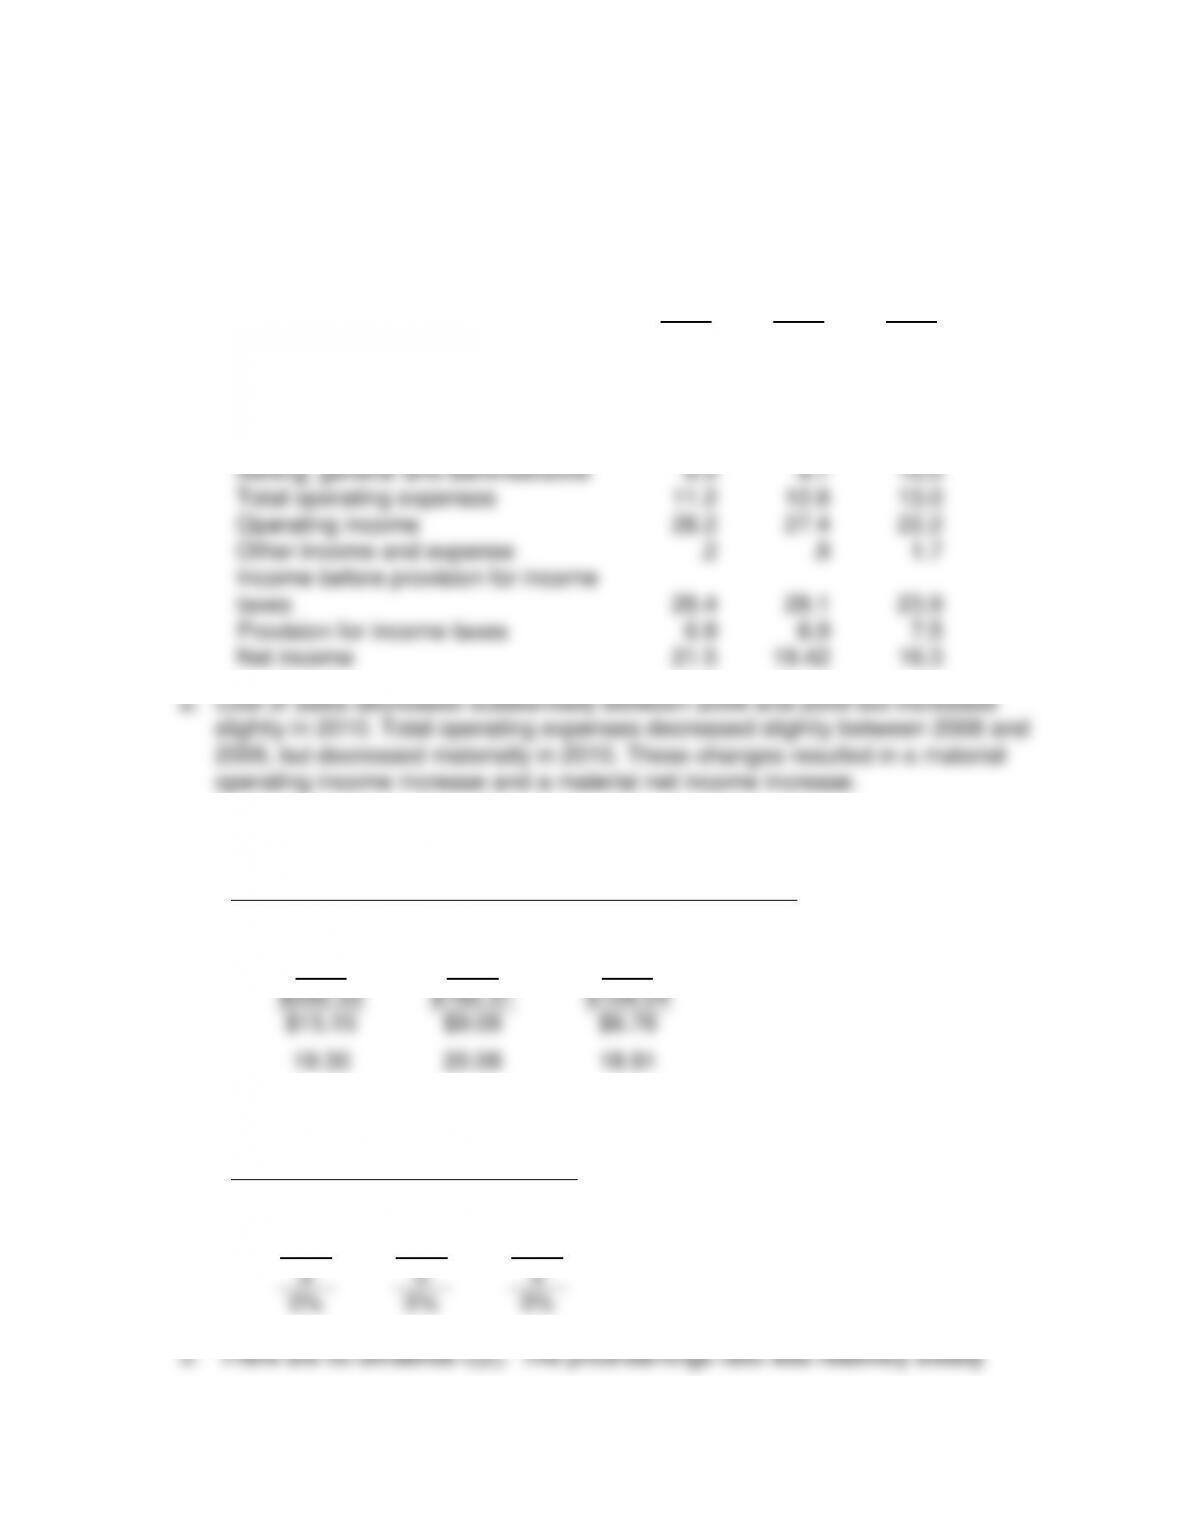
b. 1.
Apple Inc.
Consolidated Statements of Operations
Three Fiscal Years Ended September 25, 2010
Vertical Common-Size
2010
2009
2008
Net sales
100.0
100.0
100.0
Cost of sales
60.6
59.9
64.8
Gross margin
39.4
40.1
35.2
Operating expenses:
Research and development
2.7
3.1
3.0
Selling, general and administrative
8.5
9.7
10.0
Total operating expenses
11.2
12.8
13.0
Operating income
28.2
27.4
22.2
Other income and expense
.2
.8
1.7
Income before provision for income
taxes
28.4
28.1
23.9
Provision for income taxes
6.9
8.9
7.5
Net income
21.5
19.42
16.3
c. 1. Price / Earnings Ratio =
Market Price Per Share
Diluted Earnings Per Share, Before Nonrecurring Items
2010
2009
2008
$292.33
$182.37
$128.24
$15.15
$9.08
$6.78
19.30
20.08
18.91
2. Dividend Yield =
Dividends Per Common Share
Market Price Per Common Share
2010
2009
2008
0
0
0
0%
0%
0%
303
while the market price increased very, very materially.
CASE 9-6 SPECIALTY RETAILER – INVESTOR VIEW
investor view).
a. Abercrombie & Fitch
Diluted earnings per share before nonrecurring items increased materially.
Limited Brands, Inc.
high.
Diluted earnings per share before nonrecurring items increased materially.
Percentage of earnings retained went from relatively low to more dividends than
earnings.
Market price per share increased materially.
GAP, Inc.
Percentage of earnings retained is high and increased slightly.
Dividend yield increased moderately.
304
considered a negative.
Impressed by the diluted earnings per share increase and the competitive
price/earnings ratio.
(This case provides the opportunity to review the profitability of several restaurant
companies.)
a. Yum Brands, Inc.
Percentage of earnings retained declined slightly but was still substantial.
Panera Bread
Very little financial leverage
Diluted earnings per share increased materially.
Starbucks
Diluted earnings per share before nonrecurring items increased materially.
305
Market price per share increased materially.

306
b. A reasonable selection would be Starbucks. Diluted earnings per share more than
materially lower than Panera Bread.