262
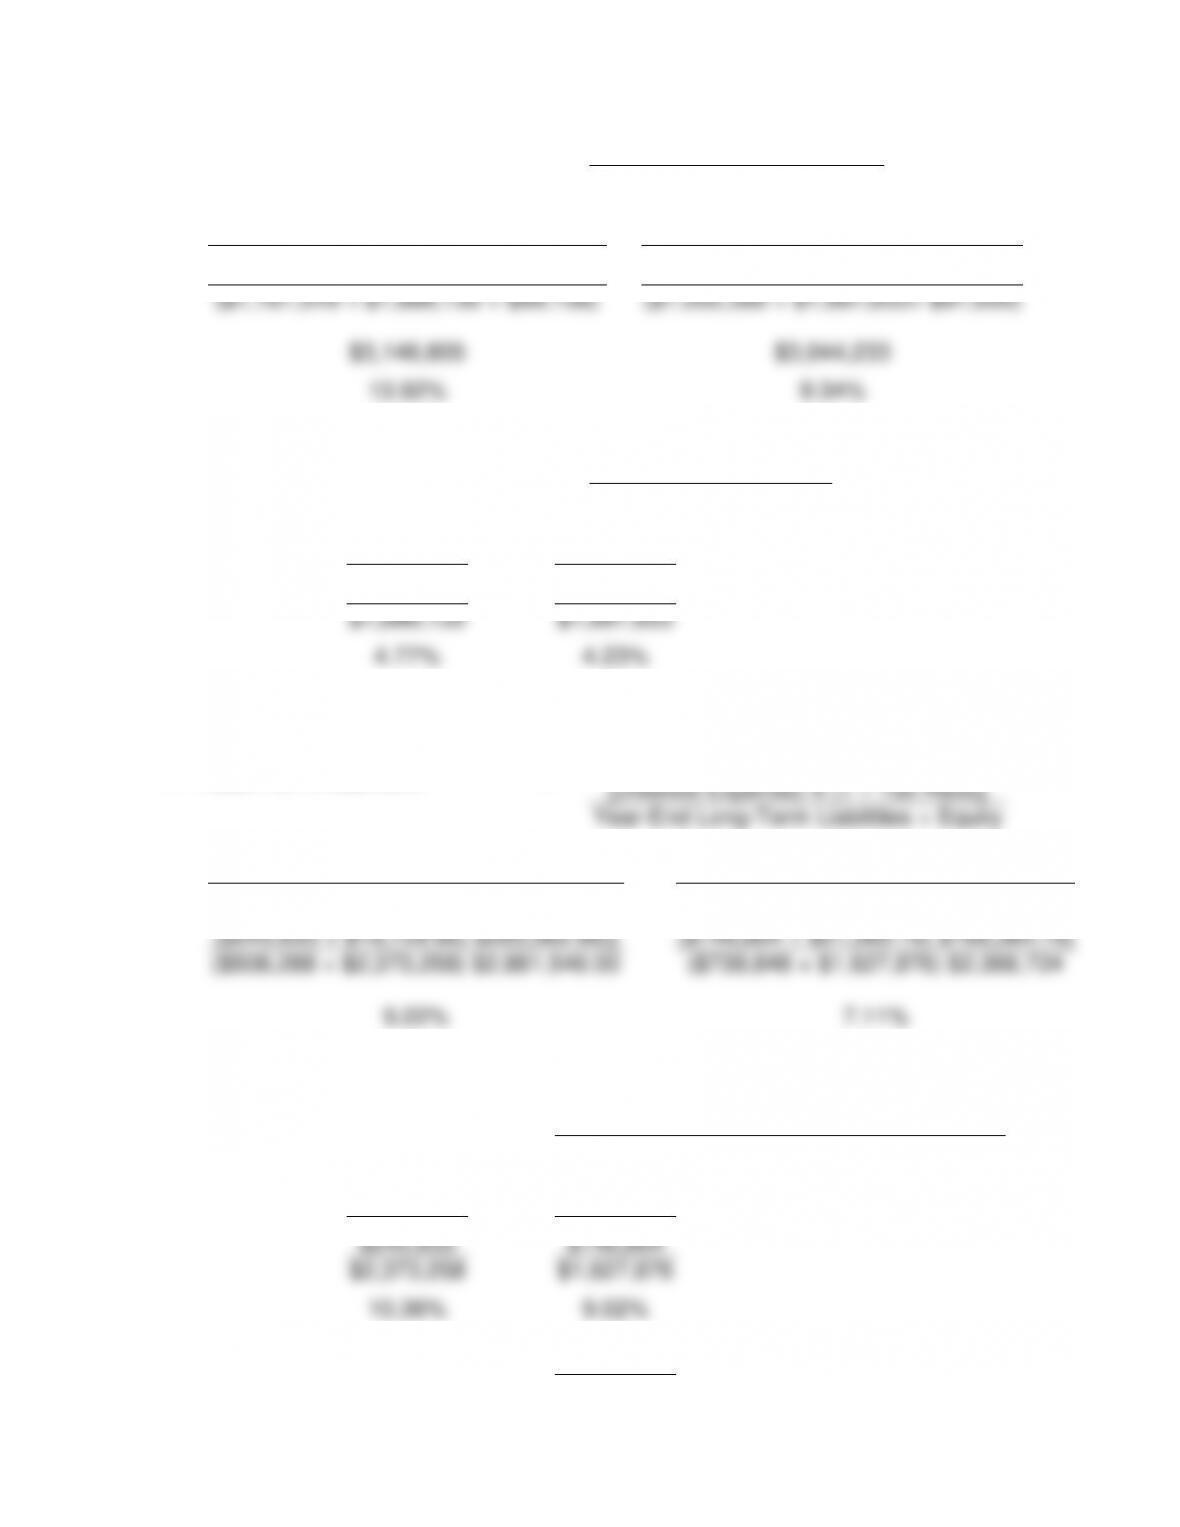
5.
Return on Operating Assets
=
Operating Income
Year-End Operating Assets
2010
2009
$437,975
$284,349
($1,161,519 + $1,886,130 + $99,156)
($1,055,380 + $1,897,853+ $91,000)
$3,146,805
$3,044,233
13.92%
9.34%
6.
Sales to Fixed Assets
=
Net Sales
Year-End Fixed Assets
2010
2009
$9,005,794
$8,031,620
$1,886,130
$1,897,853
4.77%
4.23%
7.
Return on Investment
=
Net Income Before Noncontrolling
Interest and Nonrecurring Items +
[(Interest Expense) X (1 – Tax Rate)]
Year-End Long-Term Liabilities + Equity
2010
2009
$245,833 + [$33,048 X (1 – Tax Rate)
($245,833 + $19,729.66) $265,562.66)]
$146,804 + [$36,856 X (1 – 41.50)
($146,804 + $21,560.76) $168,364.76]
($508,288 + $2,373,258) $2,881,546.00
($738,848 + $1,627,876) $2,366,724
9.22%
7.11%
8.
Return on Total Equity
=
Net Income Before Noncontrolling Items –
Dividends on Redeemable Preferred Stock
Year-End Total Equity
2010
2009
$245,833
$146,804
$2,373,258
$1,627,876
10.36%
9.02%
9.
Gross Profit Margin
=
Gross Proft
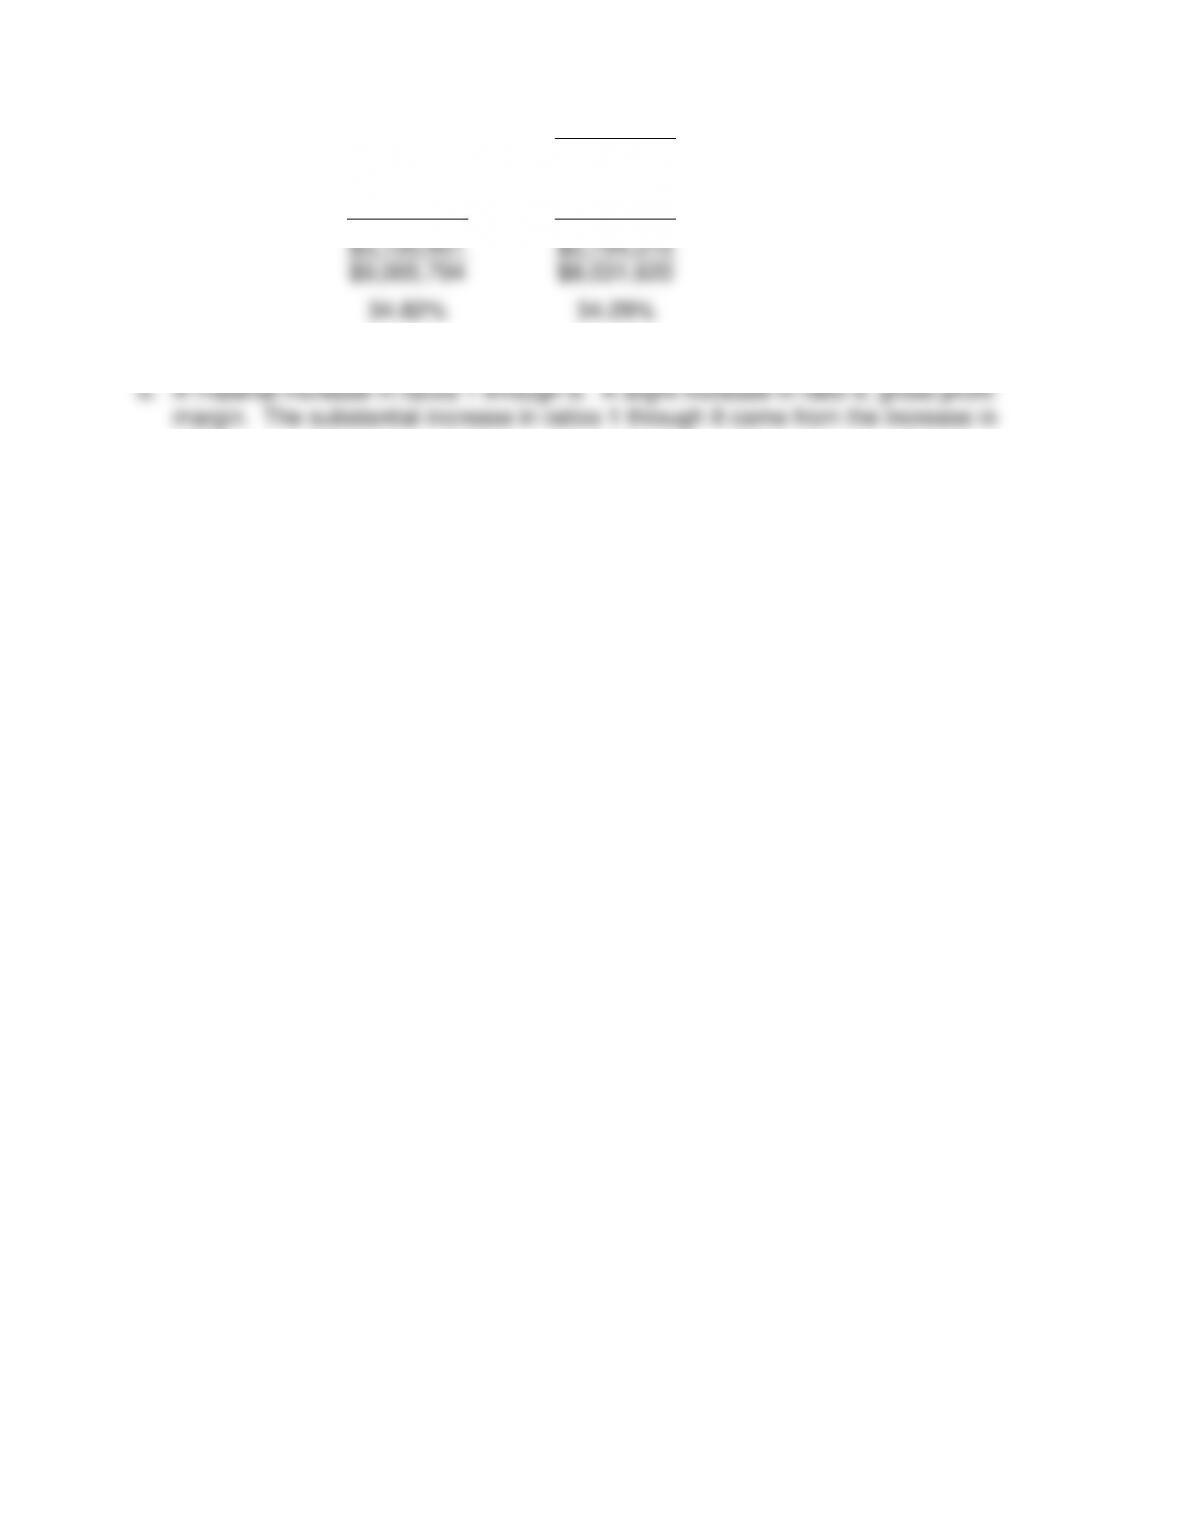
263
Net Sales
2010
2009
$3,135,401
$2,754,310
$9,005,794
$8,031,620
34.82%
34.29%
sales.

264
CASE 8-5 DIGITAL MEDIA
(This case provides an opportunity to review a number of profitability ratios and a
horizontal common size.)
a.
1.
Net Profit Margin
=
Net Income Before Noncontrolling Interest,
Equity Income and Nonrecurring Items
Net Sales
2009
2010
$597,992
– $250,390
$1,231,663
– $395,758
$6,460,315
$6,324,651
5.38%
13.22%
2.
Total Asset Turnover
=
Net Sales
Year End Total Assets
2006
2010
$6,460,315
$6,324,651
$14,936,030
$14,928,104
43.25%
42.37%
3.
Return on Assets
=
Net Income Before Noncontrolling Interest,
Equity Income and Nonrecurring Items
Year End Total Assets
2009
2010
$597,992 – $250,390
$1,231,663 – $395,758
$14,936,030
$14,928,104
2.33%
5.60%
4.
Operating Income Margin
=
Operating Income
Net Sales
2009
2010
$386,692
$772,524
$6,460,315
$6,324,651
5.99%
12.21%

265
5.
Return on Operating Assets
=
Operating Income
Year-End Operating Assets
2009
2010
$386,692
$772,524
($4,594,772 + $1,426,862
– $142,899) + $5,878,735
($4,345,548 + $1,653,422
– $175,830) + $5,823,040
6.58%
13.27%
6.
Sales to Fixed Assets
=
Net Sales
Year End Fixed Assets
(Exclude construction in progress)
2009
2010
$6,460,315
$6,324,651
$1,426,862
– $142,899
$1,653,422
– $175,830
5.03%
4.28%
7.
Return on Total Equity
=
Net Income Before Noncontrolling Items –
Dividends on Redeemable Preferred Stock
Year-End Total Equity
2009
2010
$597,992
$1,231,663
$12,518,636
$12,596,410
4.78%
9.78%
9.
Gross Profit Margin
=
Gross Proft
Net Sales
2009
2010
$3,588,569
$3,697,106
$6,460,315
$6,324,651
55.55%
58.46%
266
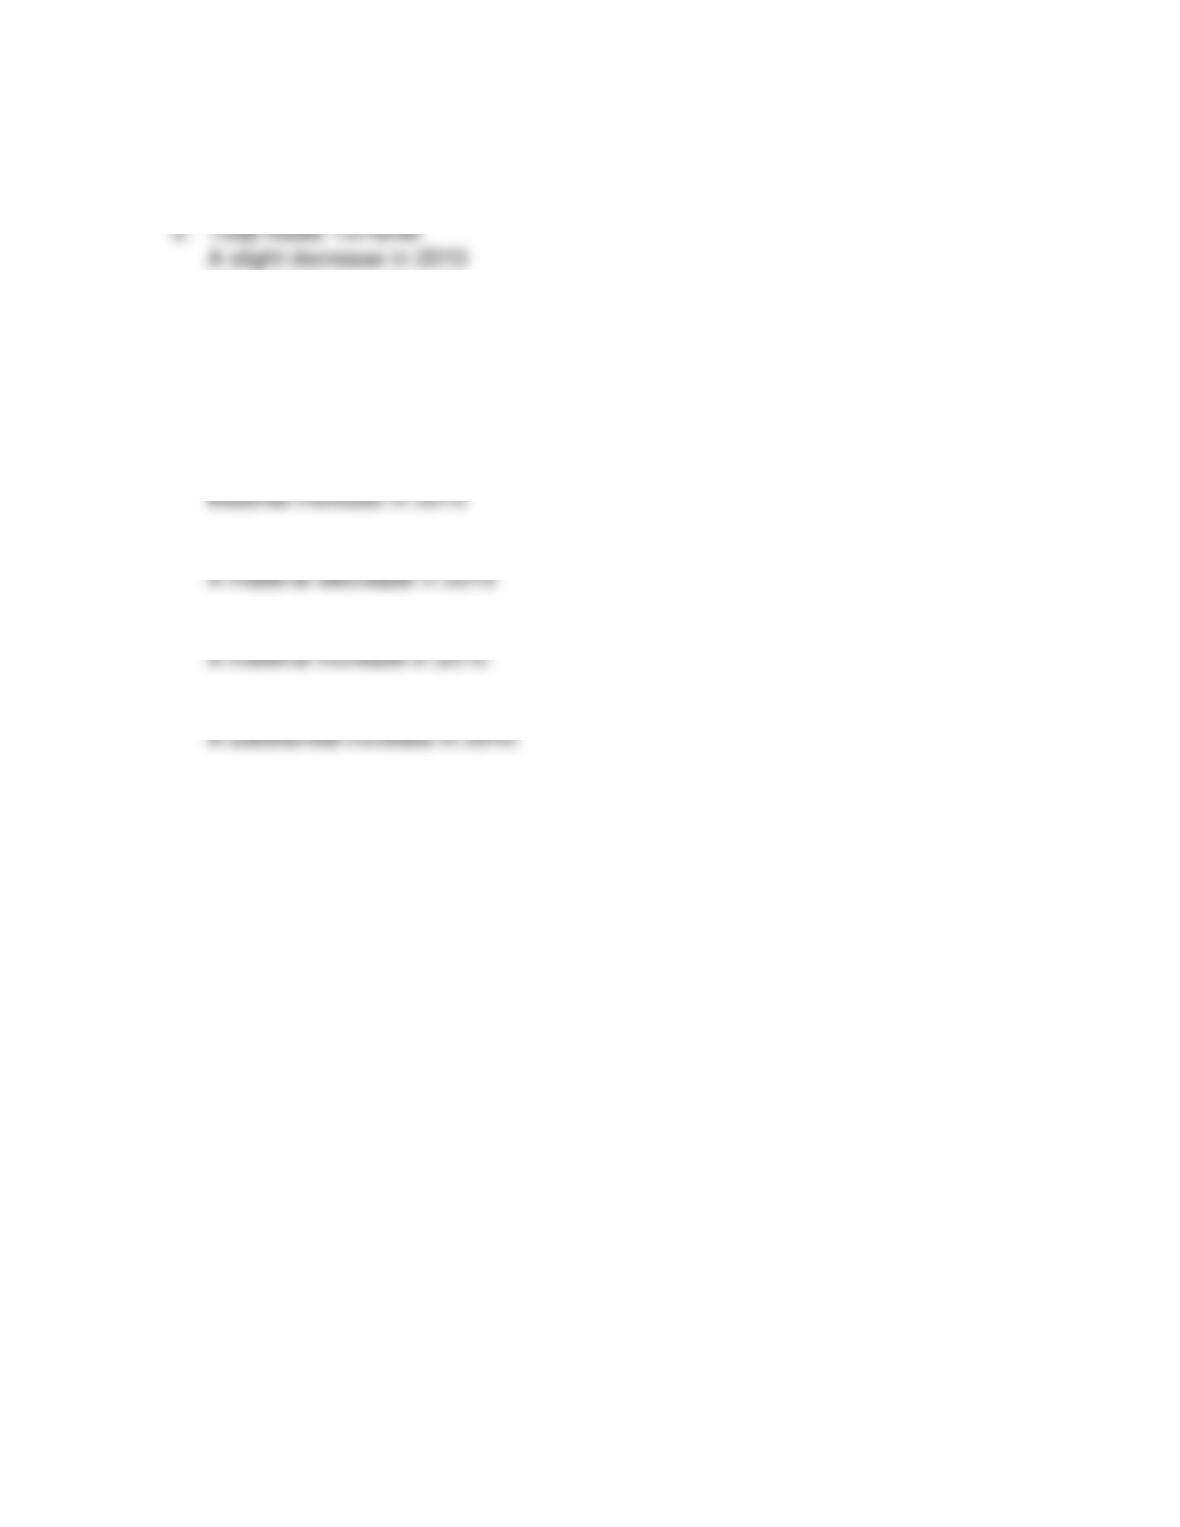
b. 1. Net Profit Margin
Material increase in 2010
3. Return on Assets
Material increase in 2010
4. Operating Income Margin
Material increase in 2010
5. Return on Operating Assets
6. Sales to Fixed Assets
7. Return on Total Equity
8. Gross Profit Margin
267
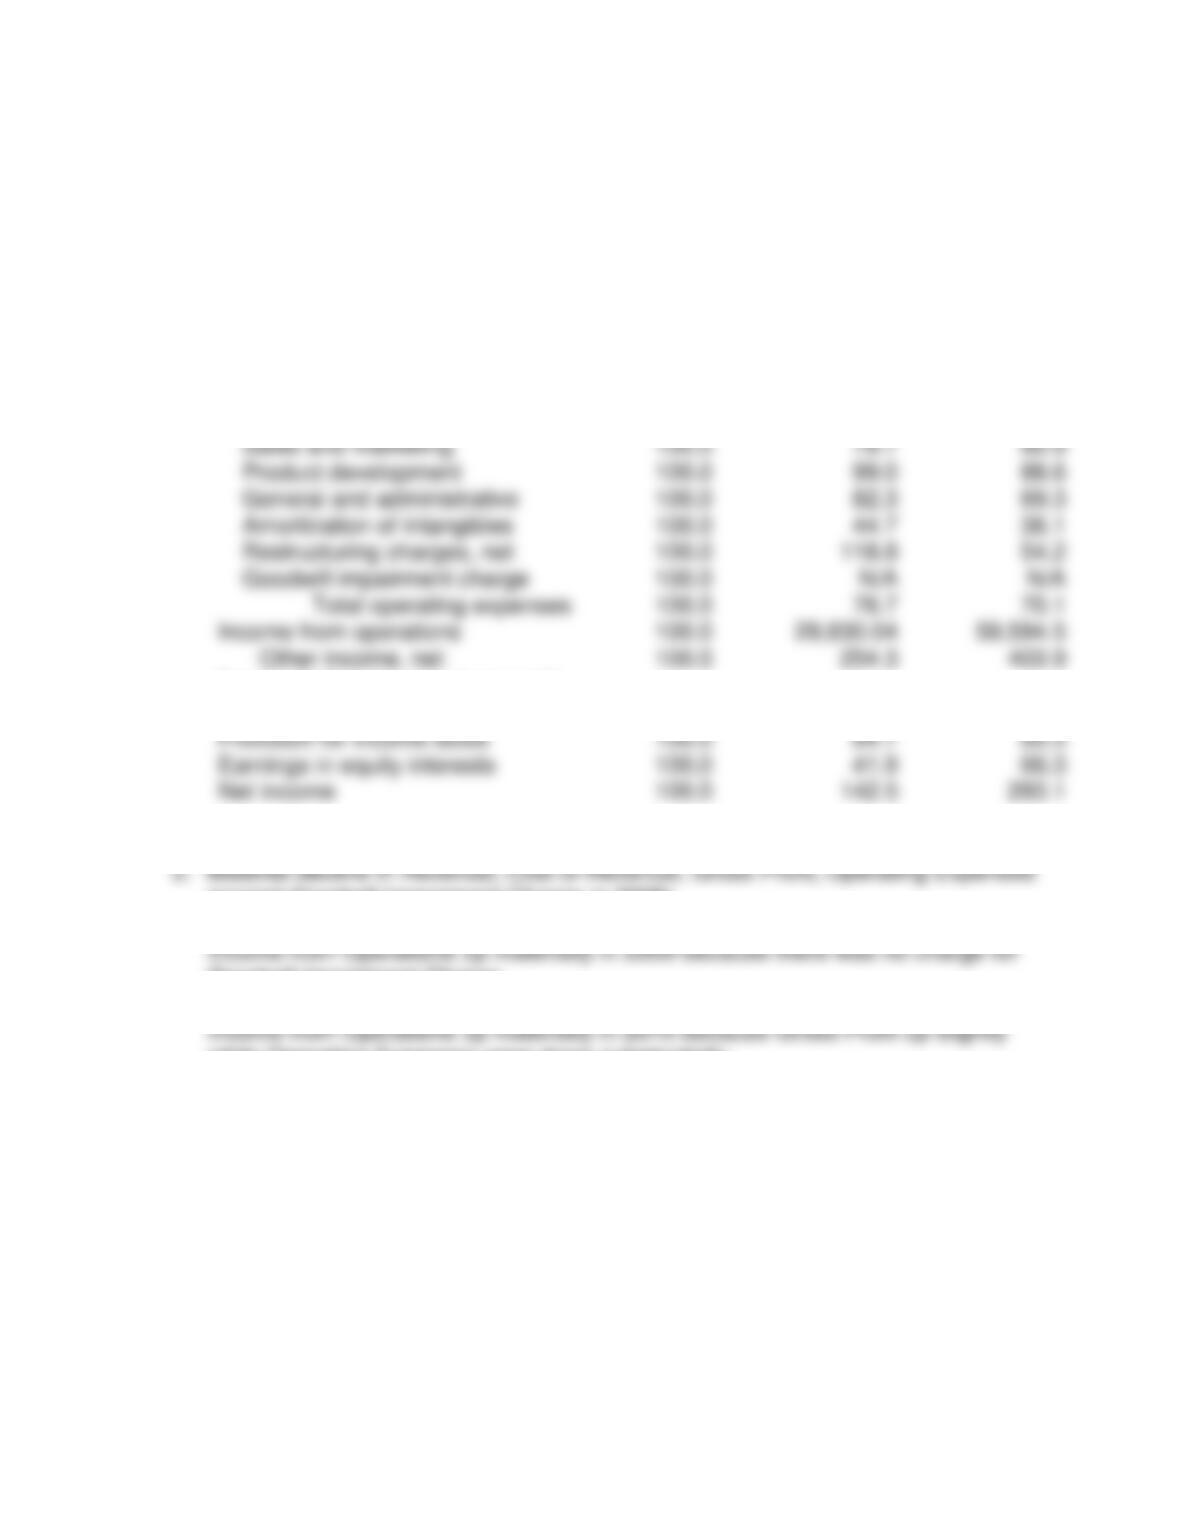
c. 1.
Yahoo Services
Consolidated Statements of Income
Horizontal Common-Size 2008 – 2010
2008
2009
2010
Revenues
100.0
%
89.6
%
87.7
%
Cost of revenues
100.0
95.0
86.9
Gross profit
100.0
85.7
88.3
Operating expenses:
Sales and marketing
100.0
79.7
80.9
Product development
100.0
99.0
88.6
General and administrative
100.0
82.3
69.3
Amortization of intangibles
100.0
44.7
36.1
Restructuring charges, net
100.0
118.8
54.2
Goodwill impairment charge
100.0
N/A
N/A
Total operating expenses
100.0
76.7
70.1
Income from operations
100.0
29,830.04
59,594.5
Other income, net
100.0
254.3
403.9
Income before income taxes and
earnings in equity interests
100.0
662.2
1,234,4
Provision for income taxes
100.0
84.7
85.5
Earnings in equity interests
100.0
41.9
66.3
Net income
100.0
142.5
293.1
(except Goodwill Impairment Charge in 2008).
Goodwill Impairment Charge.
while Operating Expenses were down substantially.