252
12.
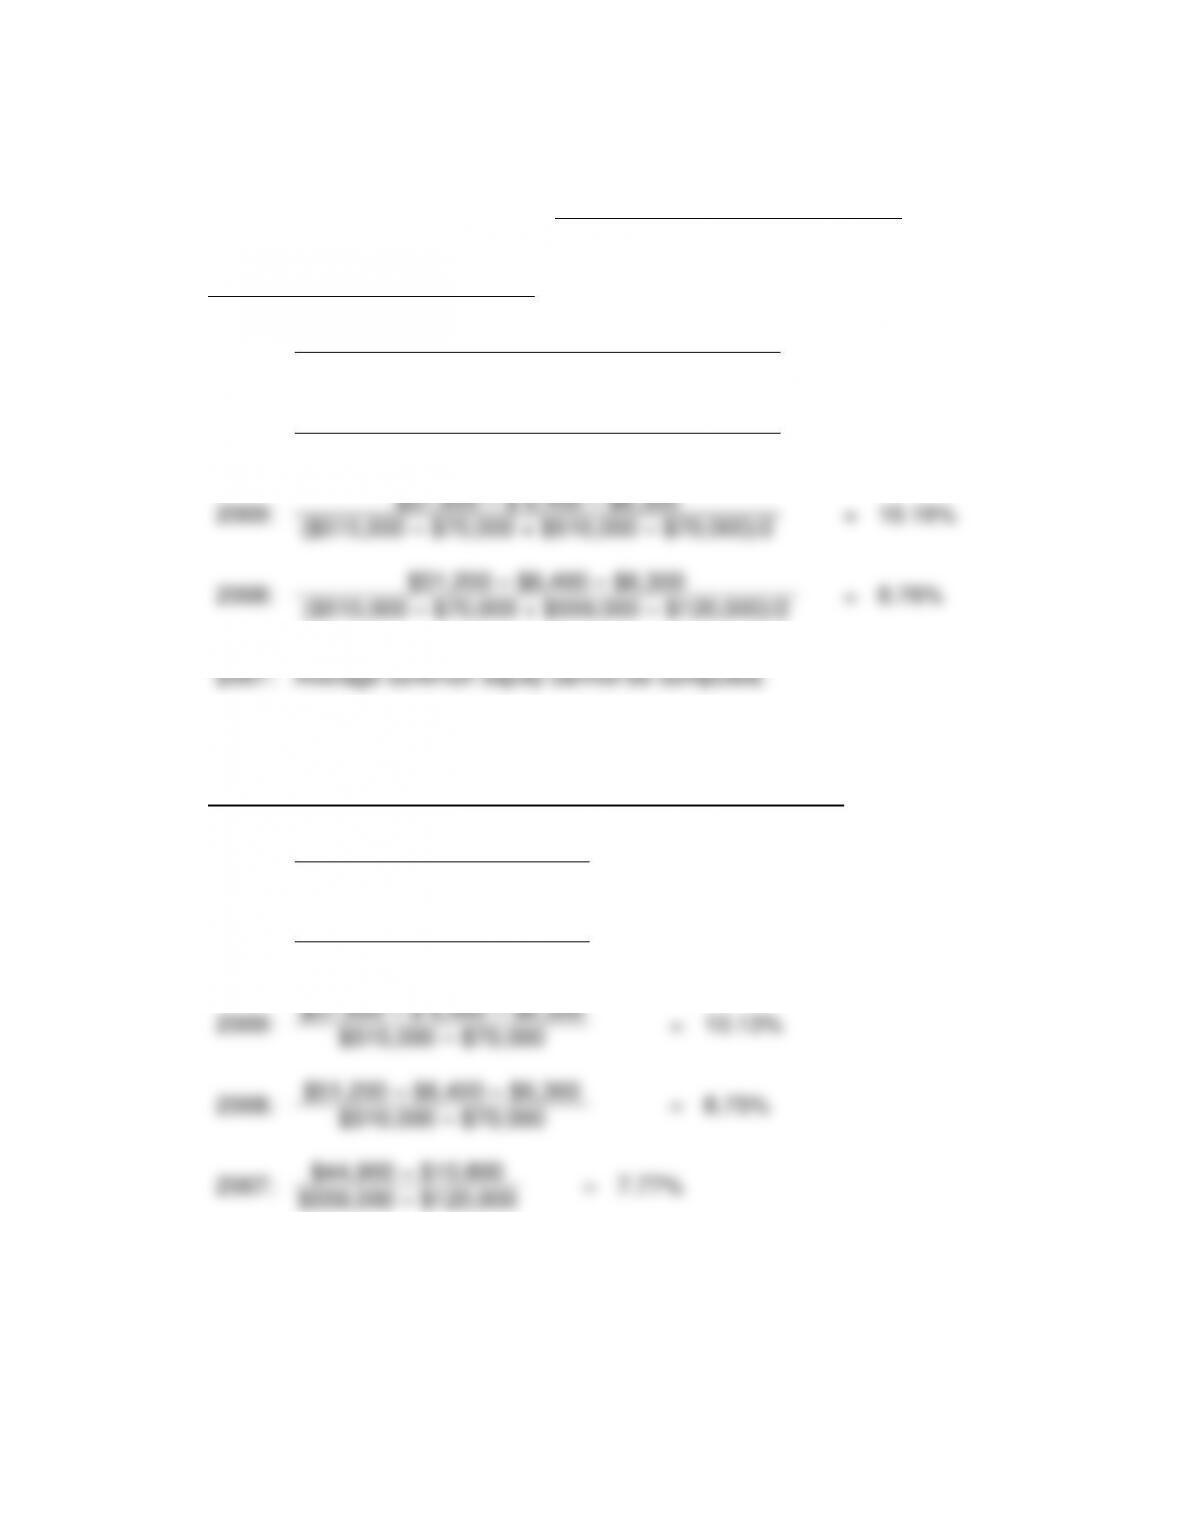
Return on Common Equity
=
Net Income Before Nonrecurring
Items – Preferred Dividends
Average Common Equity
Average Balance Sheet Figures
2011:
$72,700 – $6,400 – $6,300
=
13.36%
($520,000 – $70,000 + $518,000 – $70,200)/2
2010:
$64,900 – $6,400 – $6,300
=
11.69%
($518,000 – $70,000 + $515,000 – $70,000)/2
2009:
$57,800 – $ 6,400 – $6,300
=
10.19%
($515,000 – $70,000 + $510,000 – $70,000)/2
2008:
$51,200 – $6,400 – $6,300
=
8.76%
($510,000 – $70,000 + $559,000 – $120,000)/2
2007:
Average common equity cannot be computed.
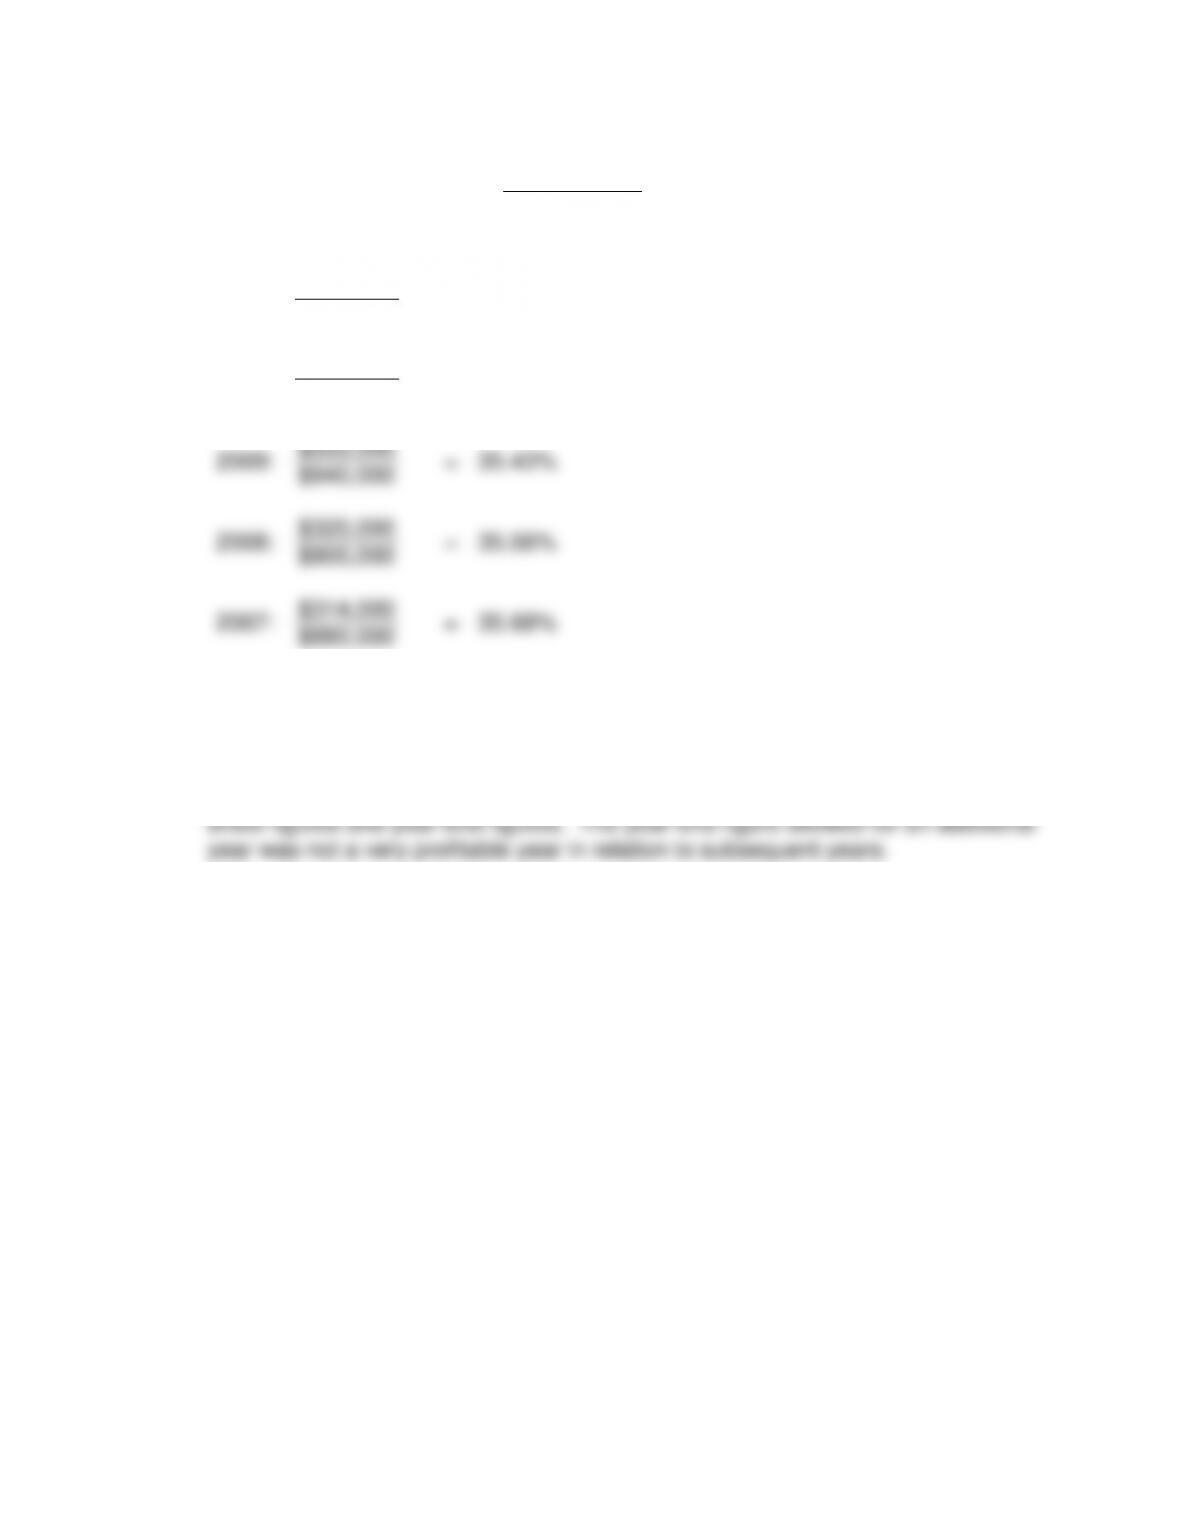
Year-End Balance Sheet Figures – Return on Common Equity
2011:
$72,700 – $6,400 – $6,300
=
13.33%
$520,000 – $70,000
2010:
$64,900 – $6,400 – $6,300
=
11.65%
$518,000 – $70,000
2009:
$57,800 – $ 6,400 – $6,300
=
10.13%
$515,000 – $70,000
2008:
$51,200 – $6,400 – $6,300
=
8.75%
$510,000 – $70,000
2007:
$44,900 – $10,800
=
7.77%
$559,000 – $120,000
13.
Gross Profit Margin
=
Gross Profit
Net Sales
2011:
$355,000
=
36.22%
$980,000
2010:
$344,000
=
35.83%
$960,000
2009:
$333,000
=
35.43%
$940,000
2008:
$320,000
=
35.56%
$900,000
2007:
$314,000
=
35.68%
$880,000
254
PROBLEM 8 – 13
a.
4
Interest expense represents a recurring item.
b.
5
Ideally, return on common equity will indicate the highest return. This is the
way it should be since the common equity holders take the most risk.
c.
3
A selling price increase would increase the gross profit.
d.
2
It would not be feasible to estimate administrative expenses by using gross
profit analysis.
e.
2
Total asset turnover measures the ability of the firm to generate sales through
the use of assets.
f.
4
Equity earnings can represent a problem in analyzing profitability because
equity earnings are not from operations.
g.
1
Intangibles are not considered to be an operating asset.
h.
4
Earnings based on percent of holdings by outside owners of consolidated
subsidiaries are termed minority earnings.
i.
1
Net profit margin x total asset turnover measures DuPont return on assets.
j.
4
If net profit margin declines and the total asset turnover declines, then the
return on assets cannot rise.
k.
3
A reason that equity earnings create a problem in analyzing profitability is
because equity earnings are usually less than the related cash flow.
l.
3
Usually the return on common equity will have the highest percent of the ratios
listed.
m.
4
Usually the return on total assets will have the lowest percent of the ratios
listed.
n.
4
Gain from selling land will be reported on the income statement.
o.
5
None of the above describes minority share of earnings.
p.
1
Purchase of land at year-end could cause return on assets to decline when the
net profit margin is increasing. The year-end purchase of land would not have
contributed to profits.
255
PROBLEM 8 – 14
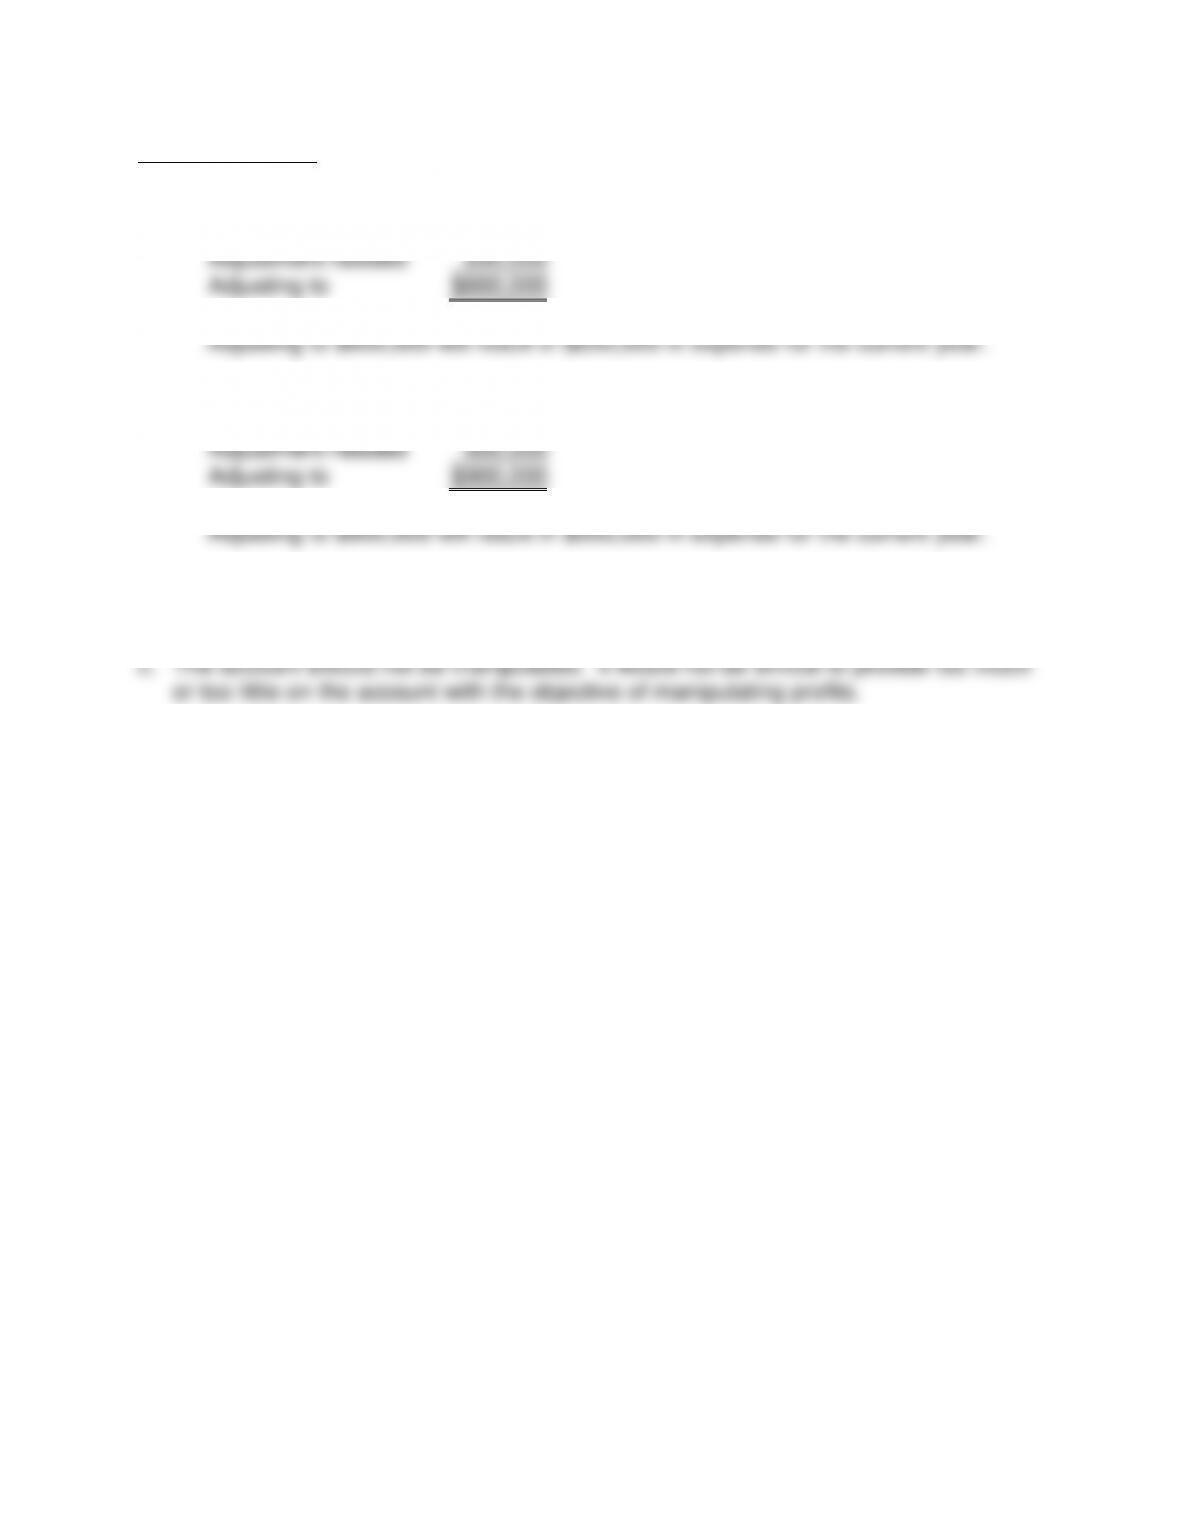
a. 1.
Balance in account
$400,000
Adjustment needed
200,000
Adjusting to
$600,000
2.
Balance in account
$400,000
Adjustment needed
500,000
Adjusting to
$900,000
b. No. Payments will result from meeting obligations. The warranty obligation account
could be too high or too low.
256
CASES
CASE 8-1 JEFF’S SELF-SERVICE STATION
Profitability Planning
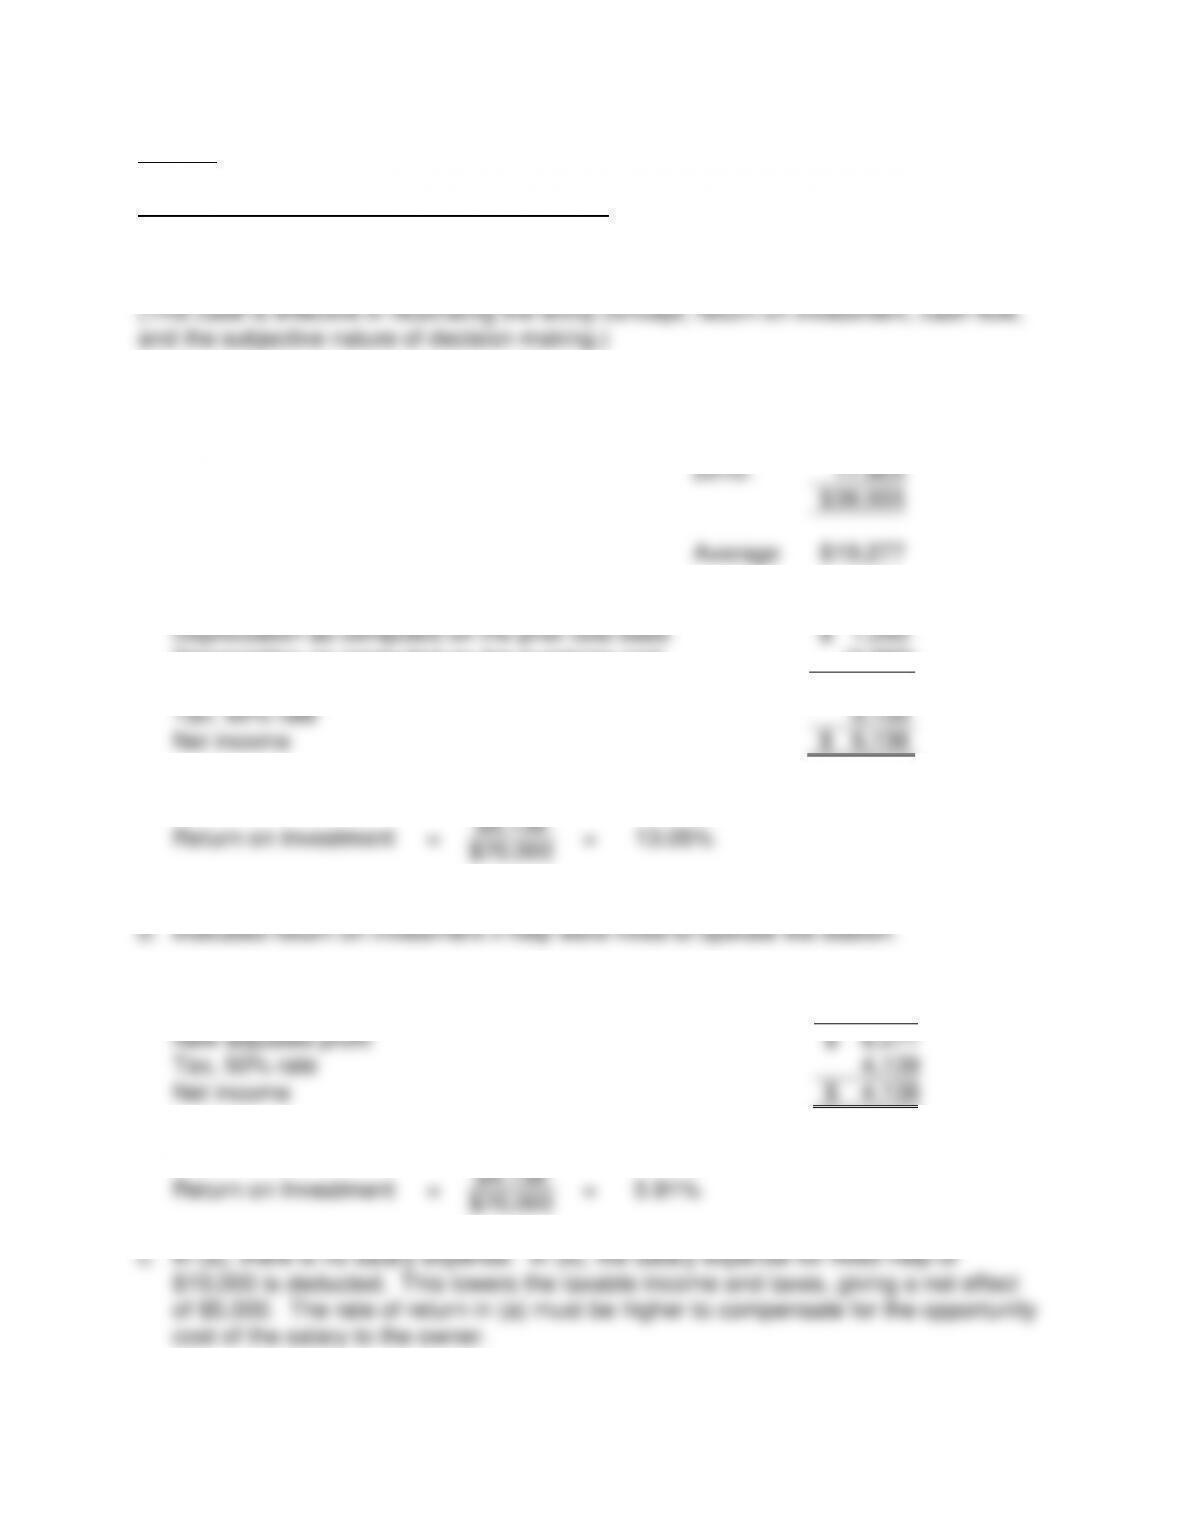
a. Indicated return on investment:
Average profit for 2011 and 2010:
2011:
$
20,630
2010:
17,925
$
38,555
Average
$
19,277
Depreciation as computed on the prior cost base
$
1,000
Depreciation as computed on the purchase cost
(2,000)
Adjusted profit
18,277
Tax, 50% rate
9,139
Net income
$
9,138
Return on Investment
=
$9,138
=
13.05%
$70,000
Adjusted profit in part (a)
$
182,77
Less cost of hired help
10,000
New adjusted profit
$
8,277
Tax, 50% rate
4,139
Net income
$
4,138
Return on Investment
=
$4,138
=
5.91%
$70,000
257
The difference between the rates of return is misleading in terms of judging the
investment. The records only reflect the actual cost, while disregarding opportunity
cost and personnel time not compensated. All costs need to be considered when
judging the investment.
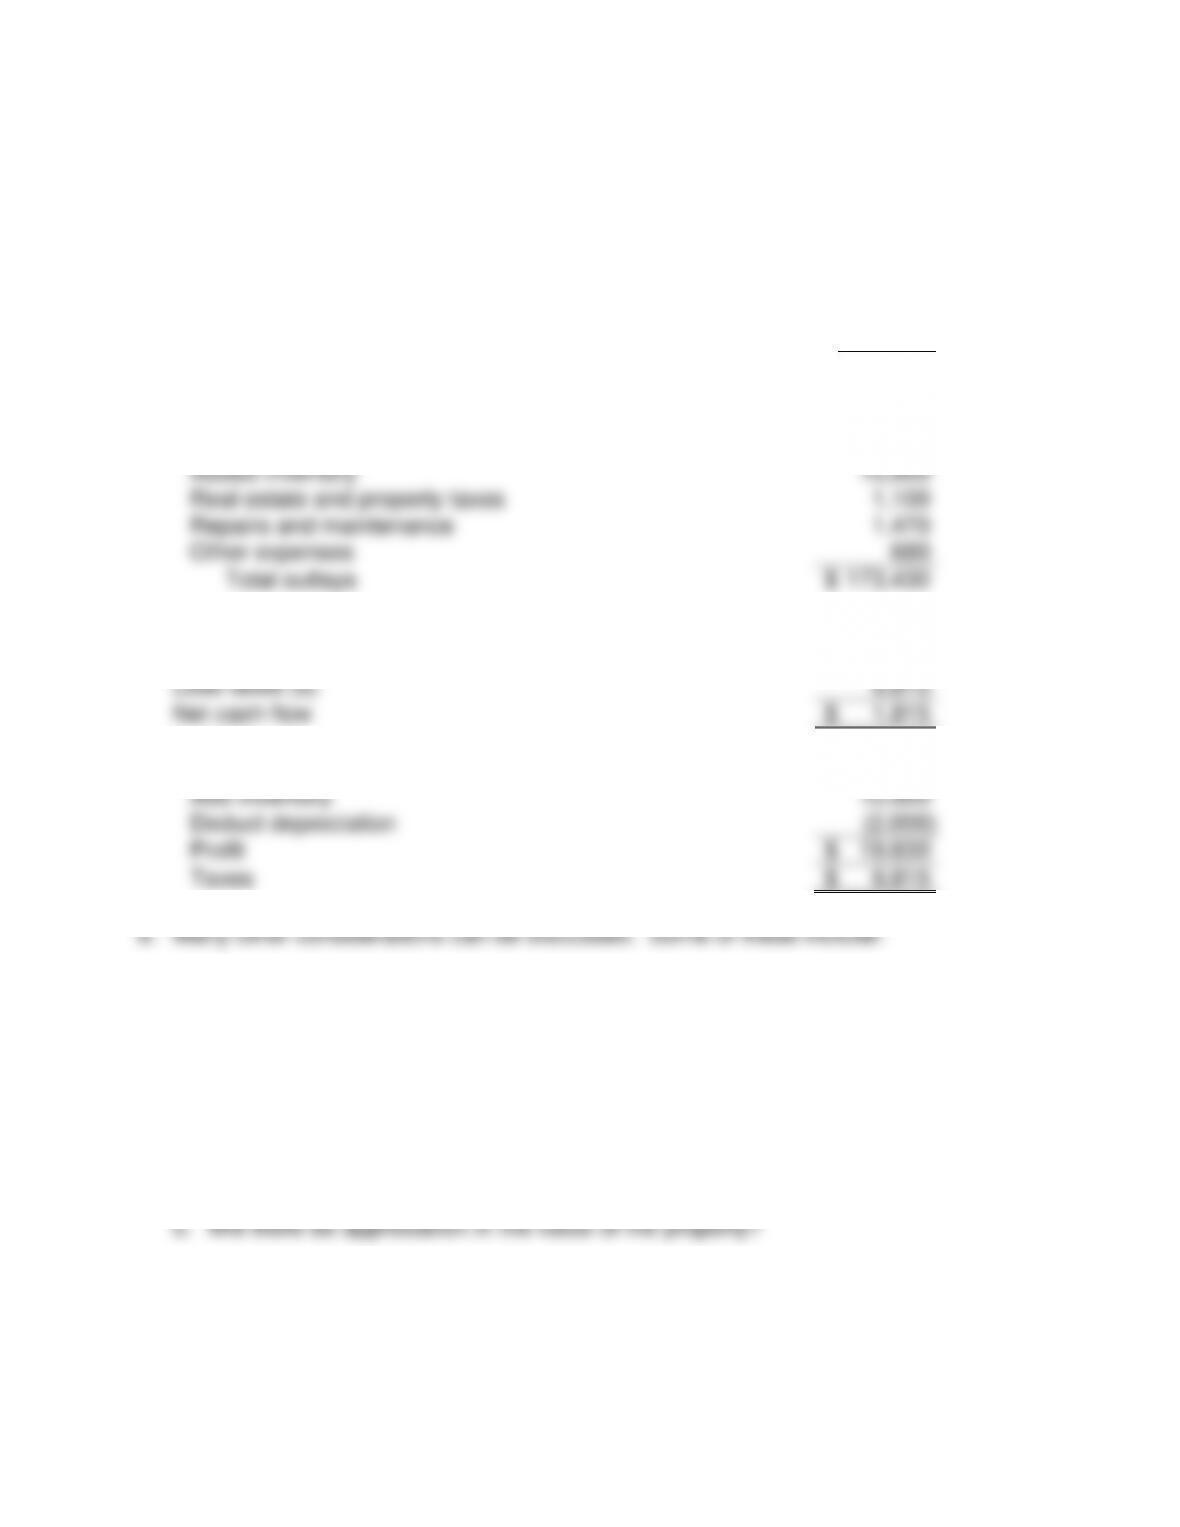
d. Indicated cash flow:
Receipts:
2012
Revenue
$
185,060
Outlays:
Cost of goods sold
160,180
Added inventory
10,000
Real estate and property taxes
1,100
Repairs and maintenance
1,470
Other expenses
680
Total outlays
$
173,430
Net cash flow, excluding tax expense
11,630
Less taxes (a)
9,815
Net cash flow
$
1,815
(a) Cash flow prior to taxes
$
11,630
Add inventory
10,000
Deduct depreciation
(2,000)
Profit
$
19,630
Taxes
$
9,815
1. Future tax rate.
2. Psychic value of owning the business.
3. Can Mr. Dearden adequately serve as manager?
4. Will he be able to maintain or increase the business that was enjoyed by Mr.
Szabo?
6. Other investment alternatives.
f. This is a subjective question. Either a yes or no answer is acceptable. This
question should be discussed in relation to the above questions.
258
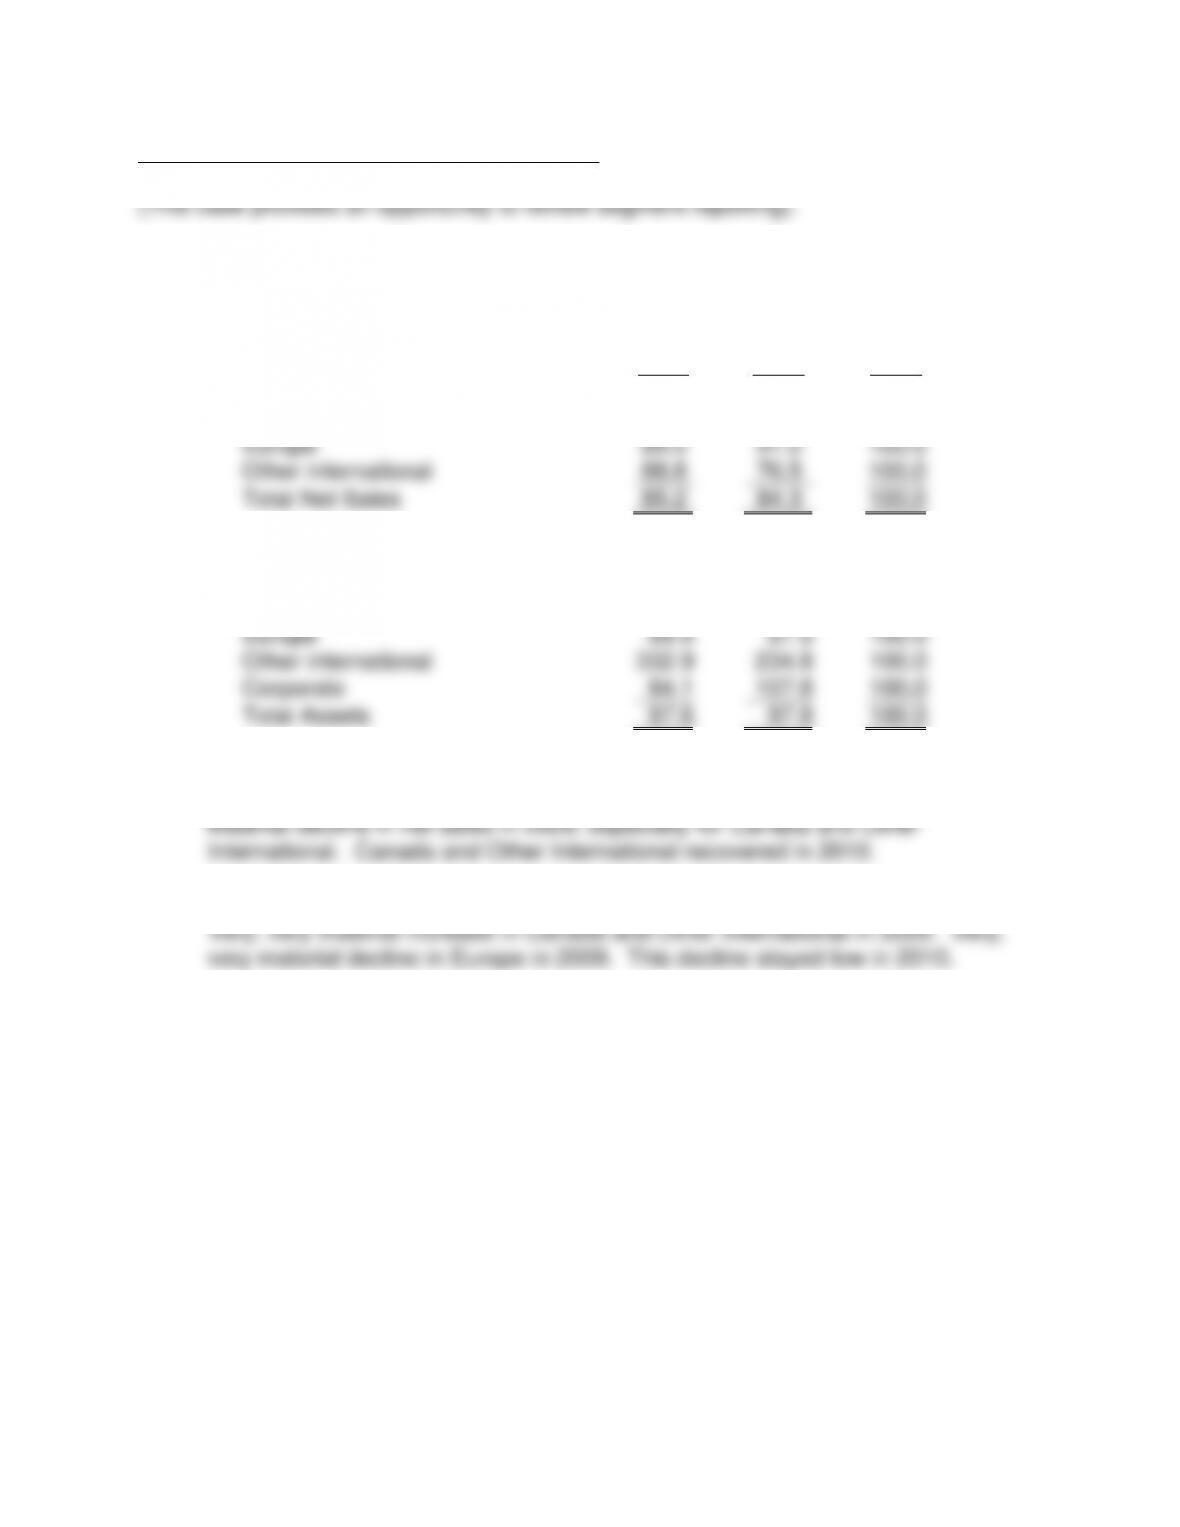
CASE 8-2 DIVERSIFIED MANUFACTURER
a.
Segment Reporting – Crane Co.
Horizontal Common-Size
Net Sales
2010
2009
2008
United States
84.2
84.4
100.0
Canada
80.9
74.0
100.0
Europe
89.0
91.2
100.0
Other international
88.8
76.5
100.0
Total Net Sales
85.2
84.3
100.0
Assets
United States
98.9
89.0
100.0
Canada
137.4
152.6
100.0
Europe
69.5
67.5
100.0
Other international
332.9
234.8
100.0
Corporate
84.1
107.8
100.0
Total Assets
97.6
97.8
100.0
b. Net Sales
Assets
259
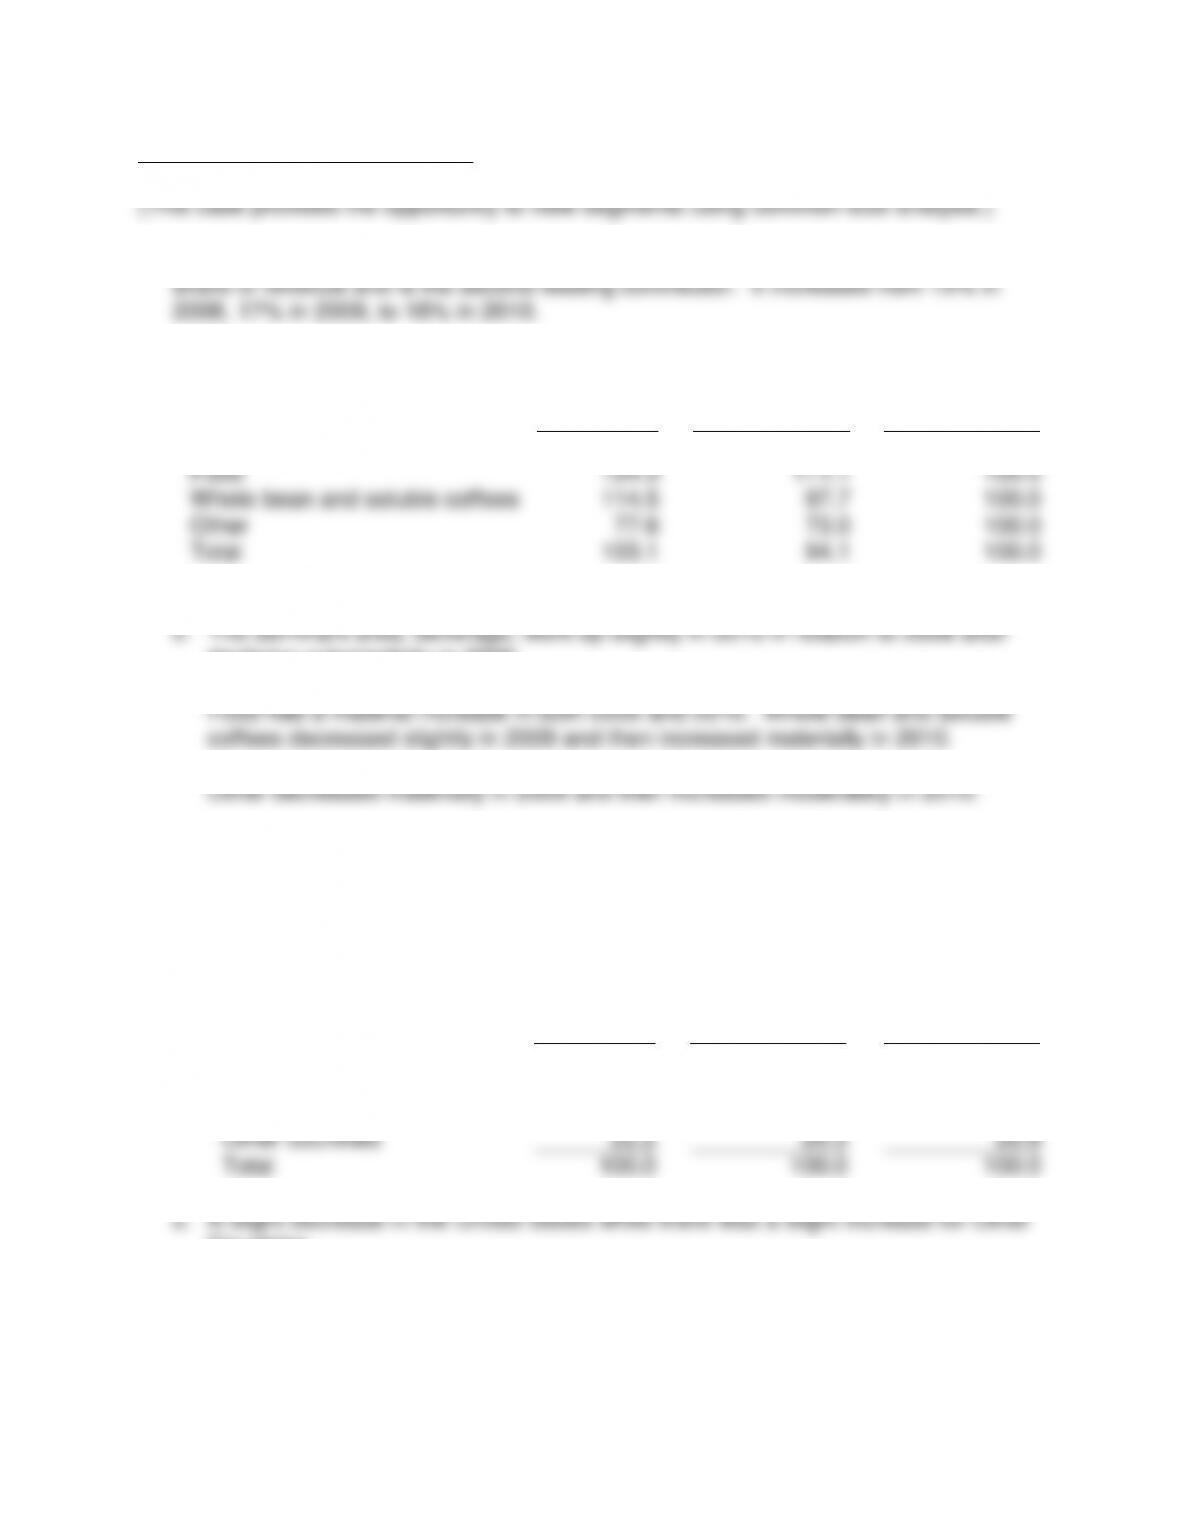
CASE 8-3 LEADING ROASTER
a. Beverage represents approximately 64% of revenue. Food represents an increasing
b. 1.
October 3,
2010
September 27,
2009
September 28,
2008
Beverage
103.3
93.6
100.0
Food
124.3
111.1
100.0
Whole bean and soluble coffees
114.5
97.7
100.0
Other
77.6
73.0
100.0
Total
103.1
94.1
100.0
declining substantially in 2009.
Total only had a slight increase when comparing 2010 with 2008. It decreased
substantially in 2009 and then increased materially in 2010.
c. 1. Vertical Common Size
October 3,
2010
September 27,
2009
September 28,
2008
Net revenues from external
customers:
United States
77.8
79.7
79.2
Other countries
22.2
20.3
20.8
Total
100.0
100.0
100.0
Countries.
260
3. Horizontal Common-Size
October 3,
2010
September 27,
2009
September 28,
2008
Net revenues from external
customers:
United States
101.3
94.7
100.0
Other countries
110.0
92.2
100.0
Total
103.1
94.1
100.0
increased materially in 2010.
d. 1. Vertical Common-Size Long-Lived Assets
October 3,
2010
September 27,
2009
September 28,
2008
Long-Lived Assets:
United States
77.4
78.4
79.0
Other countries
22.6
21.6
21.0
Total
100.0
100.0
100.0
3.
October 3,
2010
September 27,
2009
September 28,
2008
Long-Lived Assets:
United States
90.6
89.6
100.0
Other countries
99.6
92.7
100.0
Total
92.5
90.2
100.0

261
CASE 8-4 CERTIFIED ORGANIC
a.
1.
Net Profit Margin
=
Net Income Before Noncontrolling Interest,
Equity Income and Nonrecurring Items
Net Sales
2010
2009
$245,833
$146,804
$9,005,794
$8,031,620
2.73%
1.83%
2.
Total Asset Turnover
=
Net Sales
Year End Total Assets
2010
2009
$9,005,794
$8,031,620
$3,986,540
$3,783,388
2.26%
2.12%
3.
Return on Assets
=
Net Income Before Noncontrolling Interest,
Equity Income and Nonrecurring Items
Year End Total Assets
2010
2009
$245,833
$146,804
$3,986,540
$3,783,388
6.17%
3.88%
4.
Operating Income Margin
=
Operating Income
Net Sales
2010
2009
$437,975
$284,349
$9,005,794
$8,031,620
4.86%
3.54%