232
5.
Operating Income Margin
=
Operating Income
Net Sales
2011
2010
2009
(2) Net sales
$
1,600,000
$
1,300,000
$
1,200,000
Less:
Material and manufacturing
costs of products sold
740,000
624,000
576,000
Research and development
90,000
78,000
71,400
General and selling
600,000
500,500
465,000
$
1,430,000
$
1,202,500
$
1,112,400
(1) Operating income
$
170,000
$
97,500
$
87,600
(1) Divided by (2)
10.63%
7.50%
7.30%
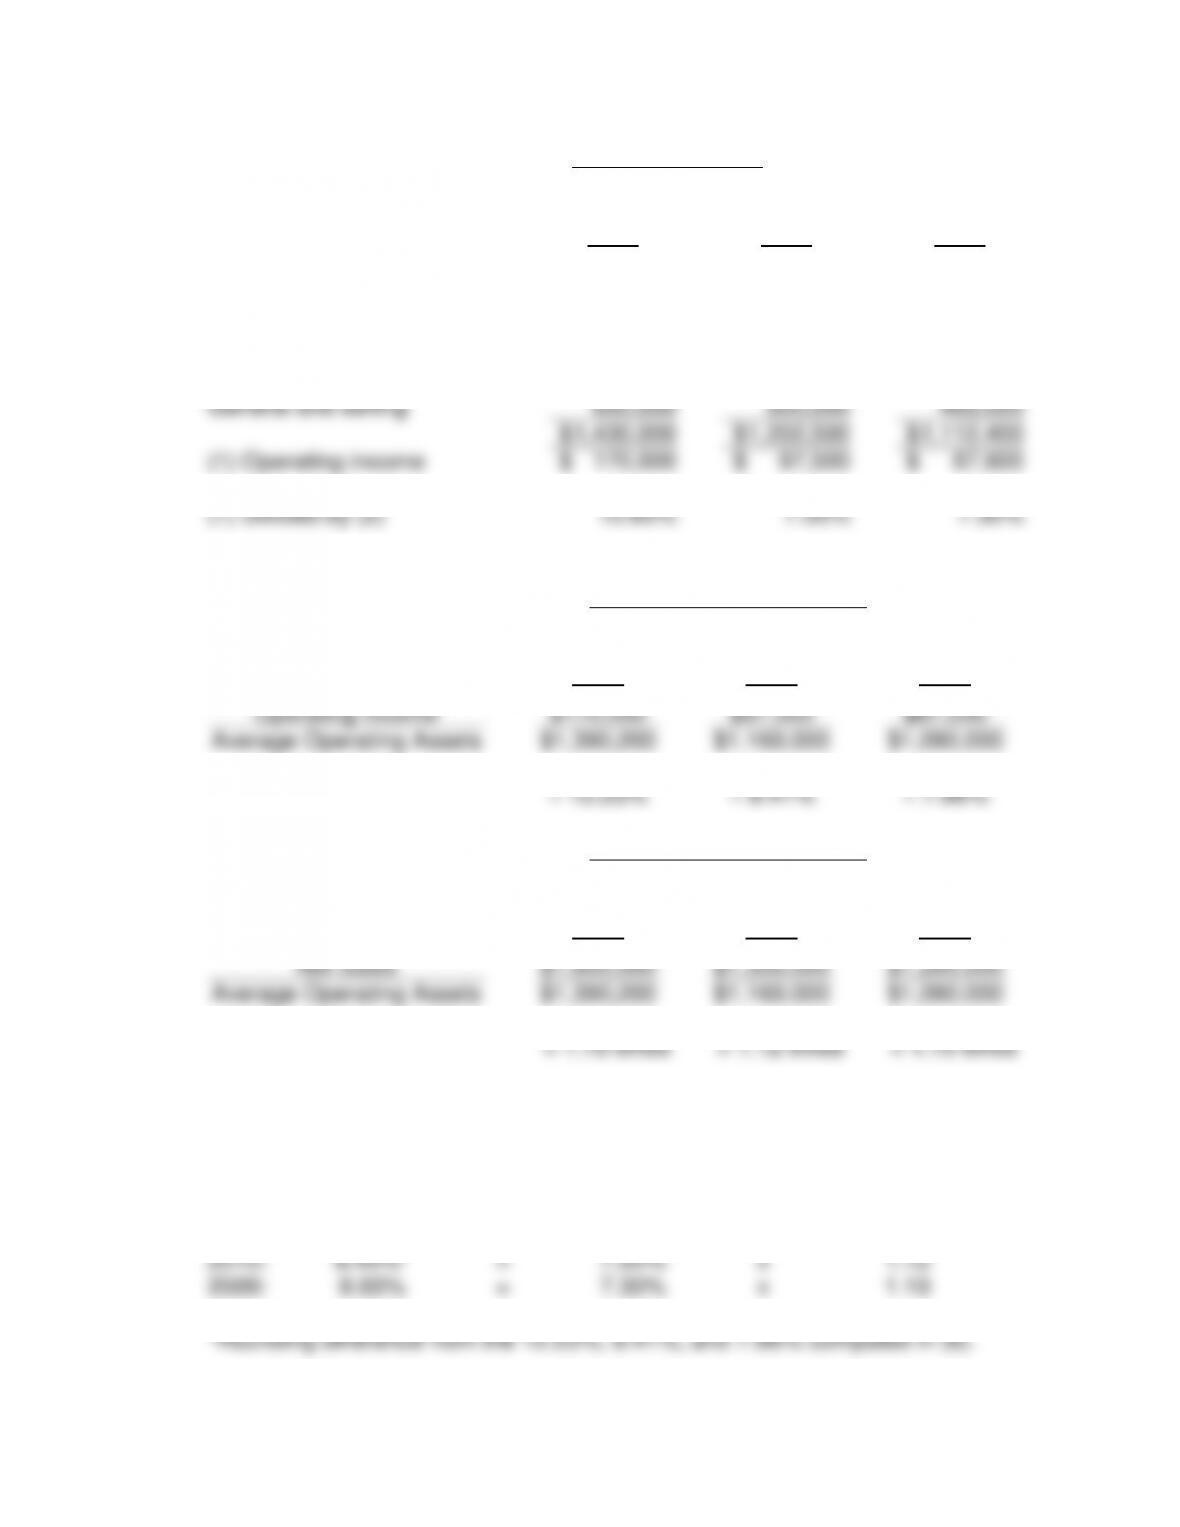
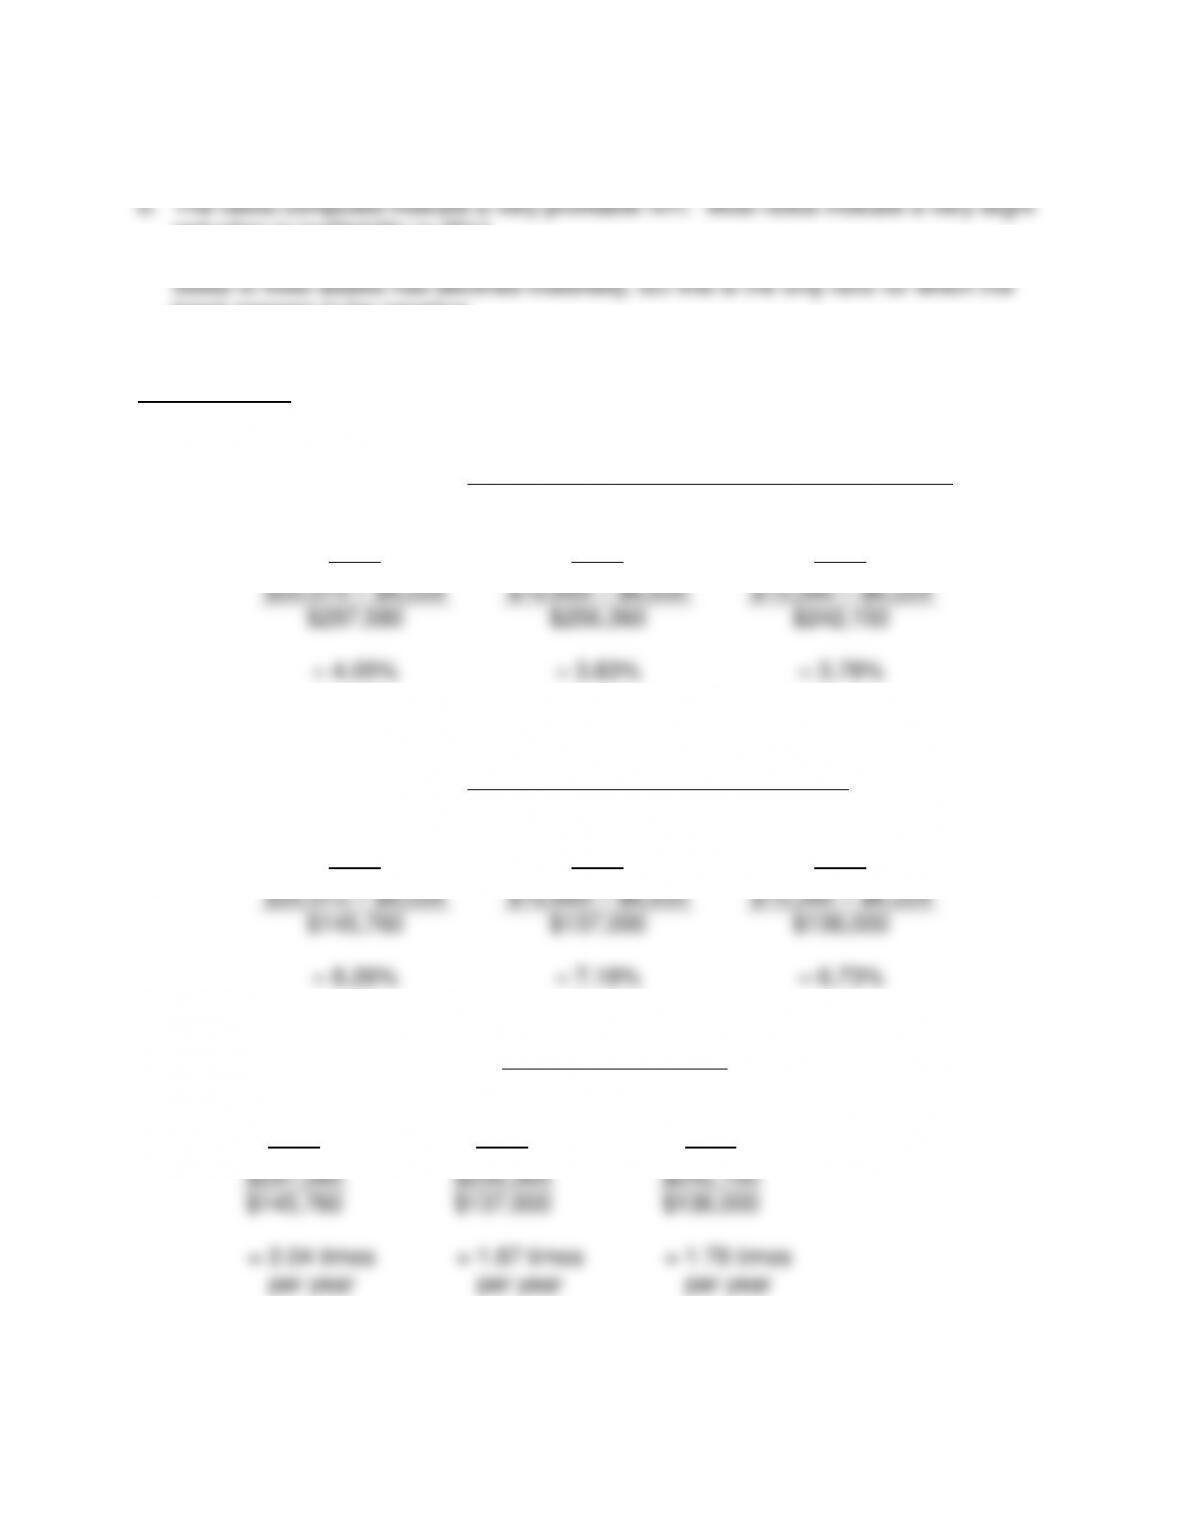
6.
Return on Operating Assets
=
Operating Income
Average Operating Assets
2011
2010
2009
Operating Income
$170,000
$97,500
$87,000
Average Operating Assets
$1,390,200
$1,160,000
$1,090,000
= 12.23%
= 8.41%
= 7.98%
7.
Operating Asset Turnover
=
Net Sales
Average Operating Assets
2011
2010
2009
Net Sales
$1,600,000
$1,300,000
$1,200,000
Average Operating Assets
$1,390,200
$1,160,000
$1,090,000
= 1.15 times
= 1.12 times
= 1.10 times
8. DuPont Analysis with operating ratios
Return on
Operating Assets
=
Net Profit Margin
x
Total Asset Turnover
2011:
12.22%*
=
10.63%
x
1.15
2010:
8.40%*
=
7.50%
x
1.12
2009:
8.03%
=
7.30%
x
1.10
233
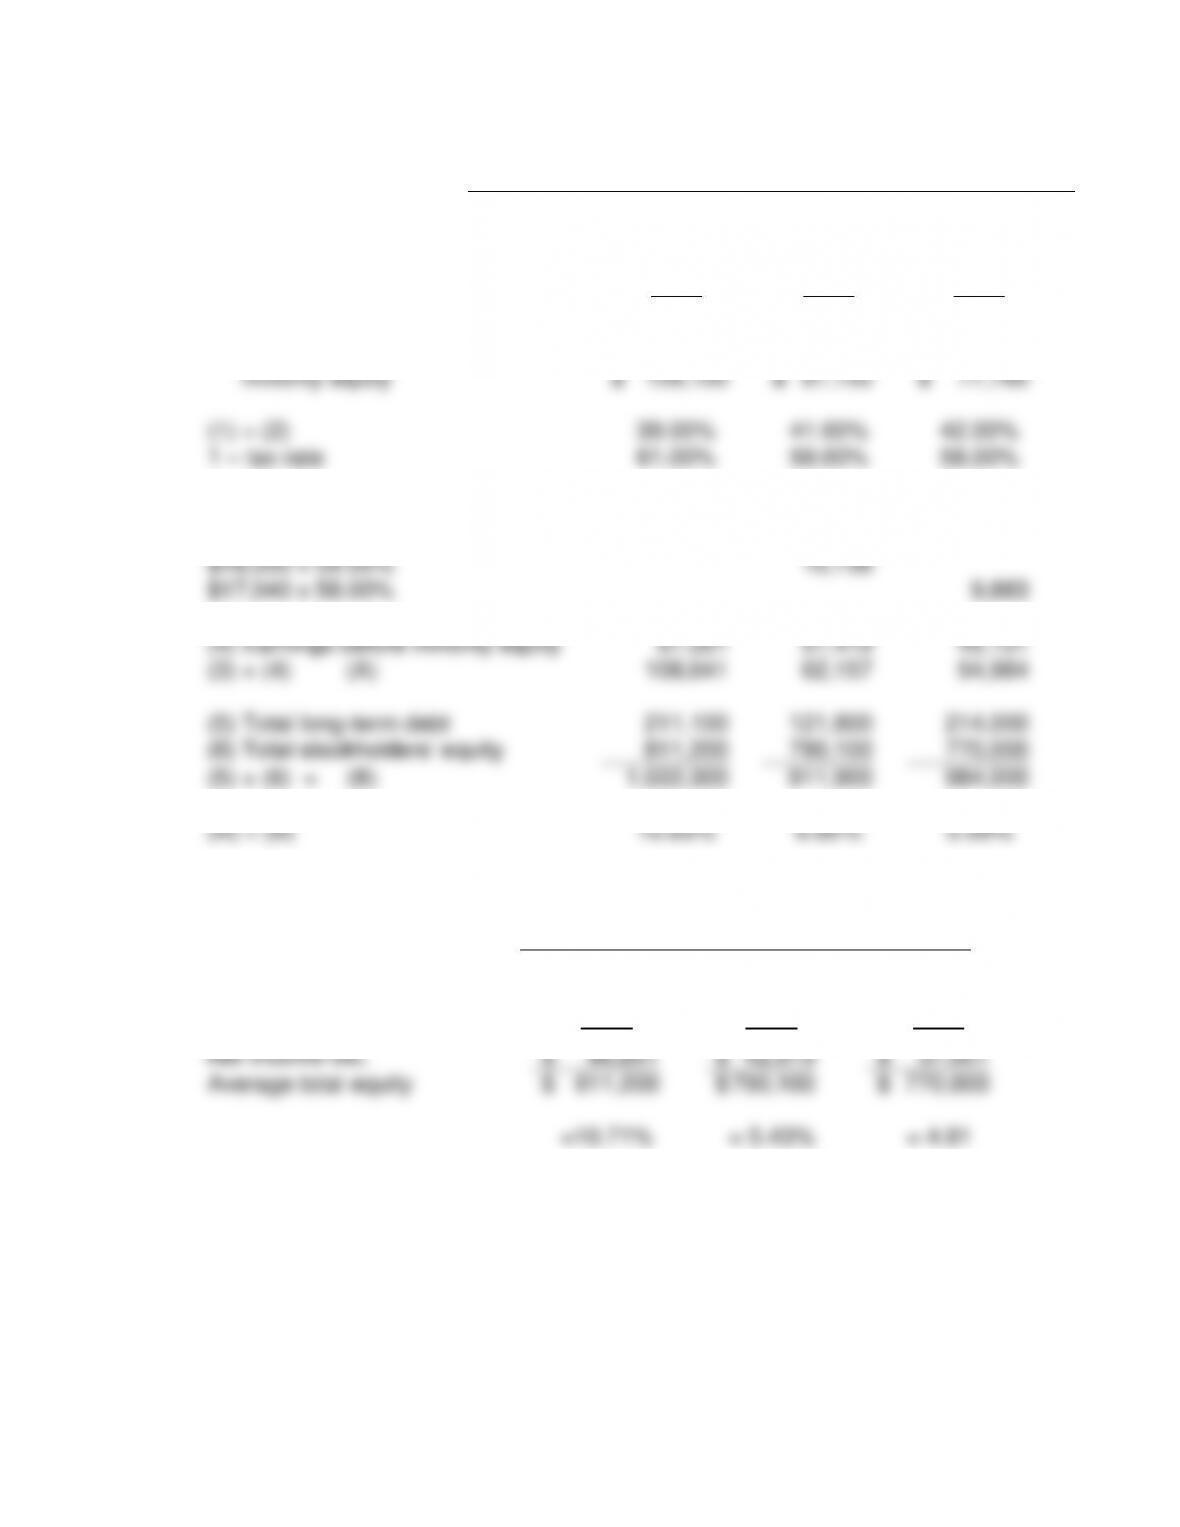
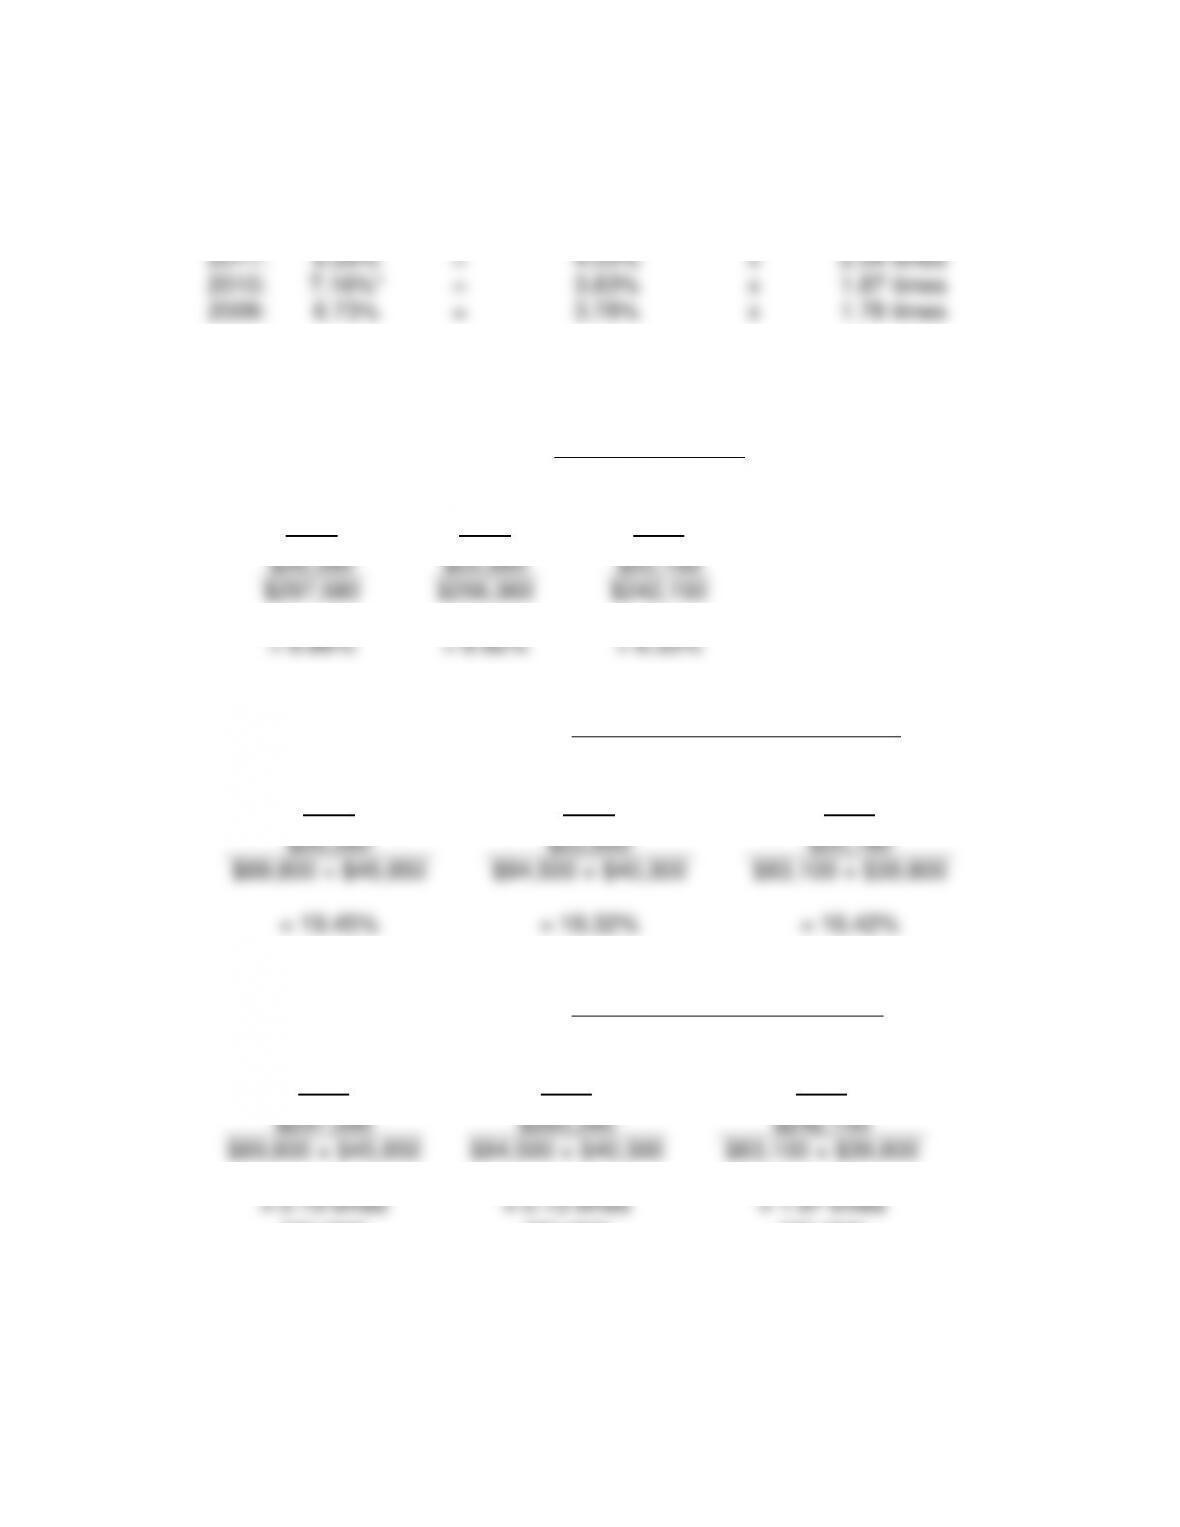
9.
Return on Investment
=
Net Income Before Minority Share of Earnings and
Nonrecurring Items + [(Interest Expense) x (1 – Tax Rate)]
Average (Long-Term Liabilities) + Equity
Estimated tax rate:
2011
2010
2009
(1) Provision for income taxes
$
62,049
$
35,731
$
32,659
(2) Earnings before income taxes and
minority equity
$
159,100
$
87,150
$
77,760
(1) ÷ (2)
39.00%
41.00%
42.00%
1 – tax rate
61.00%
59.00%
58.00%
(3) Interest expense x (1 – tax rate)
$19,000 x 61.00%
11,590
$18,200 x 59.00%
10,738
$17,040 x 58.00%
9,883
(4) Earnings before minority equity
97,051
51,419
45,101
(3) + (4) (A)
108,641
62,157
54,984
(5) Total long-term debt
211,100
121,800
214,000
(6) Total stockholders’ equity
811,200
790,100
770,000
(5) + (6) = (B)
1,022,300
911,900
984,000
(A) ÷ (B)
10.63%
6.82%
5.59%
10.
Return on Total Equity
=
Net Income Before Nonrecurring Items –
Dividends on Redeemable Preferred Stock
Average Total Equity
2011
2010
2009
Net income etc.
$
86,851
$
42,919
$
37,001
Average total equity
$
811,200
$
790,100
$
770,000
=10.71%
= 5.43%
= 4.81
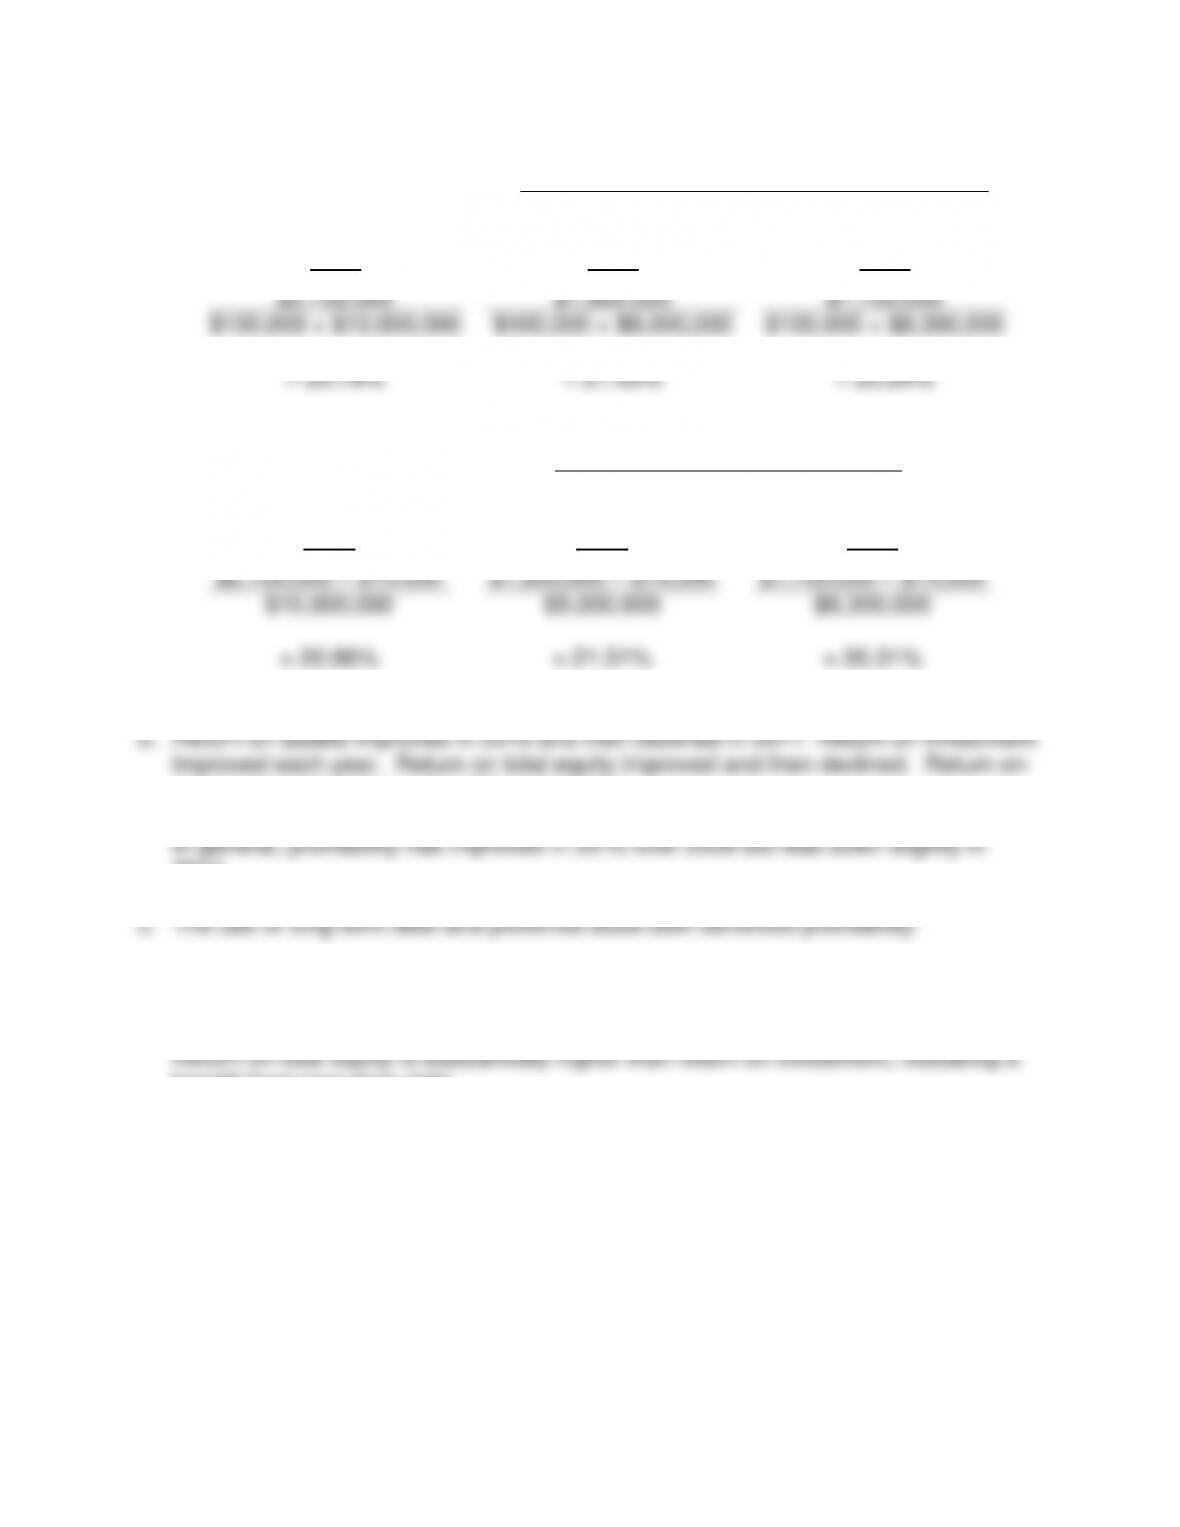
b. All ratios computed indicate a significant improvement in profitability.
234
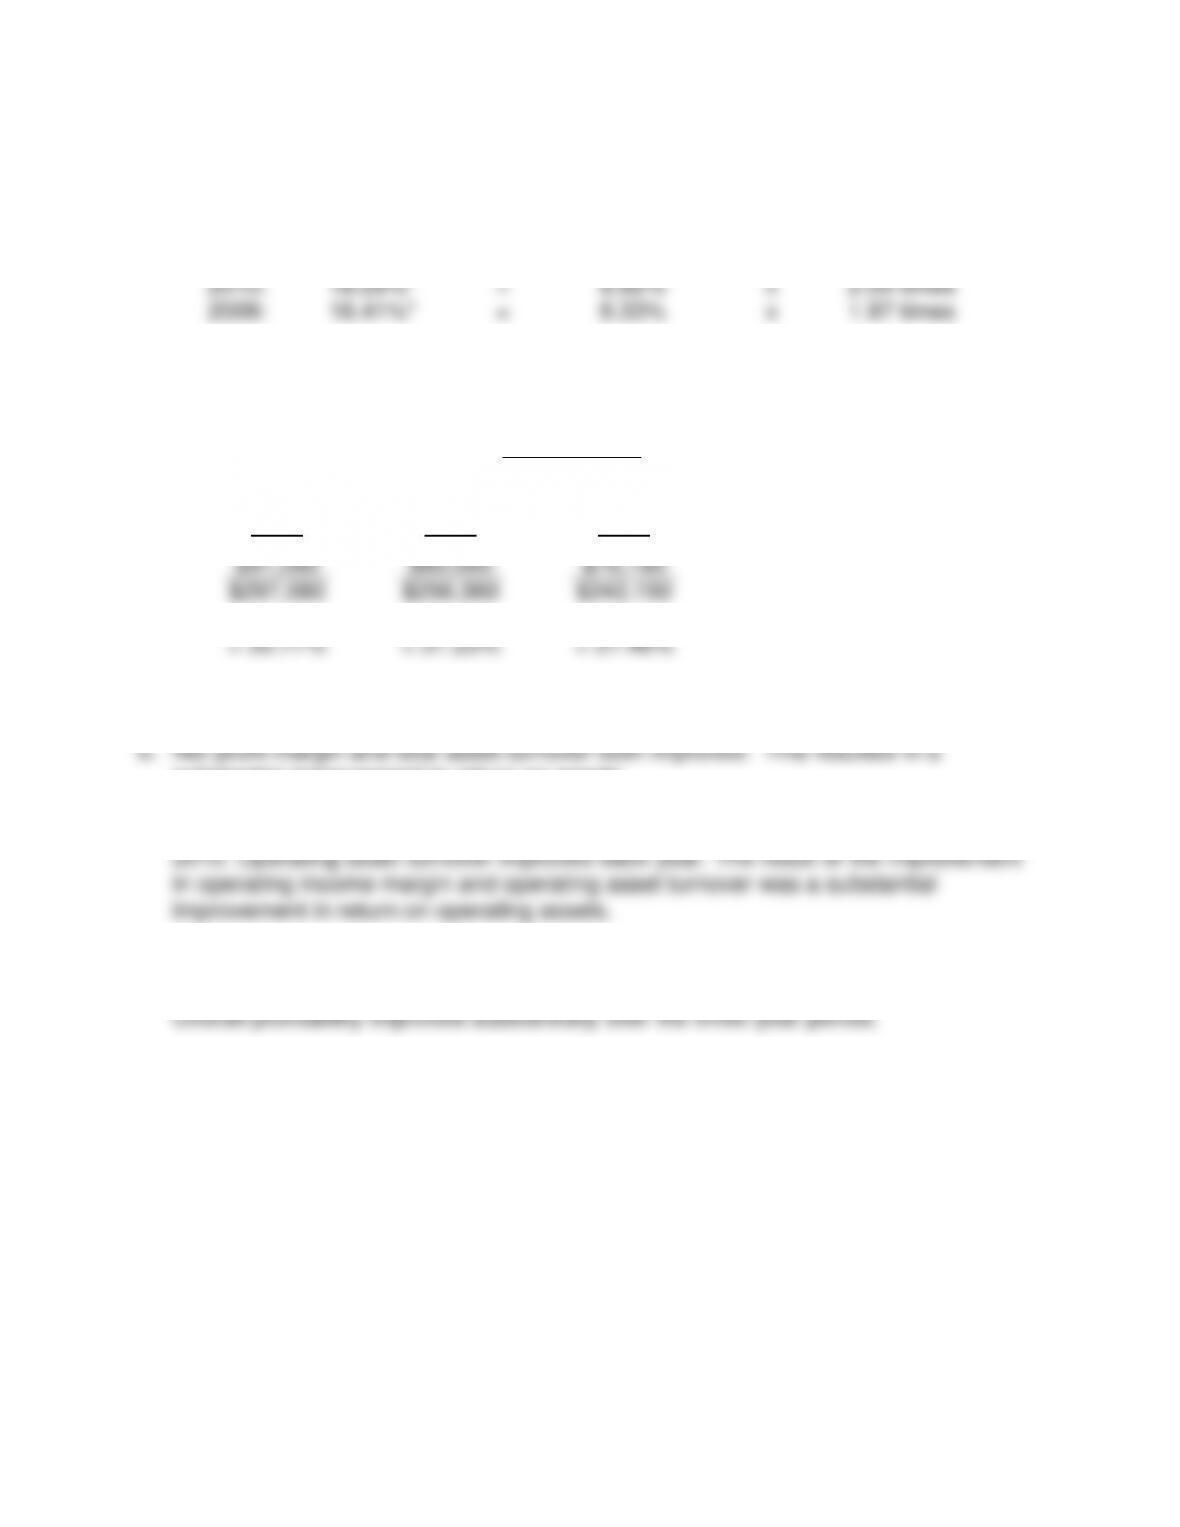
PROBLEM 8-7
a.
1.
Net Profit Margin
=
Net Income Before Noncontrolling Interest,
Equity Income and Nonrecurring Items
Net Sales
2011
2010
2009
$171,115
$163,497
$143,990
$1,002,100
$980,500
$900,000
= 17.08%
= 16.67%
= 16.00%
2.
Return on Assets
=
Net Income Before Noncontrolling
Interest and Nonrecurring Items
Average Total Assets
2011
2010
2009
$171,115
$163,497
$143,990
$839,000
$770,000
$765,000
= 20.40%
= 21.23%
= 18.82%
3.
Total Asset Turnover
=
Net Sales
Average Total Assets
2011
2010
2009
$1,002,100
$980,500
$900,000
$839,000
$770,000
$765,000
= 1.19 times
per year
= 1.27 times
per year
= 1.18 times
per year
4. DuPont Analysis
Return on
Assets
=
Net Profit
Margin
x
Total Asset
Turnover
2011:
20.33%*
=
17.08%
x
1.19 times per year
2010:
21.17%*
=
16.67%
x
1.27 times per year
2009:
18.88%*
=
16.00%
x
1.18 times per year
235
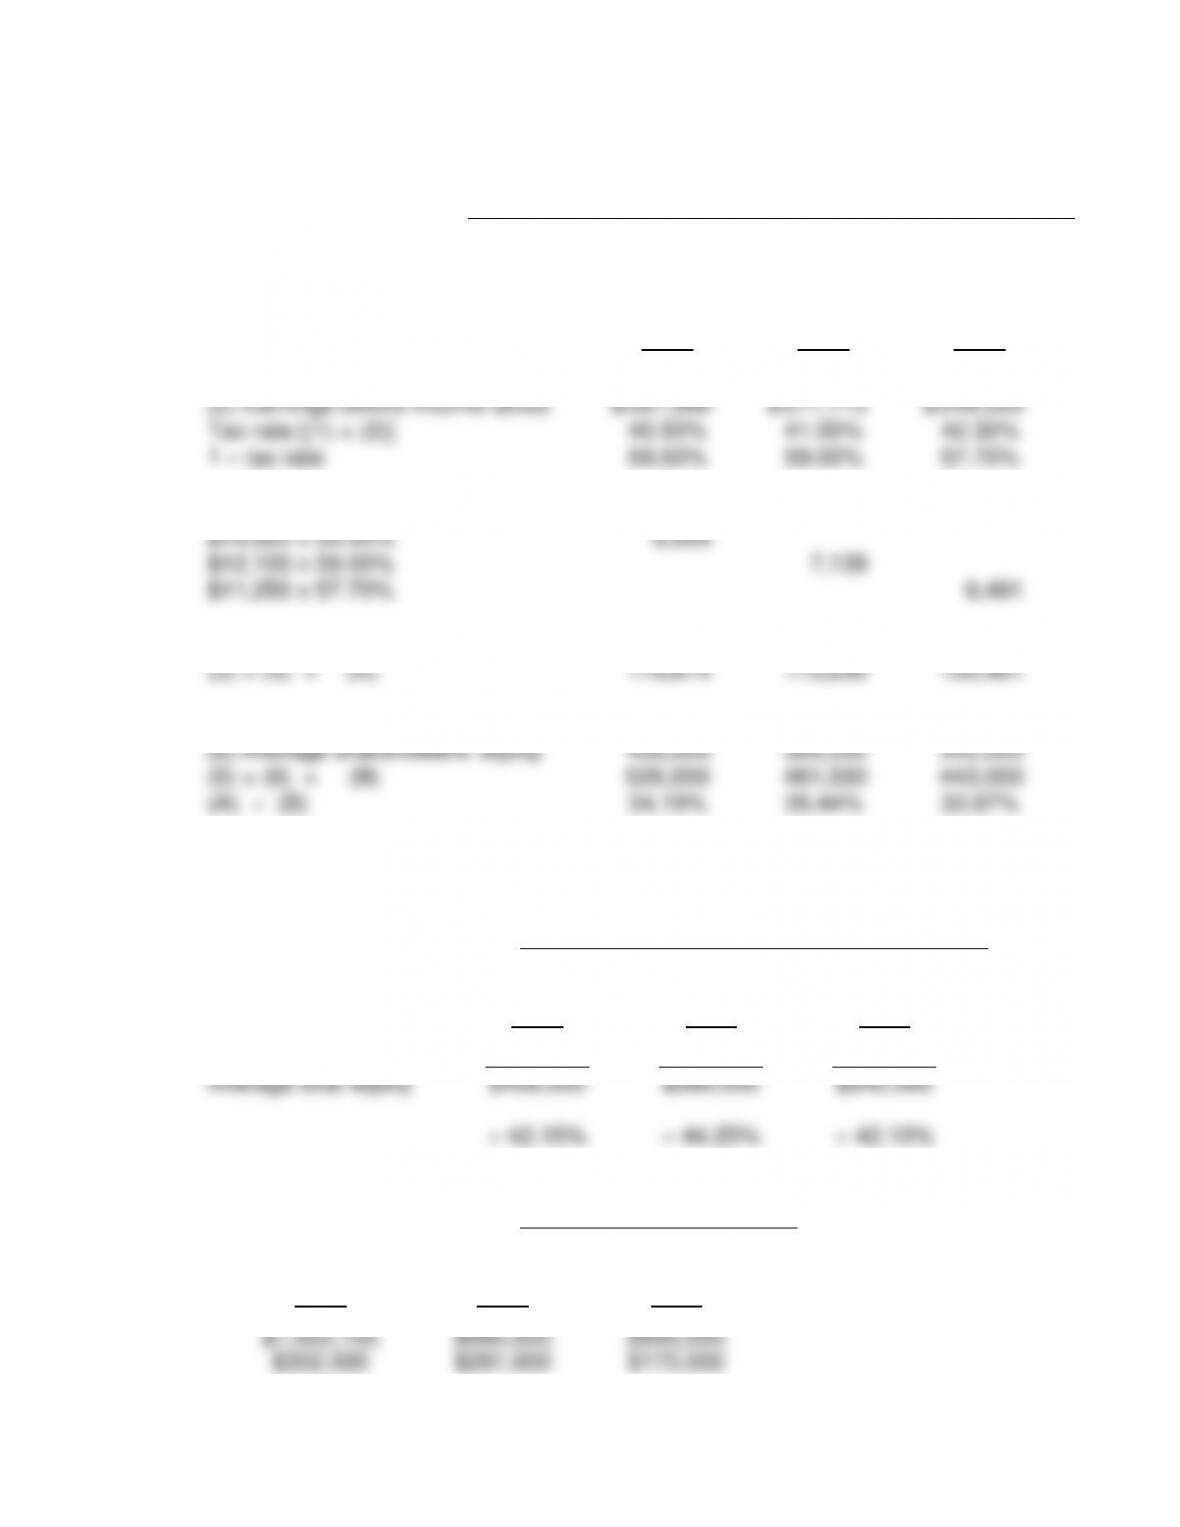
5.
Return on Investment
=
Net Income Before Noncontrolling Interest and
Nonrecurring Items + [(Interest Expense) x (1 – Tax Rate)]
Average (Long-Term Liabilities) + Equity
Estimated tax rate:
2011
2010
2009
(1) Provision for income taxes
$
116,473
$
113,616
$
105,560
(2) Earnings before income taxes
$
287,588
$
277,113
$
249,550
Tax rate [(1) + (2)]
40.50%
41.00%
42.30%
1 – tax rate
59.50%
59.00%
57.70%
(3) Interest expense x (1 – tax rate)
$14,620 x 59.50%
8,699
$12,100 x 59.00%
7,139
$11,250 x 57.70%
6,491
(4) Net earnings
171,115
163,497
143,990
(3) + (4) = (A)
179,814
170,636
150,481
(5) Average long-term debt
120,000
112,000
101,000
(6) Average shareholders’ equity
406,000
369,500
342,000
(5) + (6) = (B)
526,000
481,500
443,000
(A) ÷ (B)
34.19%
35.44%
33.97%
6.
Return on Total Equity
=
Net Income Before Nonrecurring Items –
Dividends on Redeemable Preferred Stock
Average Total Equity
2011
2010
2009
Net earnings
$171,115
$163,497
$143,990
Average total equity
$406,000
$369,500
$342,000
= 42.15%
= 44.25%
= 42.10%
7.
Sales to Fixed Assets
=
Net Sales
Average Net Fixed Assets
2011
2010
2009
$1,002,100
$980,500
$900,000
$302,500
$281,000
$173,000
236
= 3.31
= 3.49
= 5.20
reduction in profitability in 2011.
trend appears to be negative.
PROBLEM 8-8
a.
1.
Net Profit Margin
=
Net Income Before Noncontrolling Interest,
Equity Income and Nonrecurring Items
Net Sales
2011
2010
2009
$20,070 – $8,028
$16,660 – $6,830
$15,380 – $6,229
$297,580
$256,360
$242,150
= 4.05%
= 3.83%
= 3.78%
2.
Return on Assets
=
Net Income Before Minority Share of
Earnings and Nonrecurring Items
Total Assets
2011
2010
2009
$20,070 – $8,028
$16,660 – $6,830
$15,380 – $6,229
$145,760
$137,000
$136,000
= 8.26%
= 7.18%
= 6.73%
3.
Total Asset Turnover
=
Net Sales
Total Assets
2011
2010
2009
$297,580
$256,360
$242,150
$145,760
$137,000
$136,000
= 2.04 times
per year
= 1.87 times
per year
= 1.78 times
per year
237
4. DuPont Analysis
Return on
Assets
=
Operating Income
Margin
x
Total Asset
Turnover
2011:
8.26%
=
4.05%
x
2.04 times
2010:
7.16%*
=
3.83%
x
1.87 times
2009:
6.73%
=
3.78%
x
1.78 times
*Rounding difference from the 7.18% computed in (2).
5.
Operating Income Margin
=
Operating Income
Net Sales
2011
2010
2009
$26,380
$22,860
$20,180
$297,580
$256,360
$242,150
= 8.86%
= 8.92%
= 8.33%
6.
Return on Operating Assets
=
Operating Income
End of Year Operating Assets
2011
2010
2009
$26,380
$22,860
$20,180
$89,800 + $45,850
$84,500 + $40,300
$83,100 + $39,800
= 19.45%
= 18.32%
= 16.42%
7.
Operating Assets Turnover
=
Net Sales
End of Year Operating Assets
2011
2010
2009
$297,580
$265,360
$242,150
$89,800 + $45,850
$84,500 + $40,300
$83,100 + $39,800
= 2.19 times
per year
= 2.13 times
per year
= 1.97 times
per year
238
8. DuPont Analysis
Return on
Operating Assets
=
Operating Income
Margin
x
Operating Asset
Turnover
2011:
19.40%*
=
8.86%
x
2.19 times
2010:
18.29%*
=
8.92%
x
2.05 times
2009:
16.41%*
=
8.33%
x
1.97 times
*Rounding difference from the 19.45%, 18.32%, and 16.42% computed in (6).
9.
Gross Profit Margin
=
Gross Profit
Net Sales
2011
2010
2009
$91,580
$80,060
$76,180
$297,580
$256,360
$242,150
= 30.77%
= 31.23%
= 31.46%
substantial improvement to return on assets.
Operating income margin declined slightly in 2011 after a substantial improvement in
Gross profit margin declined slightly each year.
239
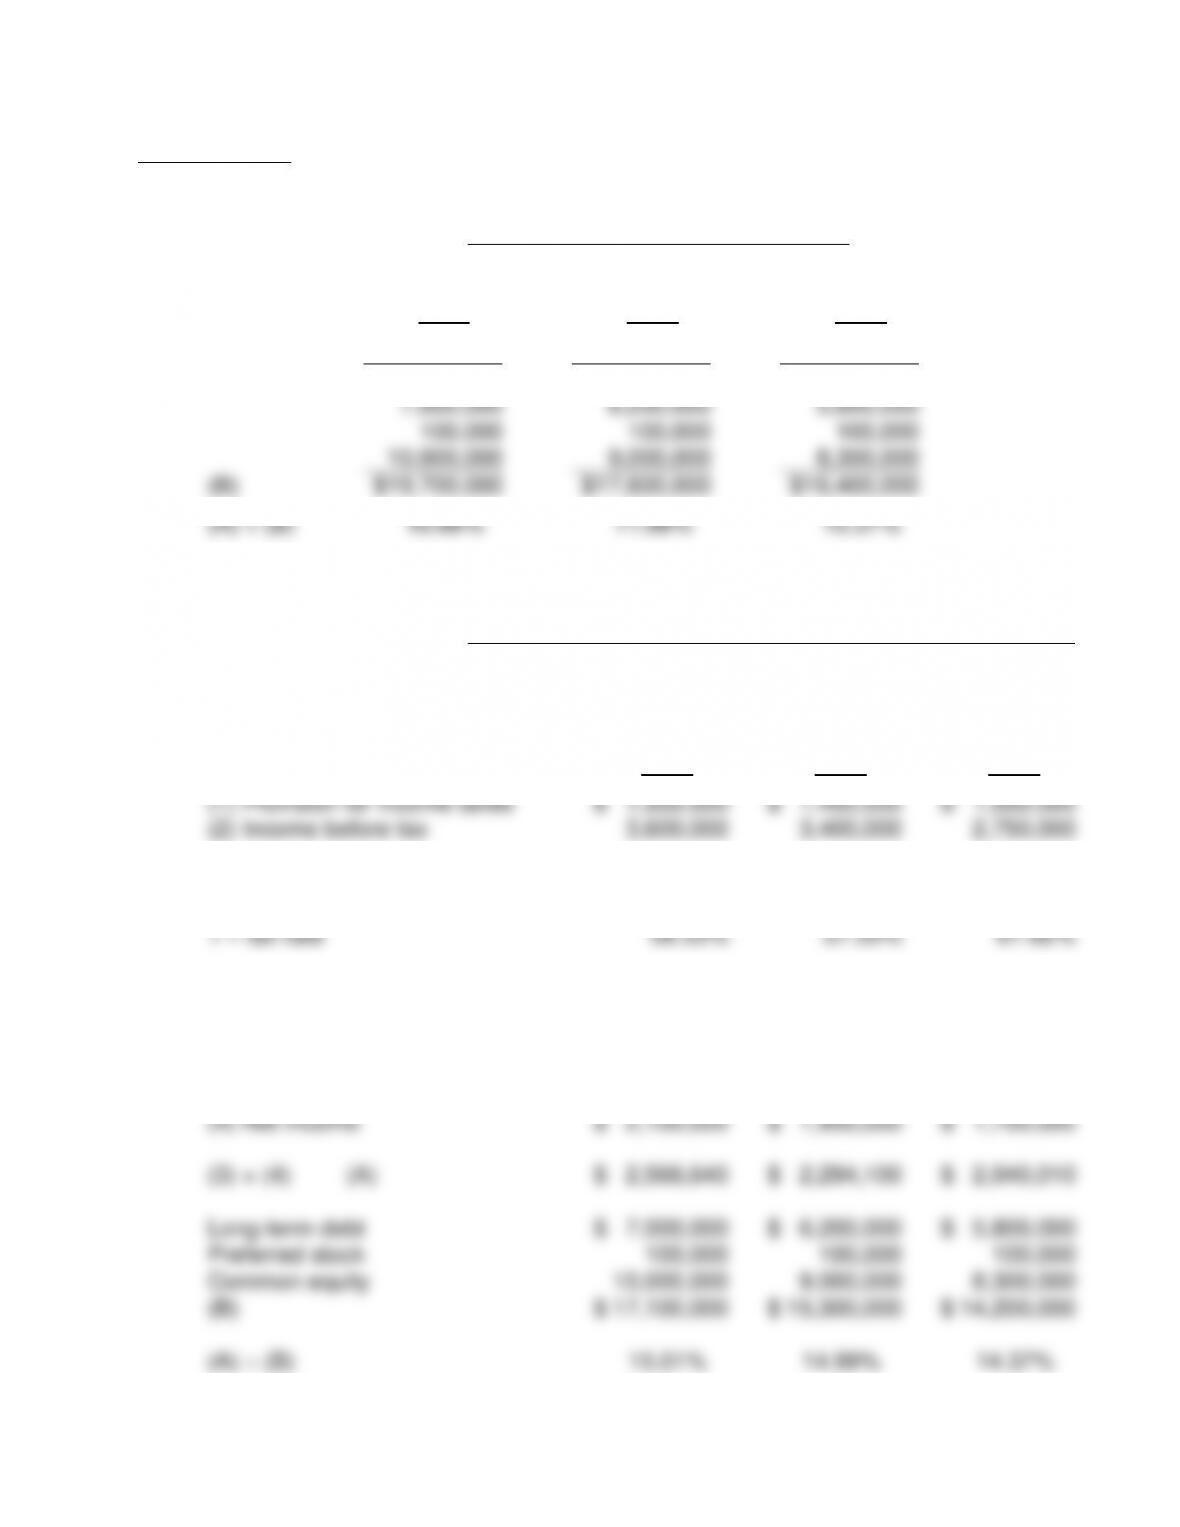
PROBLEM 8-9
a.
1.
Return on Assets
=
Net Income Before Noncontrolling
Interest and Nonrecurring Items
End of Year Total Assets
2011
2010
2009
(A)
$
2,100,000
$
1,950,000
$
1,700,000
$
2,600,000
$
2,300,000
$
2,200,000
7,000,000
6,200,000
5,800,000
100,000
100,000
100,000
10,000,000
9,000,000
8,300,000
(B)
$
19,700,000
$
17,600,000
$
16,400,000
(A) ÷ (B)
10.66%
11.08%
10.37%
2.
Return on Investment
=
Net Income Before Noncontrolling Interest and
Nonrecurring Items + [(Interest Expense) x (1 – Tax Rate)]
End of Year (Long-Term Liabilities + Equity)
Estimated tax rate:
2011
2010
2009
(1) Provision for income taxes
$
1,500,000
$
1,450,000
$
1,050,000
(2) Income before tax
3,600,000
3,400,000
2,750,000
Tax rate = (1) ÷ (2)
41.67%
42.65%
38.18%
1 – tax rate
58.33%
57.35%
61.82%
(3) Interest expense x (1 – tax rate)
$800,000 x 58.33%
$
466,640
$600,000 x 57.35%
$
344,100
$550,000 x 61.82%
$
340,010
(4) Net income
$
2,100,000
$
1,950,000
$
1,700,000
(3) + (4) (A)
$
2,566,640
$
2,294,100
$
2,040,010
Long-term debt
$
7,000,000
$
6,200,000
$
5,800,000
Preferred stock
100,000
100,000
100,000
Common equity
10,000,000
9,000,000
8,300,000
(B)
$
17,100,000
$
15,300,000
$
14,200,000
(A) ÷ (B)
15.01%
14.99%
14.37%
240
3.
Return on Total Equity
=
Net Income Before Nonrecurring Items –
Dividends on Redeemable Preferred Stock
Ending Total Equity
2011
2010
2009
$2,100,000
$1,950,000
$1,700,000
$100,000 + $10,000,000
$100,000 + $9,000,000
$100,000 + $8,300,000
= 20.79%
= 21.43%
= 20.24%
4.
Return on Common Equity
=
Net Income Before Nonrecurring
Items – Preferred Dividends
Ending Common Equity
2011
2010
2009
$2,100,000 – $14,000
$1,950,000 – $14,000
$1,700,000 – $14,000
$10,000,000
$9,000,000
$8,300,000
= 20.86%
= 21.51%
= 20.31%
common equity improved and then declined.
2011.
Return on common equity is slightly more than return on total equity, indicating a
benefit from preferred stock.
benefit from long-term debt.
241
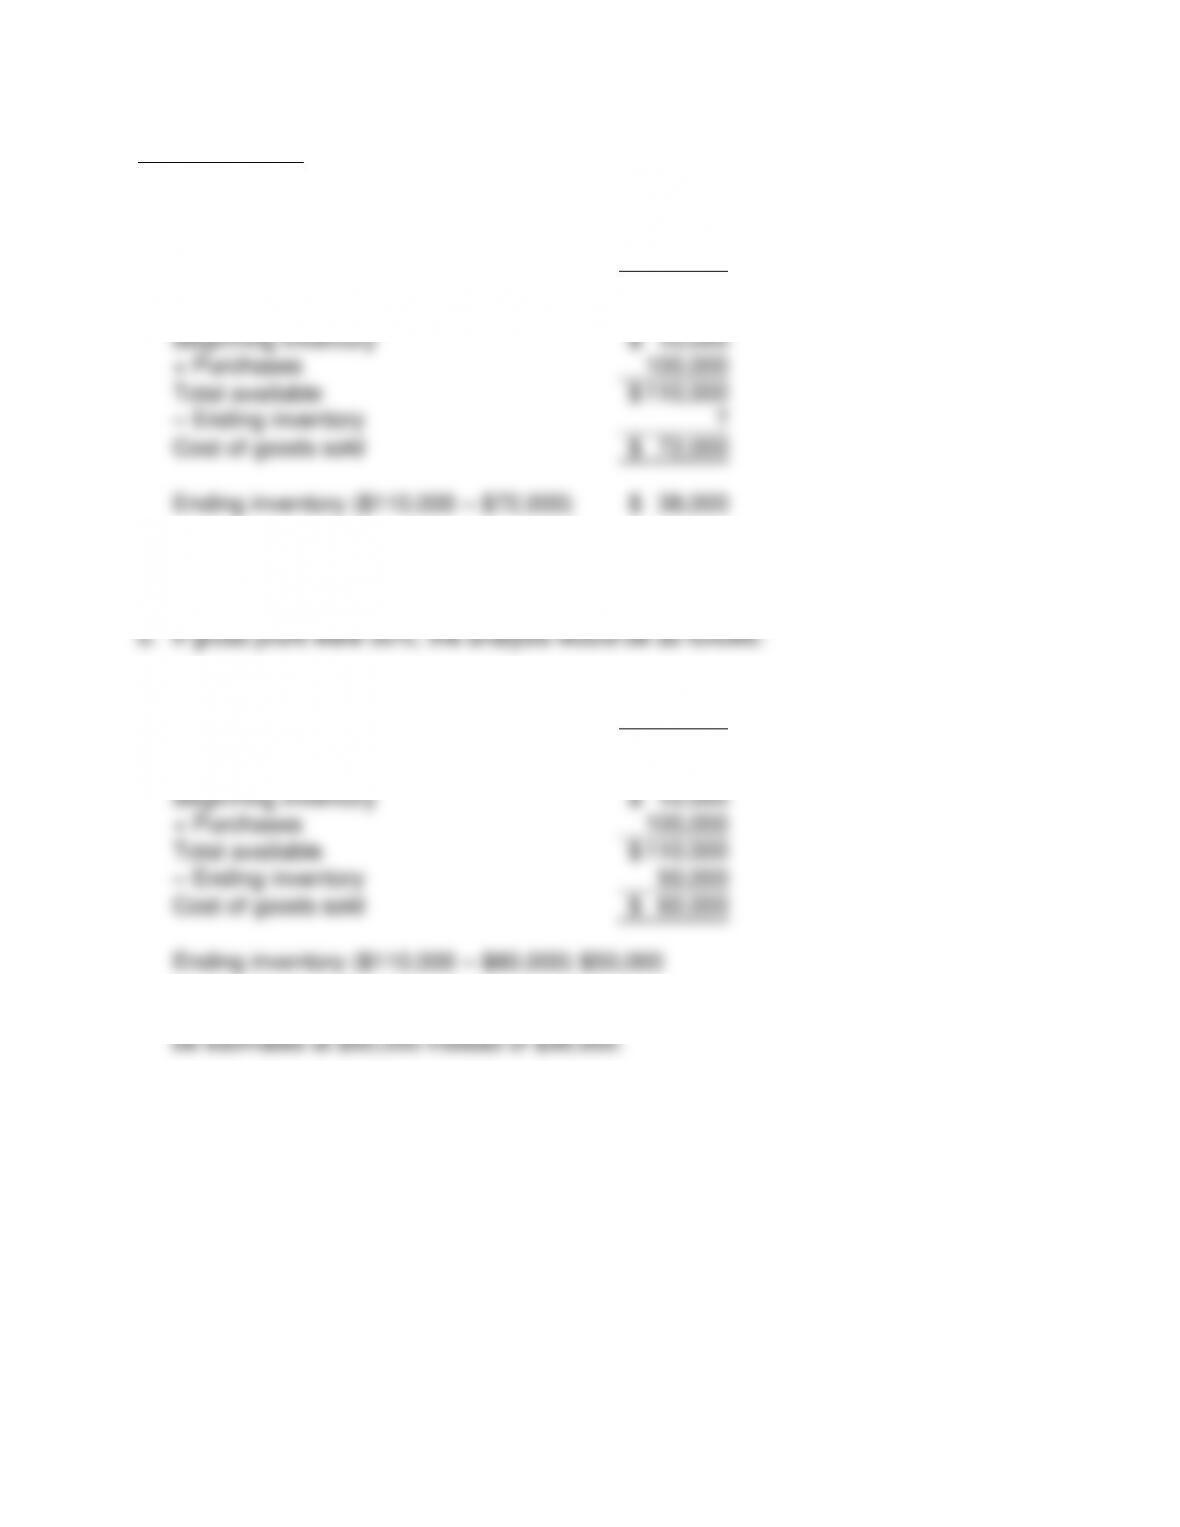
PROBLEM 8-10
a.
Sales
$
120,000
Gross profit (40%)
48,000
Cost of goods sold (60%)
$
72,000
Beginning inventory
$
10,000
+ Purchases
100,000
Total available
$
110,000
– Ending inventory
?
Cost of goods sold
$
72,000
Ending inventory ($110,000 – $72,000)
$
38,000
Sales
$
120,000
Gross profit (50%)
60,000
Cost of goods sold (50%)
$
60,000
Beginning inventory
$
10,000
+ Purchases
100,000
Total available
$
110,000
– Ending inventory
50,000
Cost of goods sold
$
60,000
If gross profit were higher, the loss would be higher because ending inventory would