
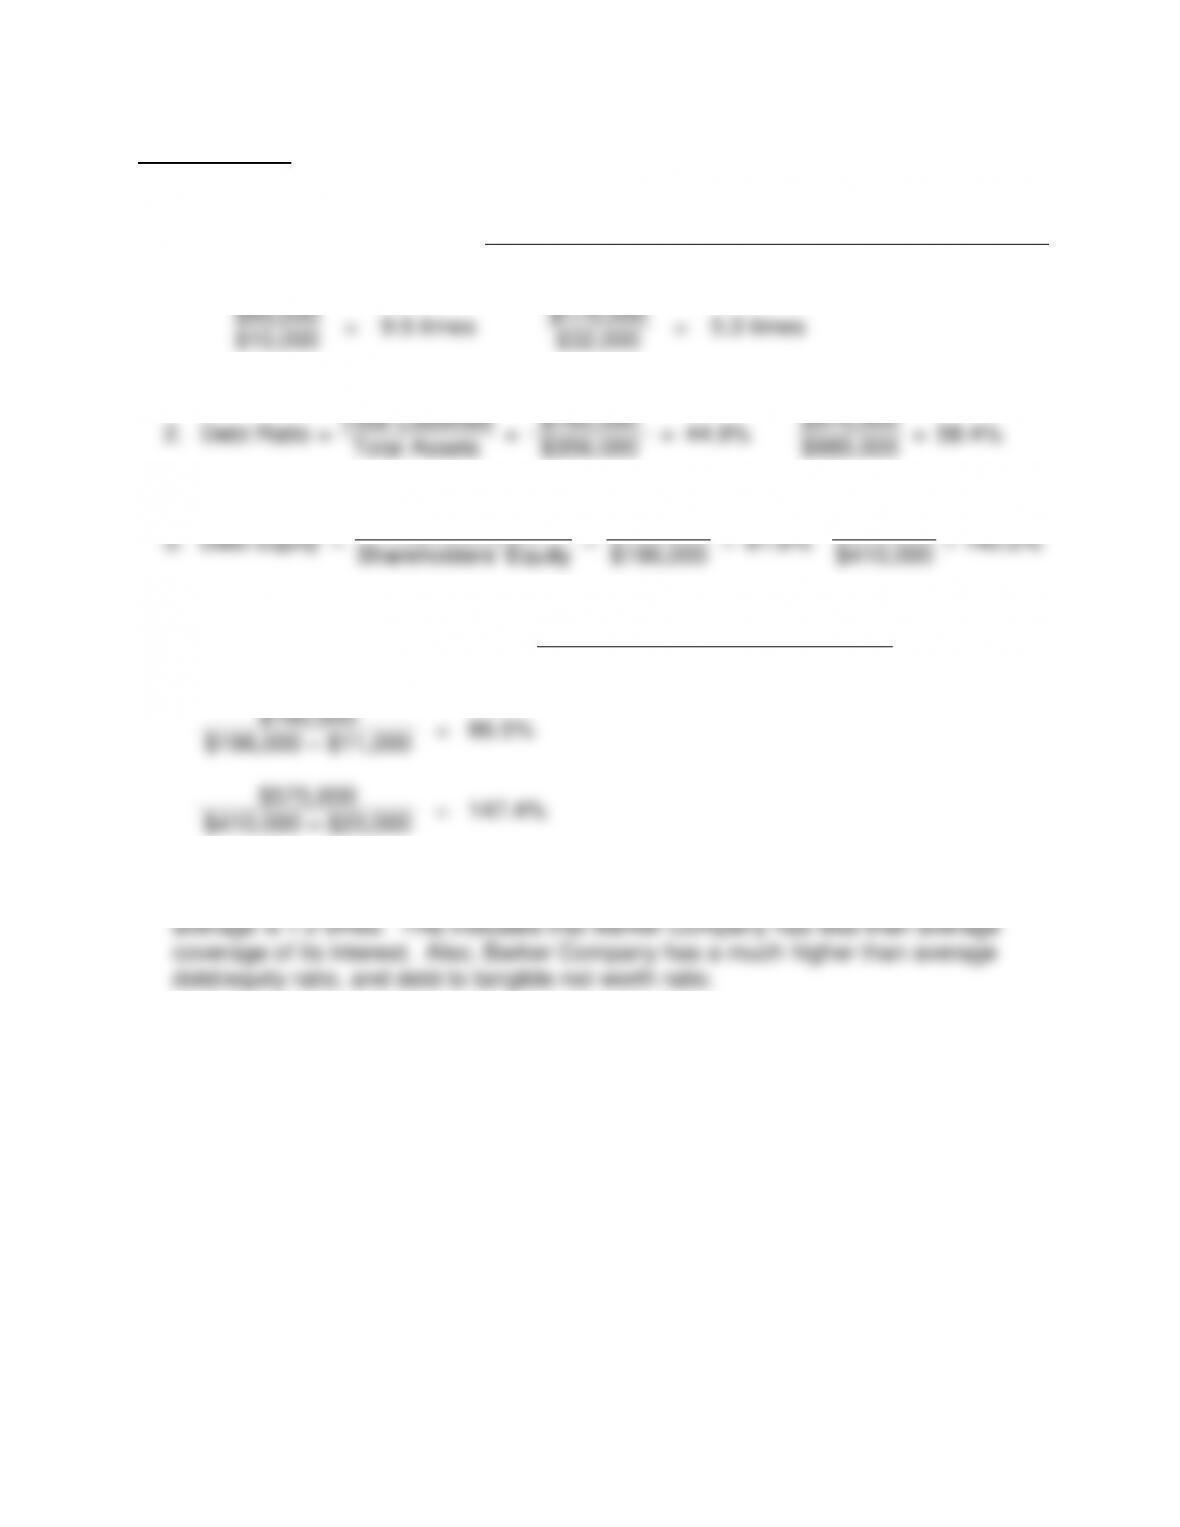
198
3.
Debt/Equity Ratio
=
Total Liabilities
Stockholders’ Equity
$193,000
=
47.4%
$407,000
4.
Debt to Tangible Net Worth Ratio
=
Total Liabilities
Tangible Net Worth
$193,000
=
49.9%
$407,000 – $20,000
b. New asset structure for all plans:
Assets
Current Assets
$
226,000
Property, plant and equipment
554,000
Intangibles
20,000
Total assets
$
800,000
Liabilities and Equity
Plan A
Current Liabilities
$
93,000
Long-term debt
100,000
Preferred stock
250,000
Common equity
357,000
No change in net income
$
800,000
Plan B
Current Liabilities
$
93,000
Long-term debt
100,000
Preferred stock
50,000
Common stock
120,000
Premium on common stock
300,000
Retained earnings
137,000
No change in net income
$
800,000

199
Plan C
Current liabilities
$
93,000
Operating income
$
162,000
Long-term debt
300,000
Interest expense
36,000
*
Preferred stock
50,000
$
126,000
Common equity
357,000
Taxes (40%)
50,400
$
800,000
Net income
$
75,600
1.
Times Interest Earned
=
Recurring Earnings, Excluding Interest Expense, Tax
Expense, Equity Earnings, and Noncontrolling Interest
Interest Expense, Including Capitalized Interest
Plan A
Plan B
Plan C
$162,000
=
8.1 times
$162,000
=
8.1 times
$162,000
=
4.5 times
$20,000
$20,000
$36,000
2.
Debt Ratio
=
Total Liabilities
Total Assets
Plan A
Plan B
Plan C
$193,000
=
24.1%
$193,000
=
24.1%
$393,000
=
49.1%
$800,000
$800,000
$800,000
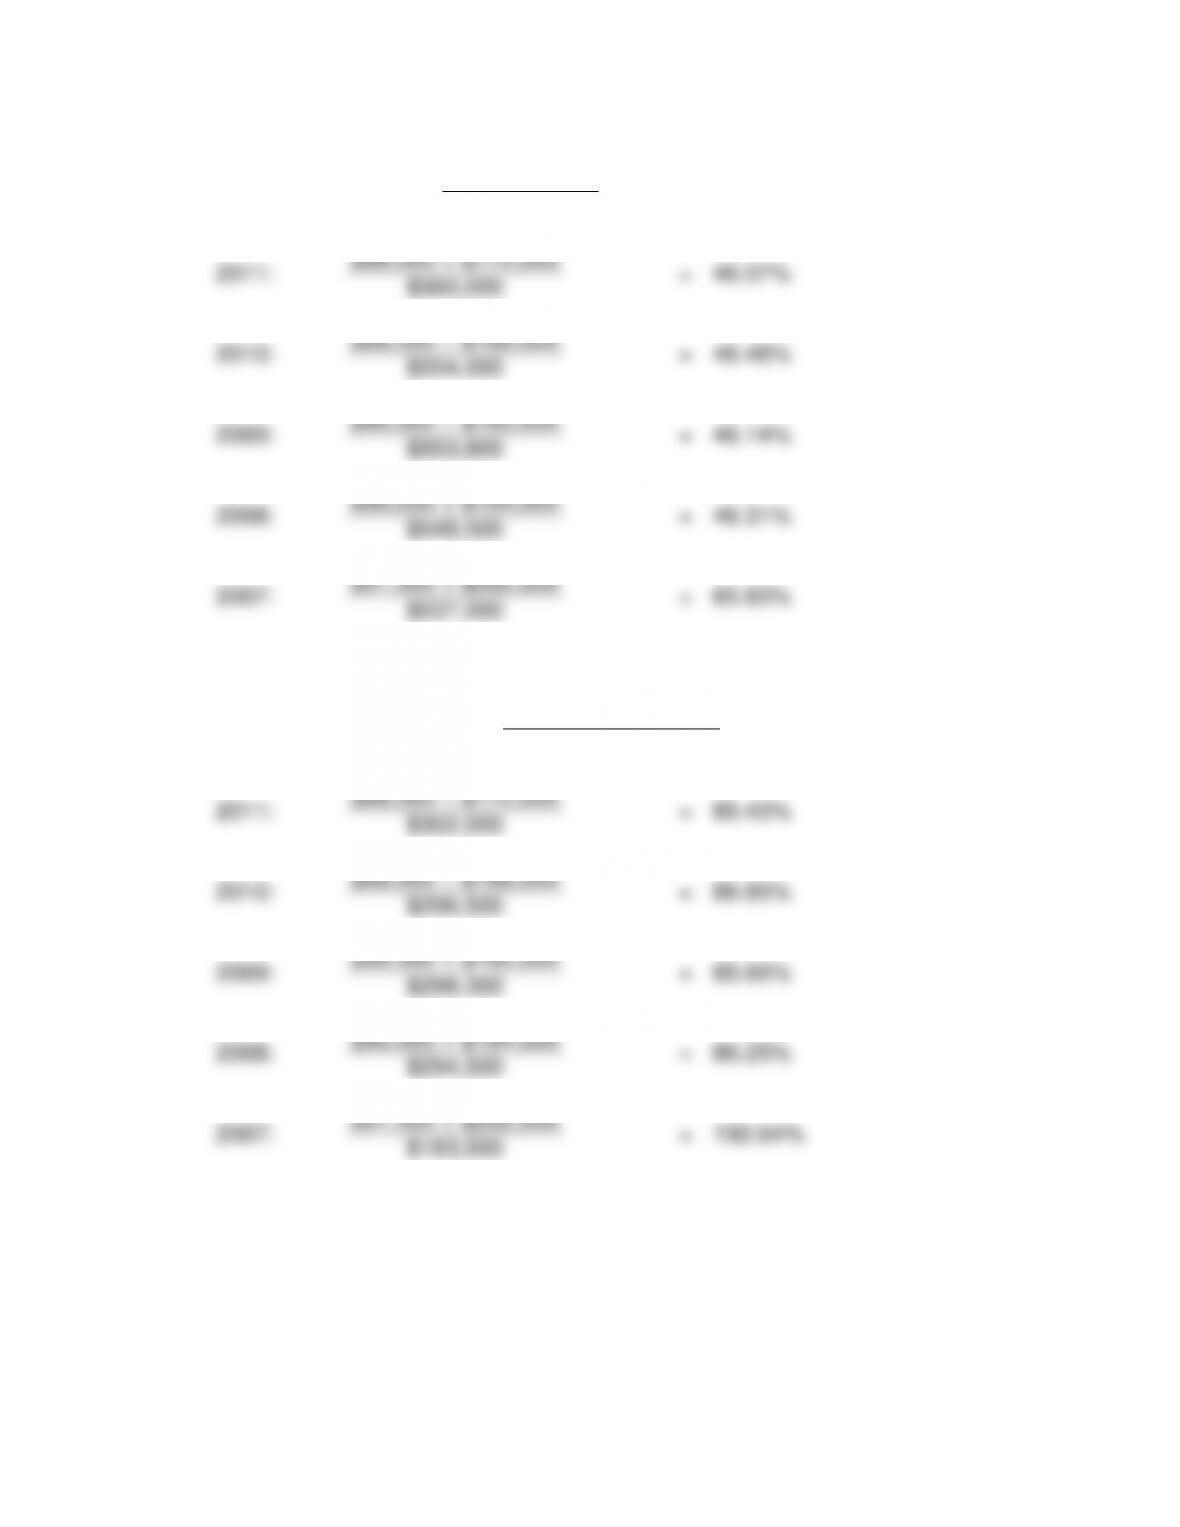
3.
Debt/Equity Ratio
=
Total Liabilities
Stockholders’ Equity
Plan A
Plan B
Plan C
$193,000
=
31.8%
$193,000
=
31.8%
$393,000
=
96.6%
$607,000
$607,000
407,000
4.
Debt to Tangible Net Worth
=
Total Liabilities
Tangible Net Worth
Plan A
Plan B
Plan C
$193,000
=
32.9%
$193,000
=
32.9%
$393,000
=
101.6%
$607,000 – $20,000
$607,000 – $20,000
$407,000 – $20,000

200
c. Preferred Stock Alternative:
Advantages:
2. Not the absolute reduction in earnings that accompanied the debt alternative.
Debt to Tangible Net Worth Ratio.
of issuing long-term debt.
Disadvantage:
any dividends can be paid to common stockholders.
Common Stock Alternative:
Advantages:
1. No increase in fixed obligations.
3. Not the absolute reduction in earnings that accompanied the debt alternative.
of issuing long-term debt.
Disadvantage:
Long-Term Bonds Alternative:
Advantage:
Disadvantages:
1. Material decline in Times Interest Earned.
Tangible Net Worth Ratio.

201
3. Absolute reduction in earnings.
interest is tax deductible and, therefore, the after-tax cost is 4.8% [8% x (1-.40)(1–
the corporate tax rate)].
necessarily be true with changed assumptions.
PROBLEM 7-8
a.
Times Interest Earned
=
Recurring Earnings, Excluding Interest Expense, Tax
Expense, Equity Earnings, and Noncontrolling Interest
Interest Expense, Including Capitalized Interest
Earnings from continuing operations before
income taxes and equity earnings
Add back interest expense
$
74,780,000
Adjusted earnings
(1) $
37,646,000
(2) $
112,426,000
Times interest earned: [(2) + (1)] 2.99 times per year
b.
Adjusted earnings (see a, above)
$
112,426,000
Plus equity earnings
27,749,000
Interest expense
(1) $
140,175,000
(2) $
37,646,000
interest payments.
202
PROBLEM 7-9
a.
1.
Times Interest Earned
=
Recurring Earnings, Excluding Interest Expense, Tax
Expense, Equity Earnings, and Noncontrolling Interest
Interest Expense, Including Capitalized Interest
$95,000
=
9.5 times
$170,000
=
5.3 times
$10,000
$32,000
2.
Debt Ratio
=
Total Liabilities
=
$160,000
=
44.9%
$575,000
=
58.4%
Total Assets
$356,000
$985,000
3.
Debt Equity
=
Total Liabilities
=
$160,000
=
81.6%
$575,000
=
140.2%
Shareholders’ Equity
$196,000
$410,000
4.
Debt to Tangible Net Worth
=
Total Liabilities
Shareholders’ Equity – Intangibles
$160,000
=
86.5%
$196,000 – $11,000
$575,000
=
147.4%
$410,000 – $20,000
b. No, Barker Company has a times interest earned of 5.3 times while the industry
c. Allen Company has a better times interest earned, debt ratio, debt/equity ratio, and
debt to tangible net worth.
203
PROBLEM 7-10
a.
1.
Times Interest Earned
=
Recurring Earnings, Excluding Interest Expense, Tax
Expense, Equity Earnings, and Noncontrolling Interest
Interest Expense, Including Capitalized Interest
2011:
$280,000 – $156,000
=
7.29 times per year
$17,000
2010:
$302,000 – $157,000
=
9.06 times per year
$16,000
2009:
$286,000 – $154,000
=
8.80 times per year
$15,000
2008:
$270,000 – $150,000
=
8.28 times per year
$14,500
2007:
$248,000 – $147,000
=
4.39 times per year
$23,000
2.
Fixed Charge Coverage
=
Recurring Earnings, Excluding Interest Expense,
Tax Expense, Equity Earnings, and Noncontrolling
Interest + Interest Portion of Rentals
Interest Expense, Including Capitalized Interest +
Interest Portion of Rentals
2011:
$280,000 – $156,000 + $10,000
=
4.96 times per year
$17,000 + $10,000
2010:
$302,000 – $157,000 + $9,000
=
6.16 times per year
$16,000 + $9,000
2009:
$286,000 – $154,000 + $9,500
=
5.78 times per year
$15,000 + $9,500
2008:
$270,000 – $150,000 + $10,000
=
5.31 times per year
$14,500 + $10,000
2007:
$248,000 – $147,000 + $9,000
=
3.44 times per year
$23,000 + $9,000
204
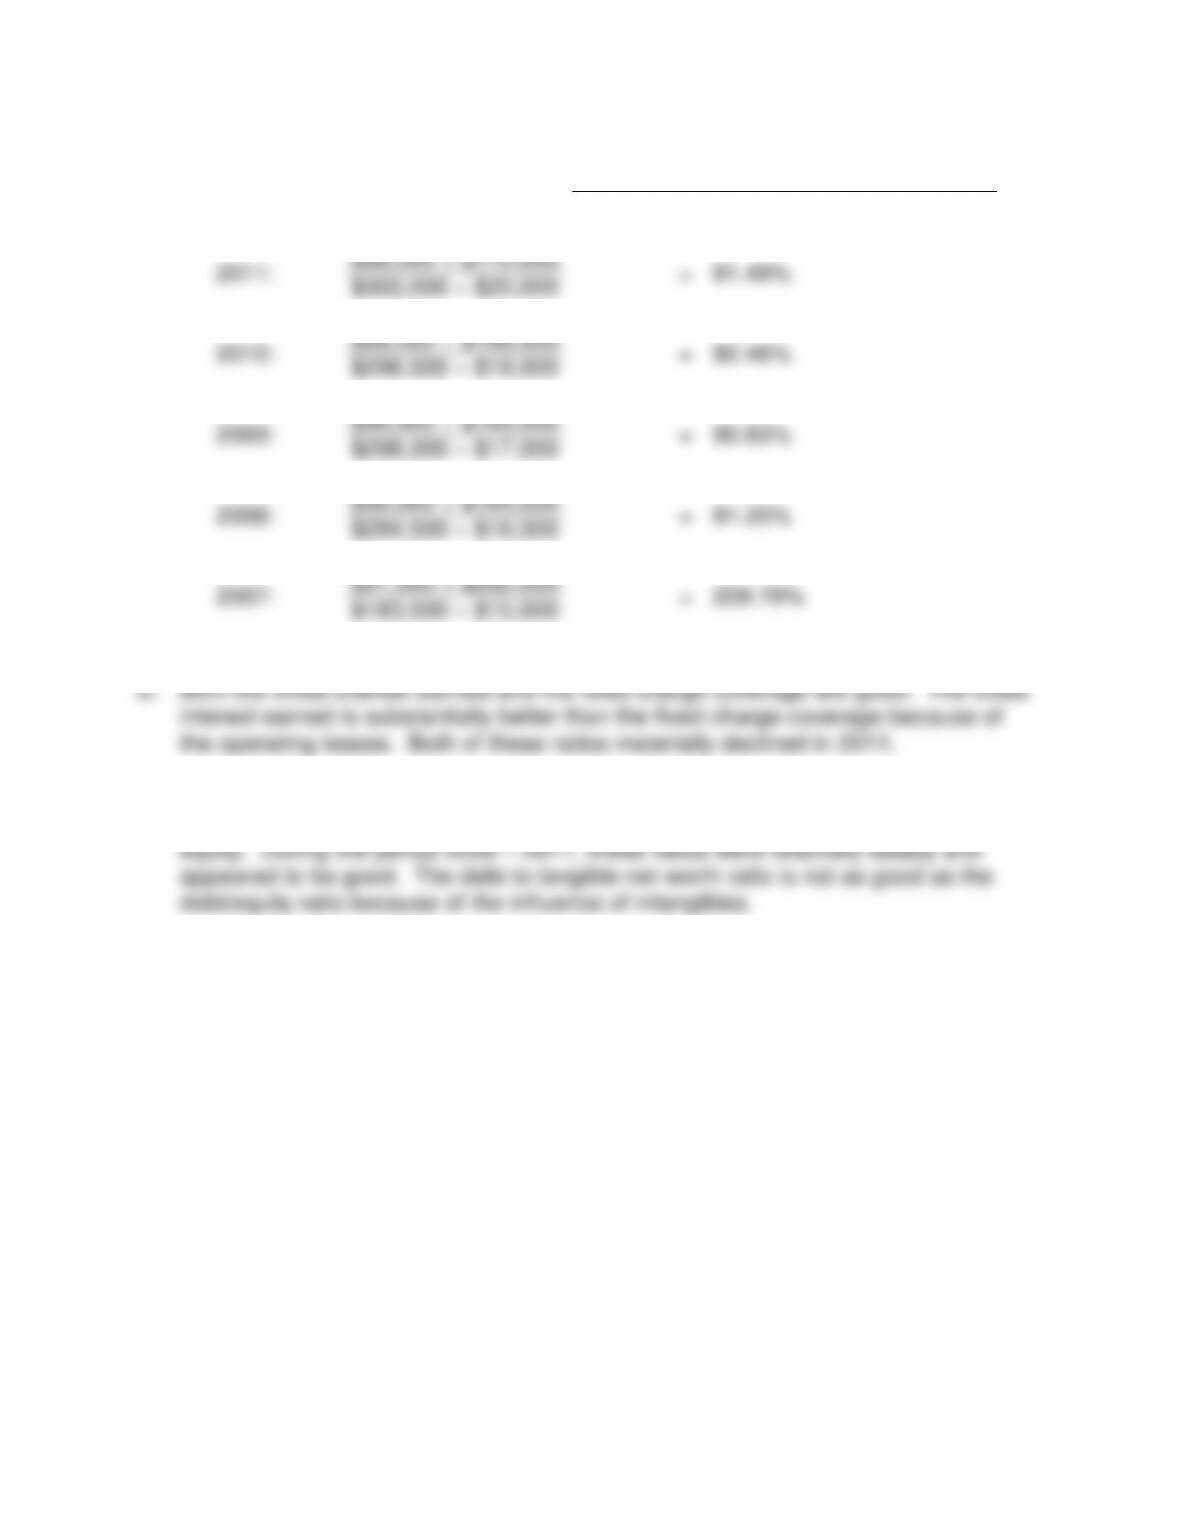
3.
Debt Ratio
=
Total Liabilities
Total Assets
2011:
$88,000 + $170,000
=
46.07%
$560,000
2010:
$89,500 + $168,000
=
46.48%
$554,000
2009:
$90,500 + $165,000
=
46.14%
$553,800
2008:
$90,000 + $164,000
=
46.31%
$548,500
2007:
$91,500 + $262,000
=
65.83%
$537,000
4.
Debt/Equity Ratio
=
Total Liabilities
Shareholders’ Equity
2011:
$88,000 + $170,000
=
85.43%
$302,000
2010:
$89,500 + $168,000
=
86.85%
$296,500
2009:
$90,500 + $165,000
=
85.65%
$298,300
2008:
$90,000 + $164,000
=
86.25%
$294,500
2007:
$91,500 + $262,000
=
192.64%
$183,500
205
5.
Debt to Tangible Net Worth
=
Total Liabilities
Shareholders’ Equity – Intangible Assets
2011:
$88,000 + $170,000
=
91.49%
$302,000 – $20,000
2010:
$89,500 + $168,000
=
92.46%
$296,500 – $18,000
2009:
$90,500 + $165,000
=
90.83%
$298,300 – $17,000
2008:
$90,000 + $164,000
=
91.20%
$294,500 – $16,000
2007:
$91,500 + $262,000
=
209.79%
$183,500 – $15,000
The debt ratio, debt/equity ratio, and debt to tangible net worth materially improved
between 2007 and 2008 when long-term debt was reduced and funding shifted to

206
PROBLEM 7-11
a.
4
The times interest earned ratio indicates a firm’s long-term debt-paying ability
from the income statement view.
b.
5
Preferred stock is owned by stockholders.
c.
5
The bonds payable liability will be shown on the balance sheet.
d.
5
The denominator of the debt ratio is total assets. Therefore, none of these
assets are subtracted.
e.
5
The current ratio is considered to be a liquidity ratio.
f.
4
The debt/equity ratio represents a balance sheet view of debt.
g.
5
There is not adequate information to form an opinion on the long-term debt
position.
h.
2
With a times interest earned ratio of .20 to 1, net income is less than the
interest expense.
i.
5
Intangible assets are subtracted in the denominator. Land and bonds payable
are not intangible assets.
j.
2
The ratio fixed charge coverage is an income statement indication of debt–
paying ability.
k.
1
The Employee Retirement Income Security Act calls for a company to be
liable for its pension plan up to 30 percent of its net worth.
l.
1
Capitalized interest should be included with interest expense when computing
times interest earned.
m.
3
Minority shareholders’ interest does not represent a definite commitment to
pay out funds in the future.