7.
Operating Cycle
=
Accounts Receivable
Turnover in Days
+
Inventory Turnover
in Days
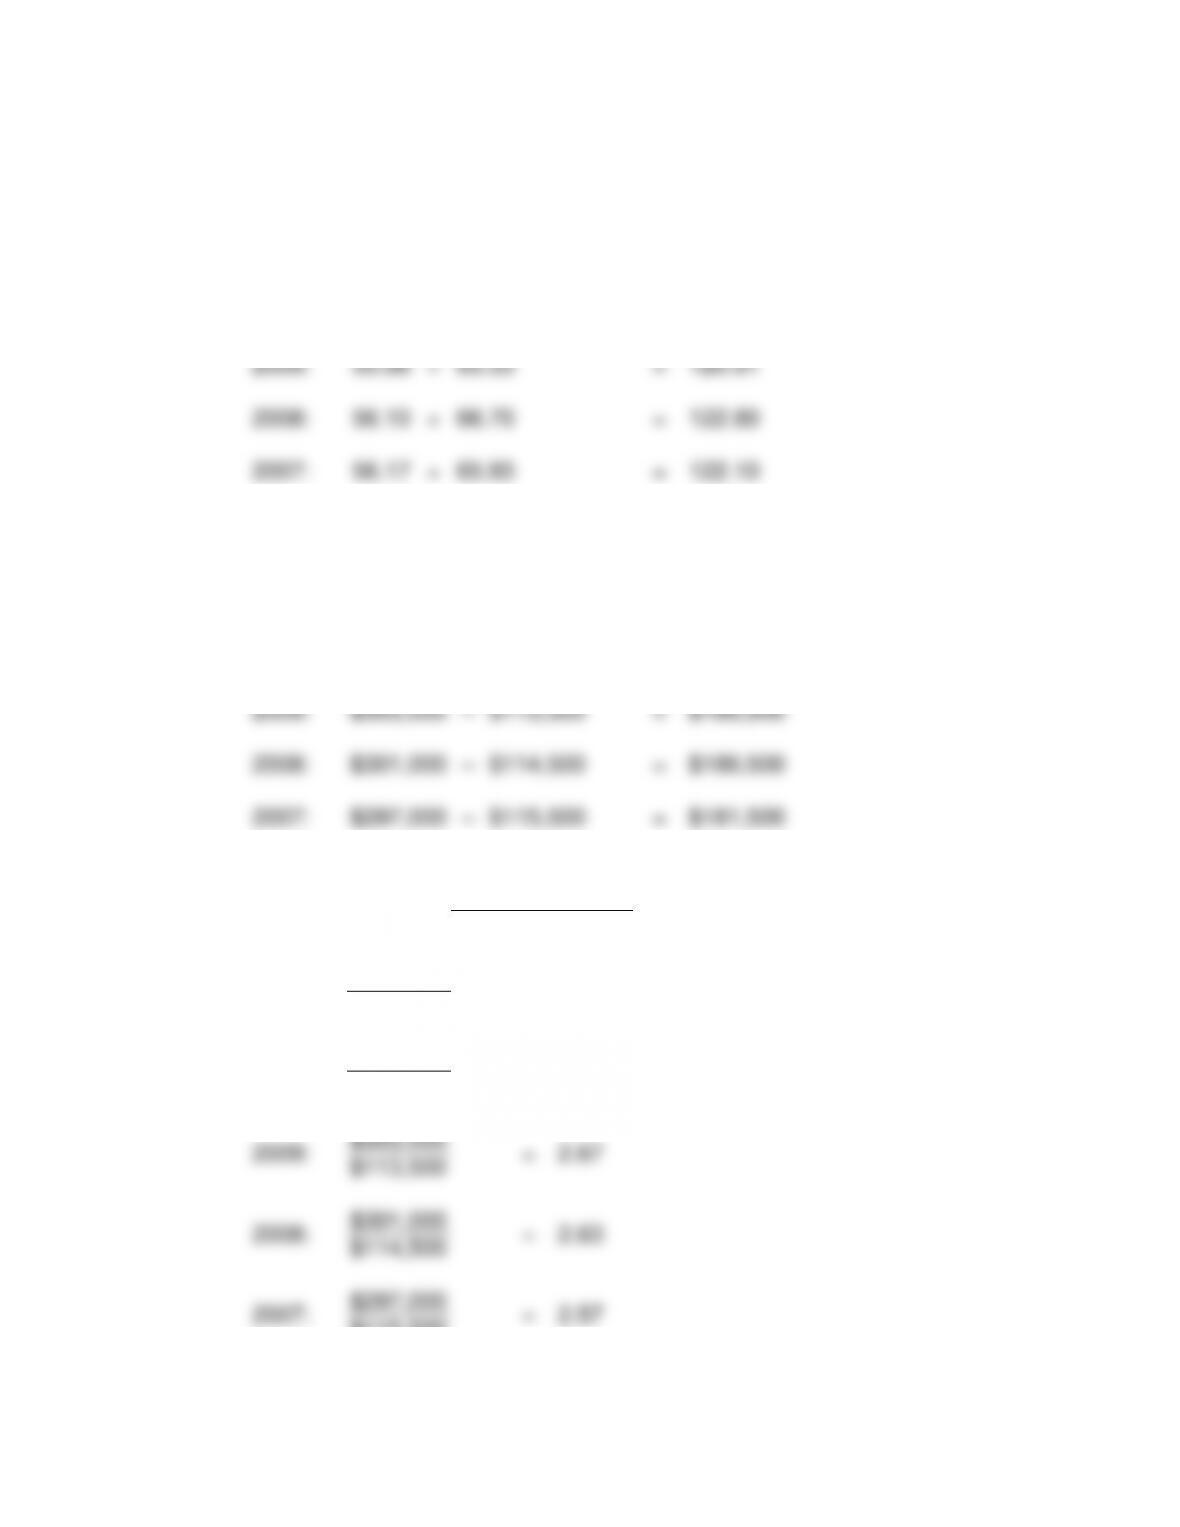
2011:
54.75
+
60.18
=
114.93
2010:
51.70
+
59.55
=
111.25
2009:
55.58
+
65.33
=
120.91
2008:
56.10
+
66.70
=
122.80
Current Assets
2011:
2010:
2009:
2008:
2007:
159
10.
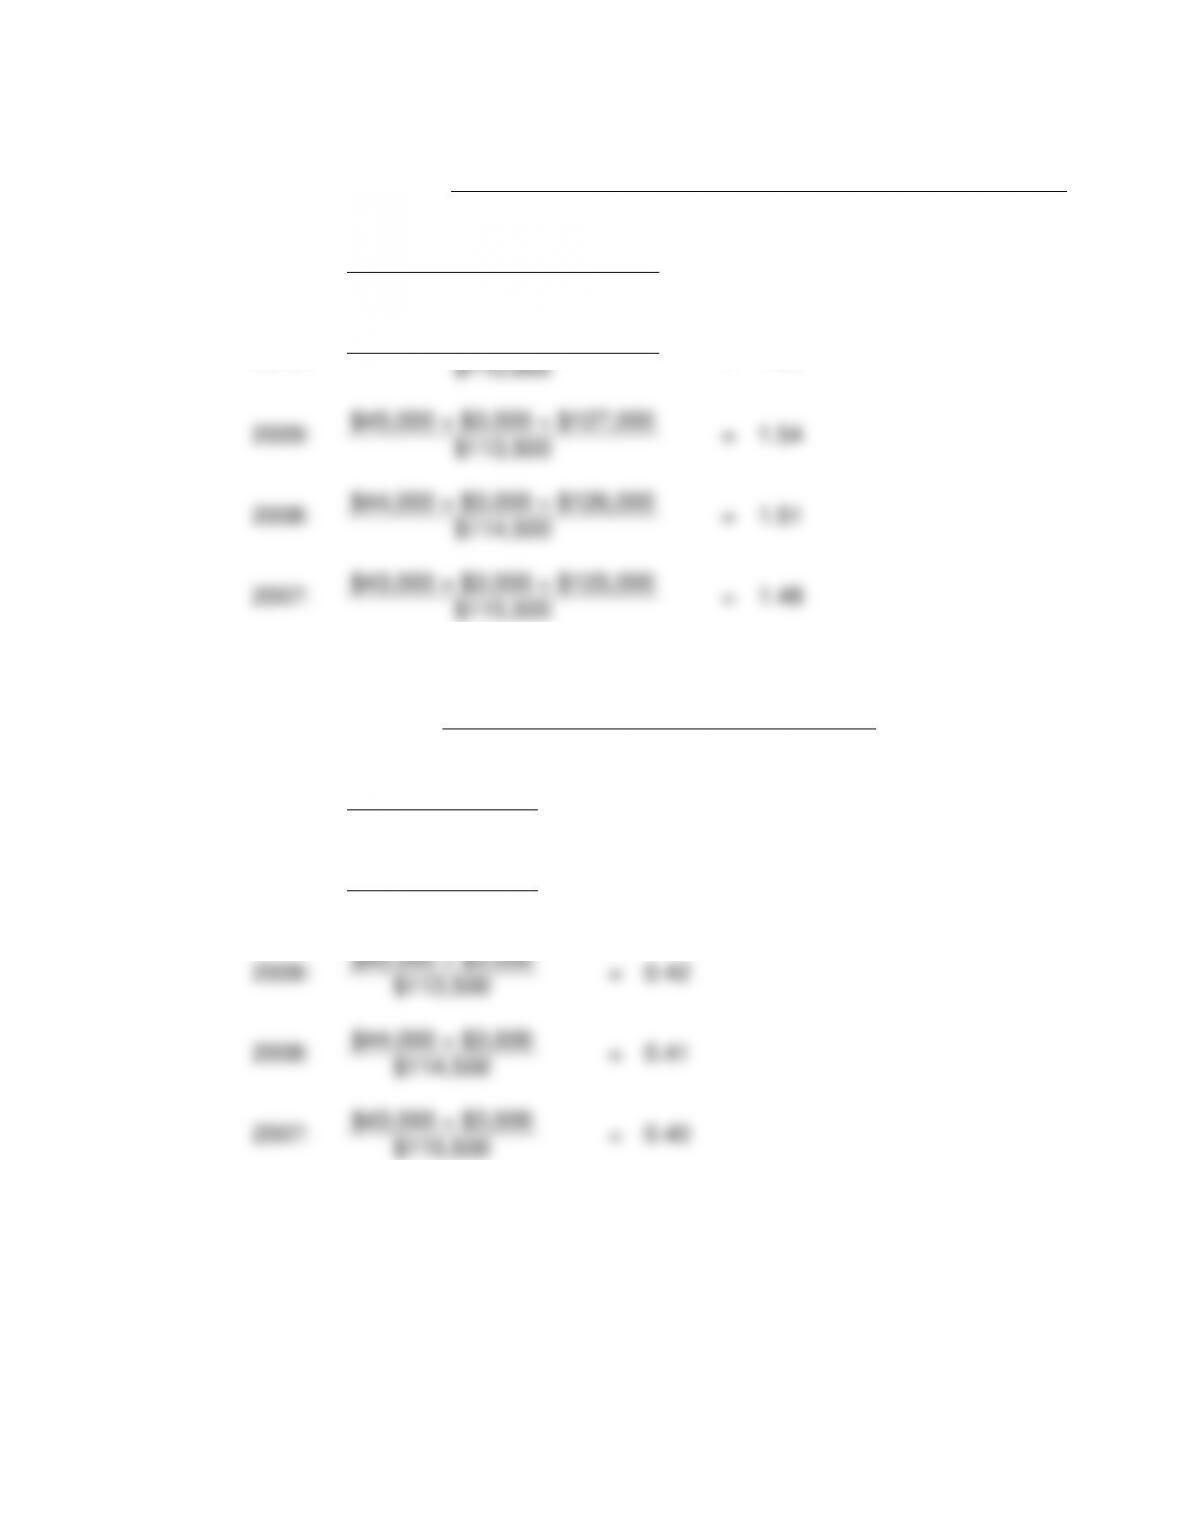
Acid-Test Ratio
=
Cash Equivalents + Marketable Services + Net Receivables
Current Liabilities
2011:
$47,200 + $2,000 + $131,000
=
1.65
$109,500
2010:
$46,000 + $2,500 + $128,000
=
1.60
$110,000
2009:
$45,000 + $3,000 + $127,000
=
1.54
$113,500
2008:
$44,000 + $3,000 + $126,000
=
1.51
$114,500
2007:
$43,000 + $3,000 + $125,000
=
1.48
$115,500
11.
Cash Ratio
=
Cash Equivalents + Marketable Securities
Current Liabilities
2011:
$47,200 + $2,000
=
0.45
$109,500
2010:
$46,000 + $2,500
=
0.44
$110,000
2009:
$45,000 + $3,000
=
0.42
$113,500
2008:
$44,000 + $3,000
=
0.41
$114,500
2007:
$43,000 + $3,000
=
0.40
$115,500
160
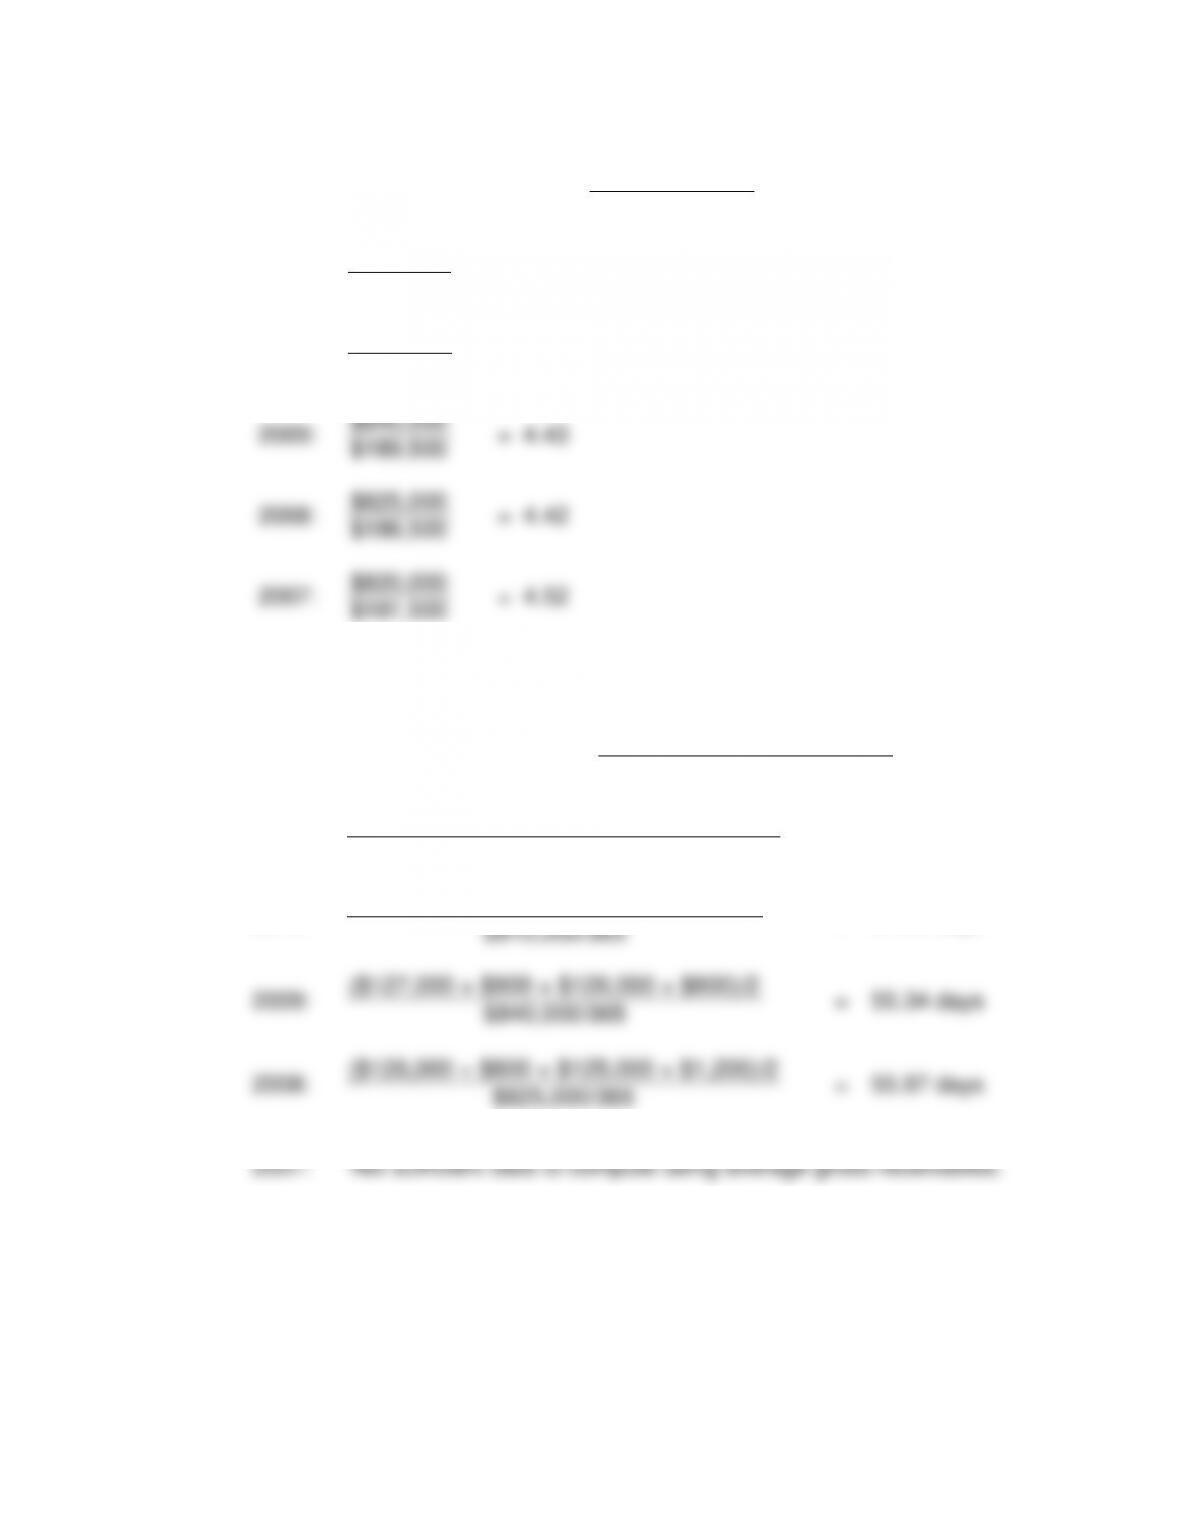
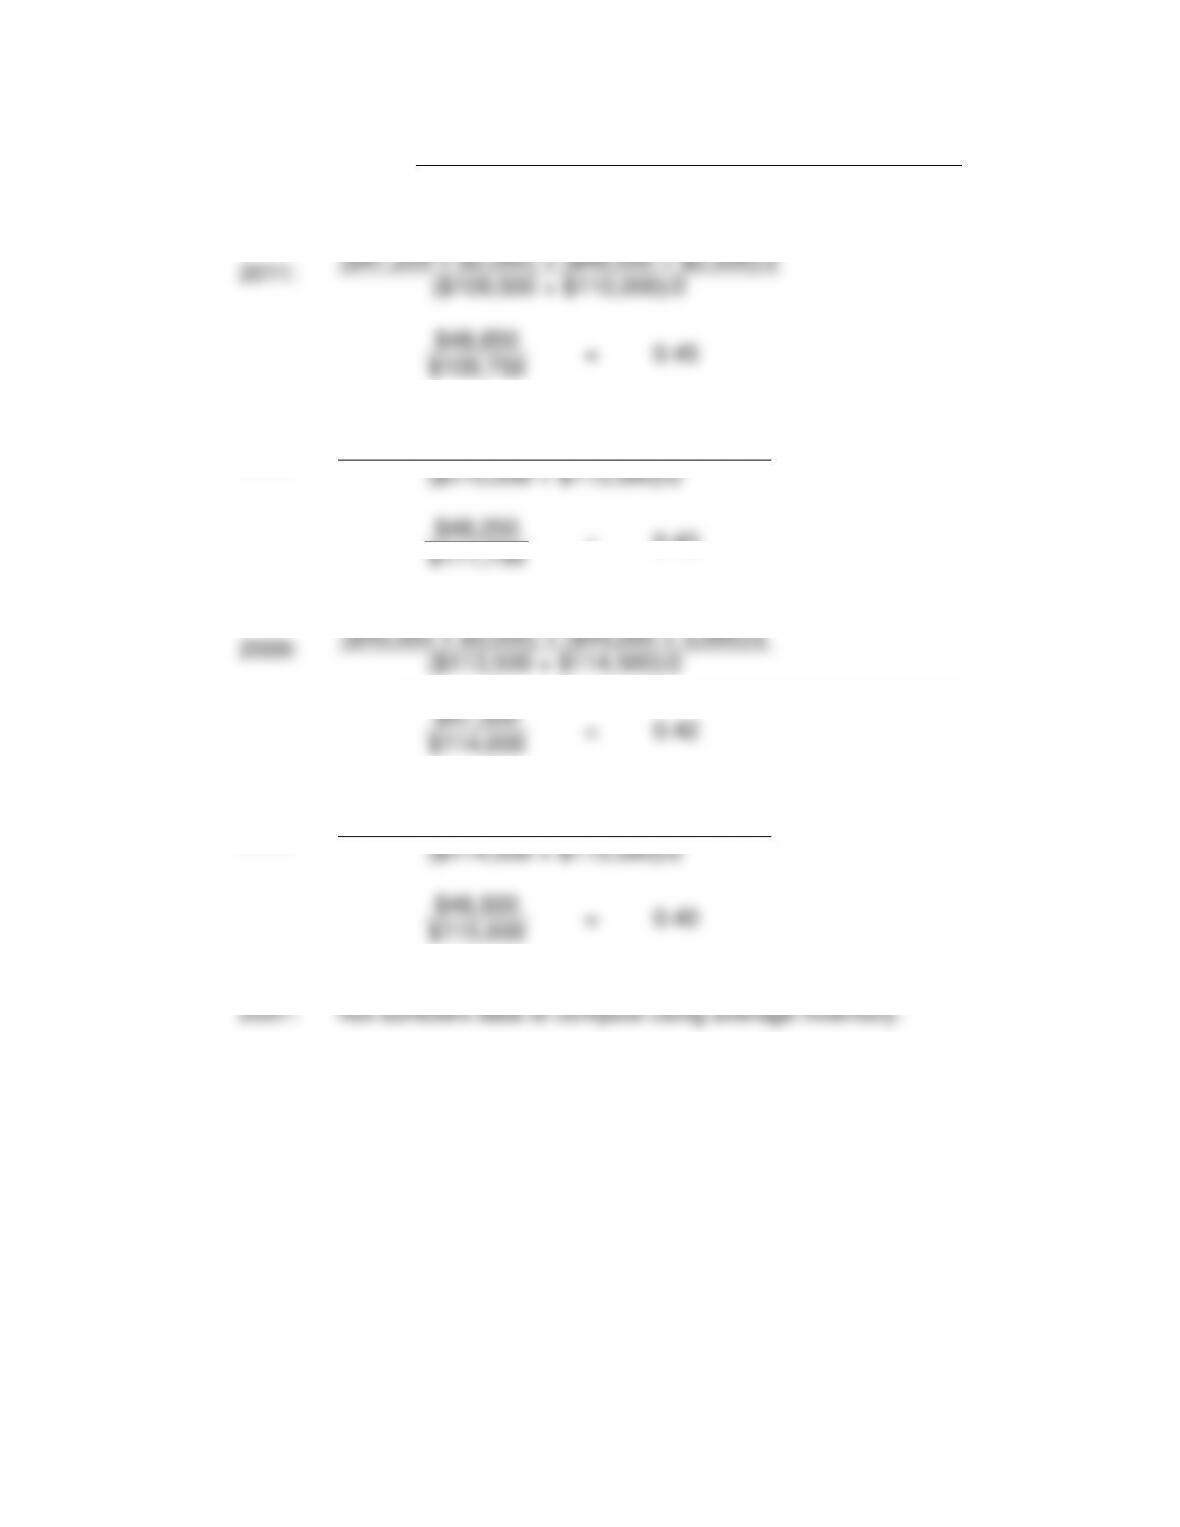
12.
Sales to Working Capital
=
Net Sales
Working Capital
2011:
$880,000
=
4.50
$195,700
2010:
$910,000
=
4.72
$193,000
2009:
$840,000
=
4.43
$189,500
2008:
$825,000
=
4.42
$186,500
2007:
$820,000
=
4.52
$181,500
b.
1.
Days’ Sales in Receivables
=
Average Gross Receivables
Net Sales/365
2011:
($131,000 + $1,000 + $128,000 + $900)/2
=
54.11 days
$880,000/365
2010:
($128,000 + $900 + $127,000 + $900)/2
=
51.50 days
$910,000/365
2009:
($127,000 + $900 + $126,000 + $800)/2
=
55.34 days
$840,000/365
2008:
($126,000 + $800 + $125,000 + $1,200)/2
=
55.97 days
$825,000/365
2007:
Not sufficient data to compute using average gross receivables.
161
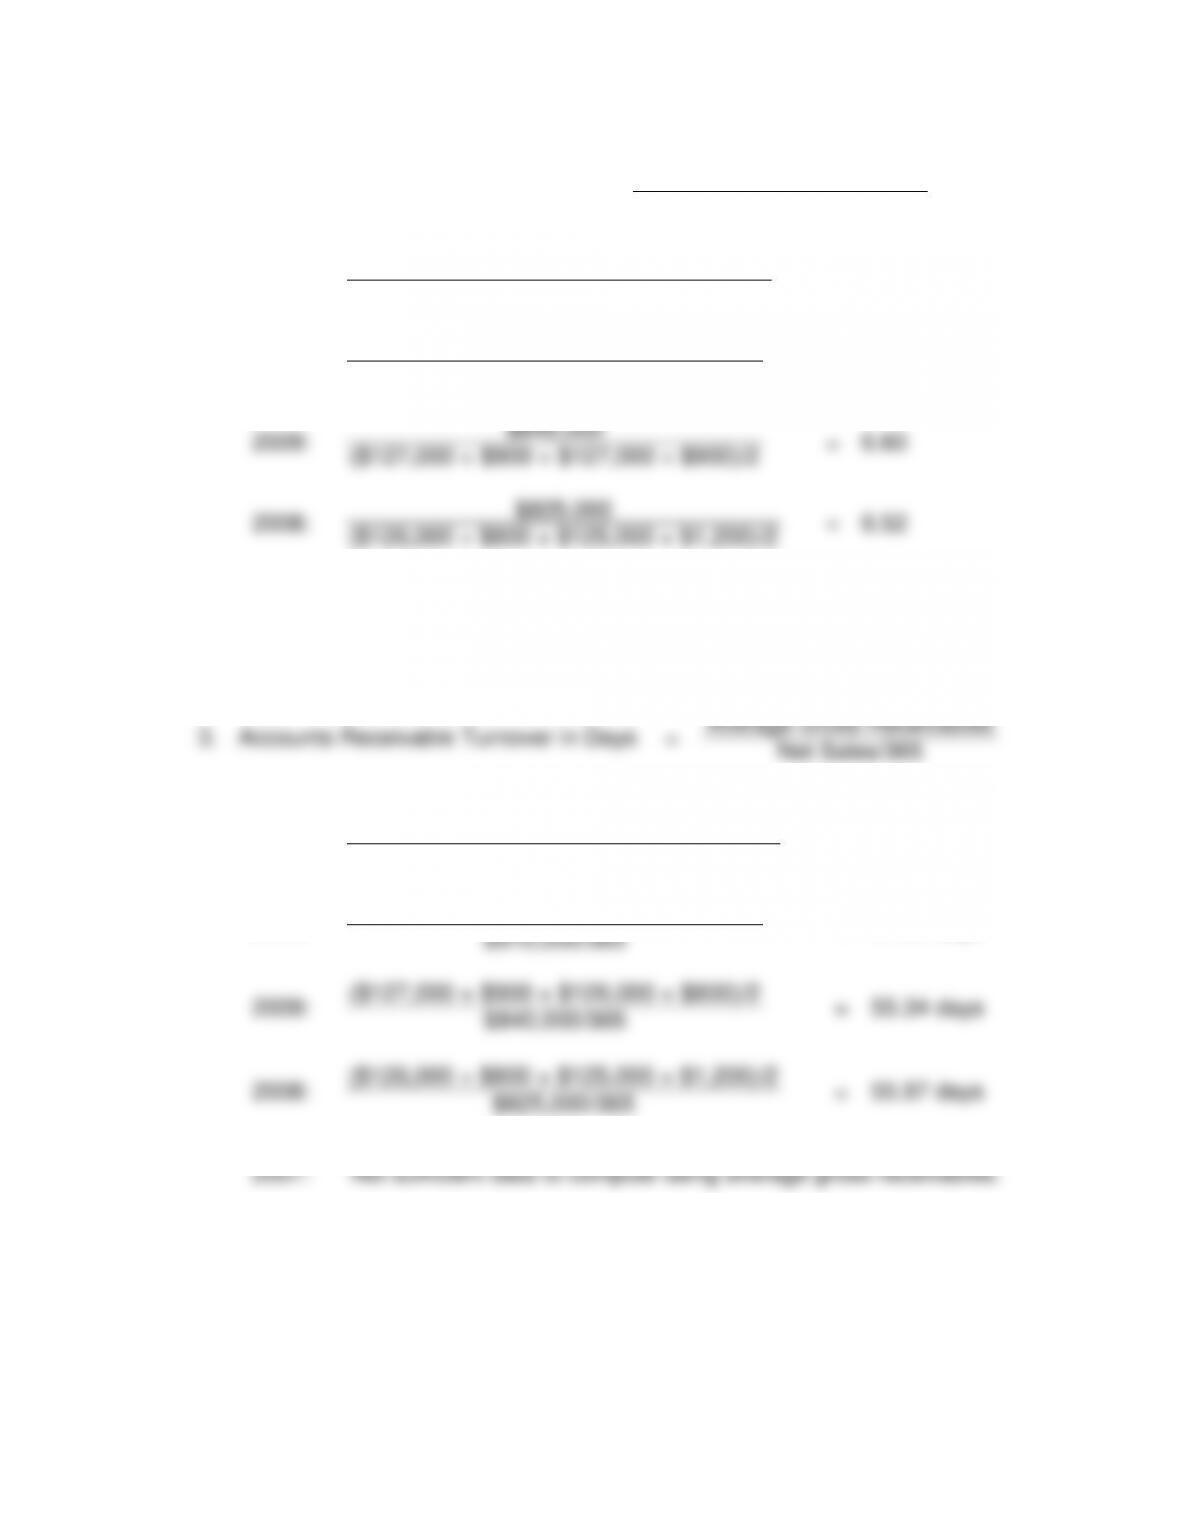
2.
Accounts Receivable Turnover
=
Net Sales
Average Gross Receivables
2011:
$880,000
=
6.75
(131,000 + $1,000 + $128,000 + $900)/2
2010:
$910,000
=
7.09
($128,000 + $900 + $127,000 + $900)/2
2009:
$840,000
=
6.60
($127,000 + $900 + $127,000 + $900)/2
2008:
$825,000
=
6.52
($126,000 + $800 + $125,000 + $1,200)/2
2007:
Not sufficient data to compute using average gross receivables.
3.
Accounts Receivable Turnover in Days
=
Average Gross Receivables
Net Sales/365
2011:
($131,000 + $1,000 + $128,000 + $900)/2
=
54.11 days
$880,000/365
2010:
($128,000 + $900 + $127,000 + $900)/2
=
51.50 days
$910,000/365
2009:
($127,000 + $900 + $126,000 + $800)/2
=
55.34 days
$840,000/365
2008:
($126,000 + $800 + $125,000 + $1,200)/2
=
55.97 days
$825,000/365
2007:
Not sufficient data to compute using average gross receivables.
162
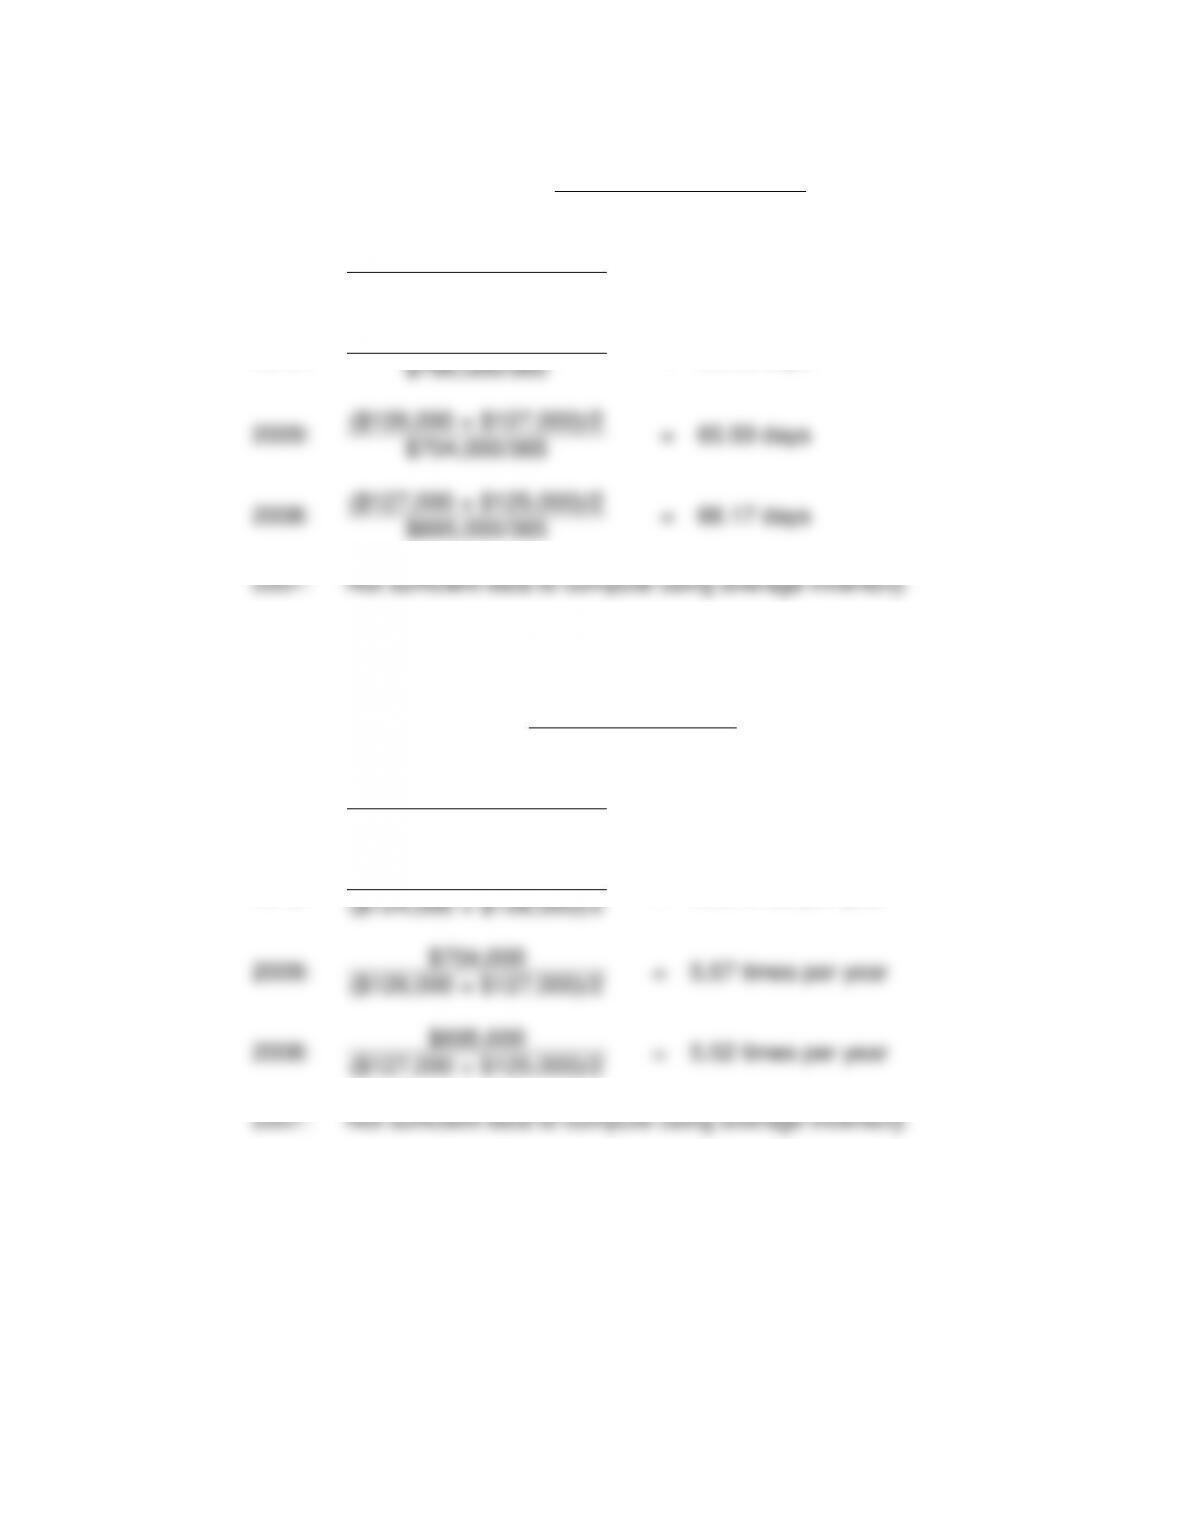
4.
Days’ Sales In Inventory
=
Average Inventory
Cost of Goods Sold/365
2011:
($122,000 + $124,000)/2
=
60.67 days
$740,000/365
2010:
($124,000 + $126,000)/2
=
60.03 days
$760,000/365
2009:
($126,000 + $127,000)/2
=
65.59 days
$704,000/365
2008:
($127,000 + $125,000)/2
=
66.17 days
$695,000/365
2007:
Not sufficient data to compute using average inventory.
5.
Inventory Turnover
=
Cost of Goods Sold
Average Inventory
2011:
$740,000
=
6.02 times per year
($122,000 + $124,000)/2
2010:
$760,000
=
6.08 times per year
($124,000 + $126,000)/2
2009:
$704,000
=
5.57 times per year
($126,000 + $127,000)/2
2008:
$695,000
=
5.52 times per year
($127,000 + $125,000)/2
2007:
Not sufficient data to compute using average inventory.
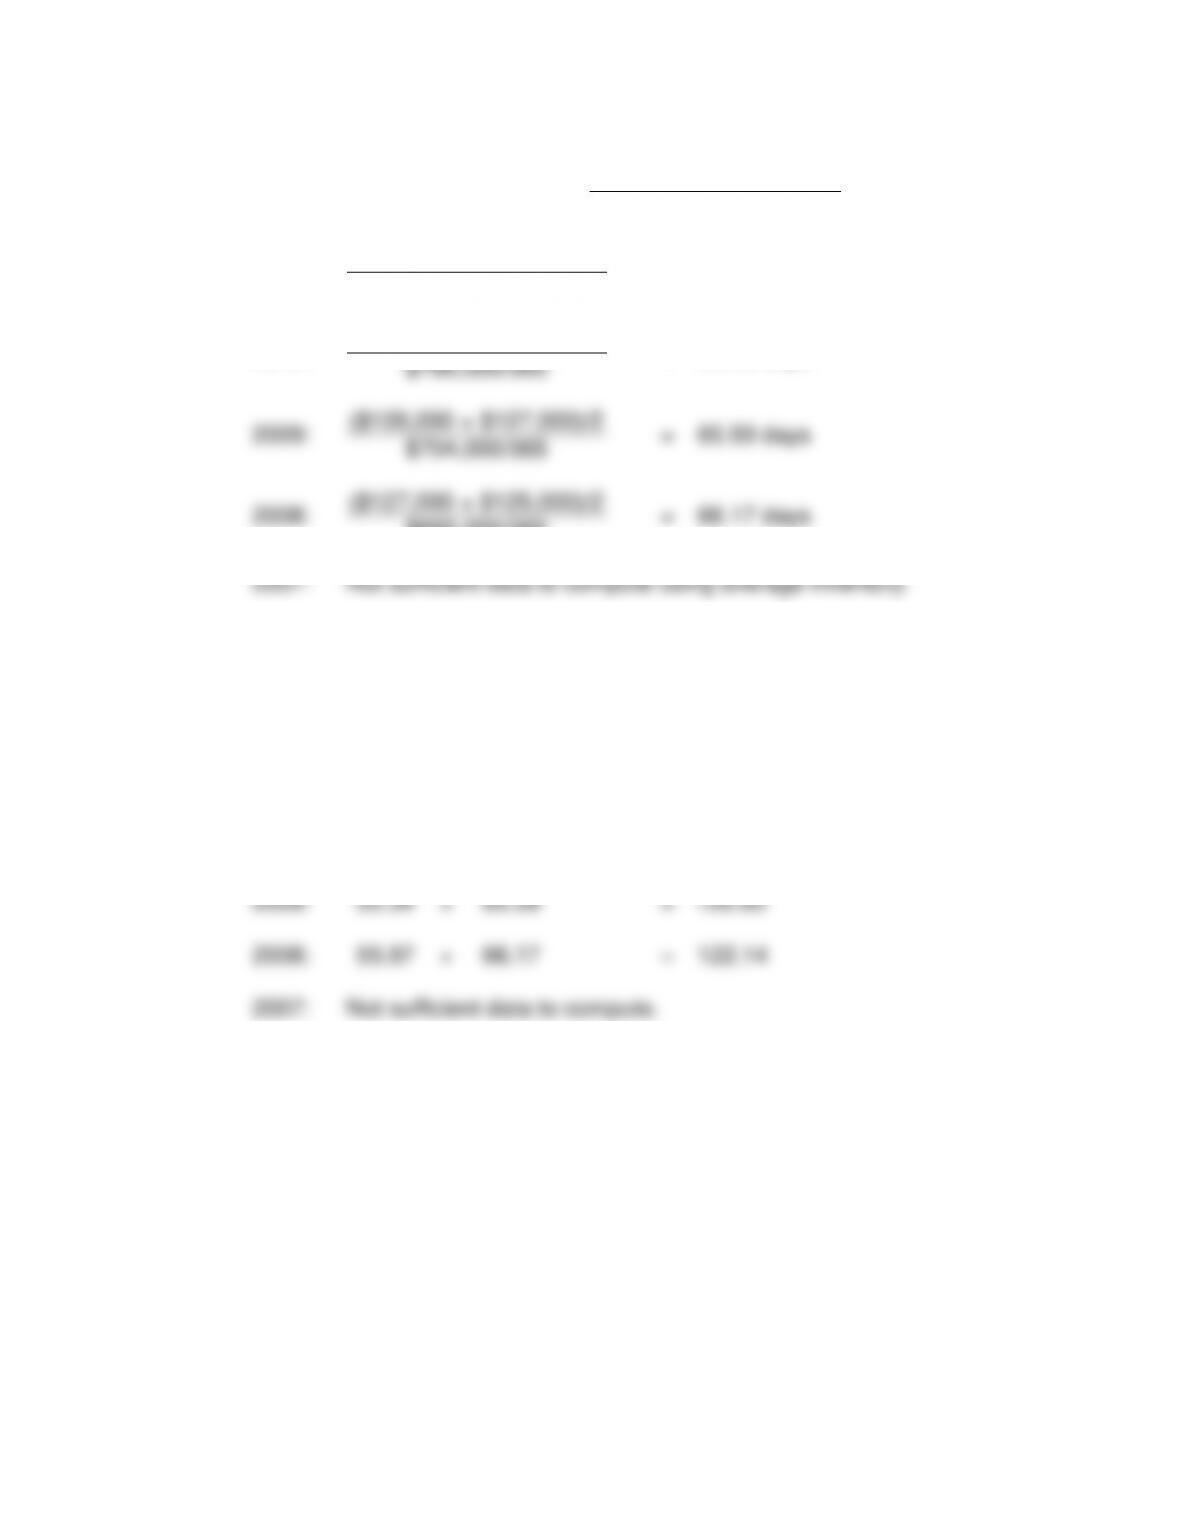
6.
Inventory Turnover In Days
=
Average Inventory
Cost of Goods Sold/365
2011:
($122,000 + $124,000)/2
=
60.67 days
$740,000/365
2010:
($124,000 + $126,000)/2
=
60.03 days
$760,000/365
($126,000 + $127,000)/2
$704,000/365
($127,000 + $125,000)/2
$695,000/365
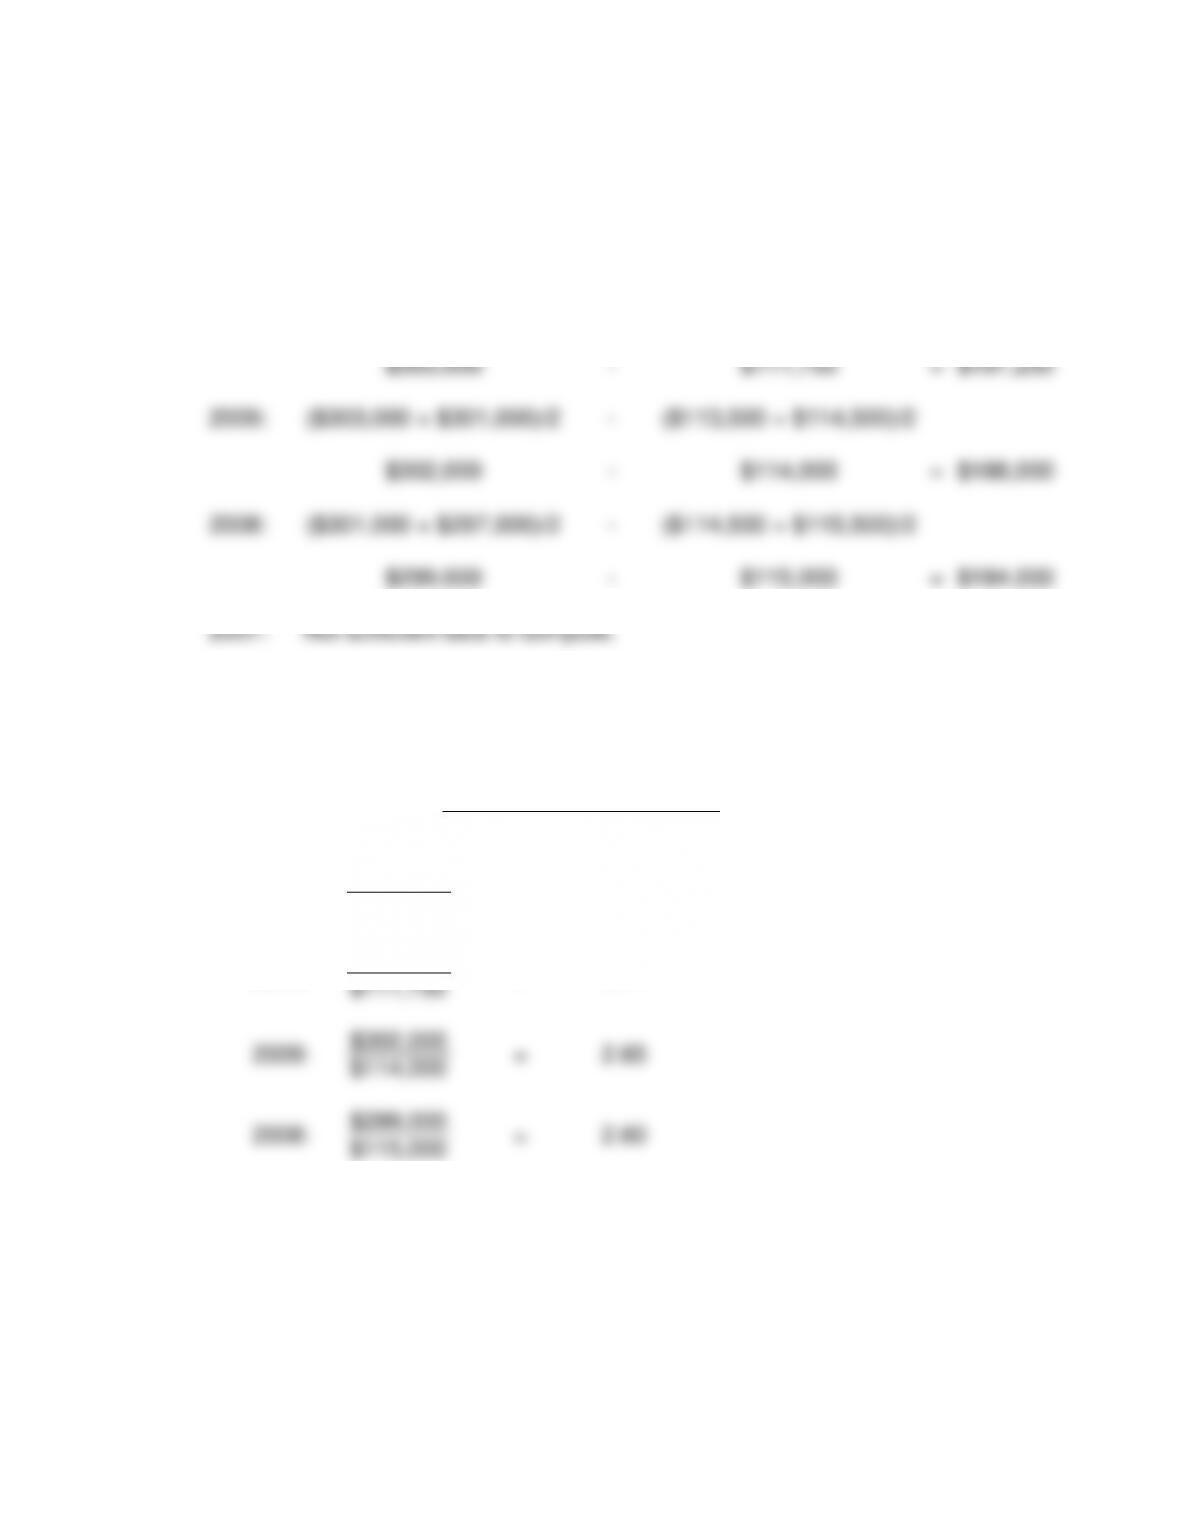
8.
Working Capital
=
Average Current Assets
–
Average Current Liabilities
2011:
($305,200 + $303,000)/2
–
($109,500 + $110,000)/2
$304,100
–
$109,750
=
$194,350
2010:
($303,000 + $303,000)/2
–
($110,000 + $113,500)/2
$303,000
–
$111,750
=
$191,250
2009:
($303,000 + $301,000)/2
–
($113,500 + $114,500)/2
2008:
($301,000 + $297,000)/2
–
($114,500 + $115,500)/2
$299,000
–
$115,000
=
$184,000
2007:
Not sufficient data to compute.
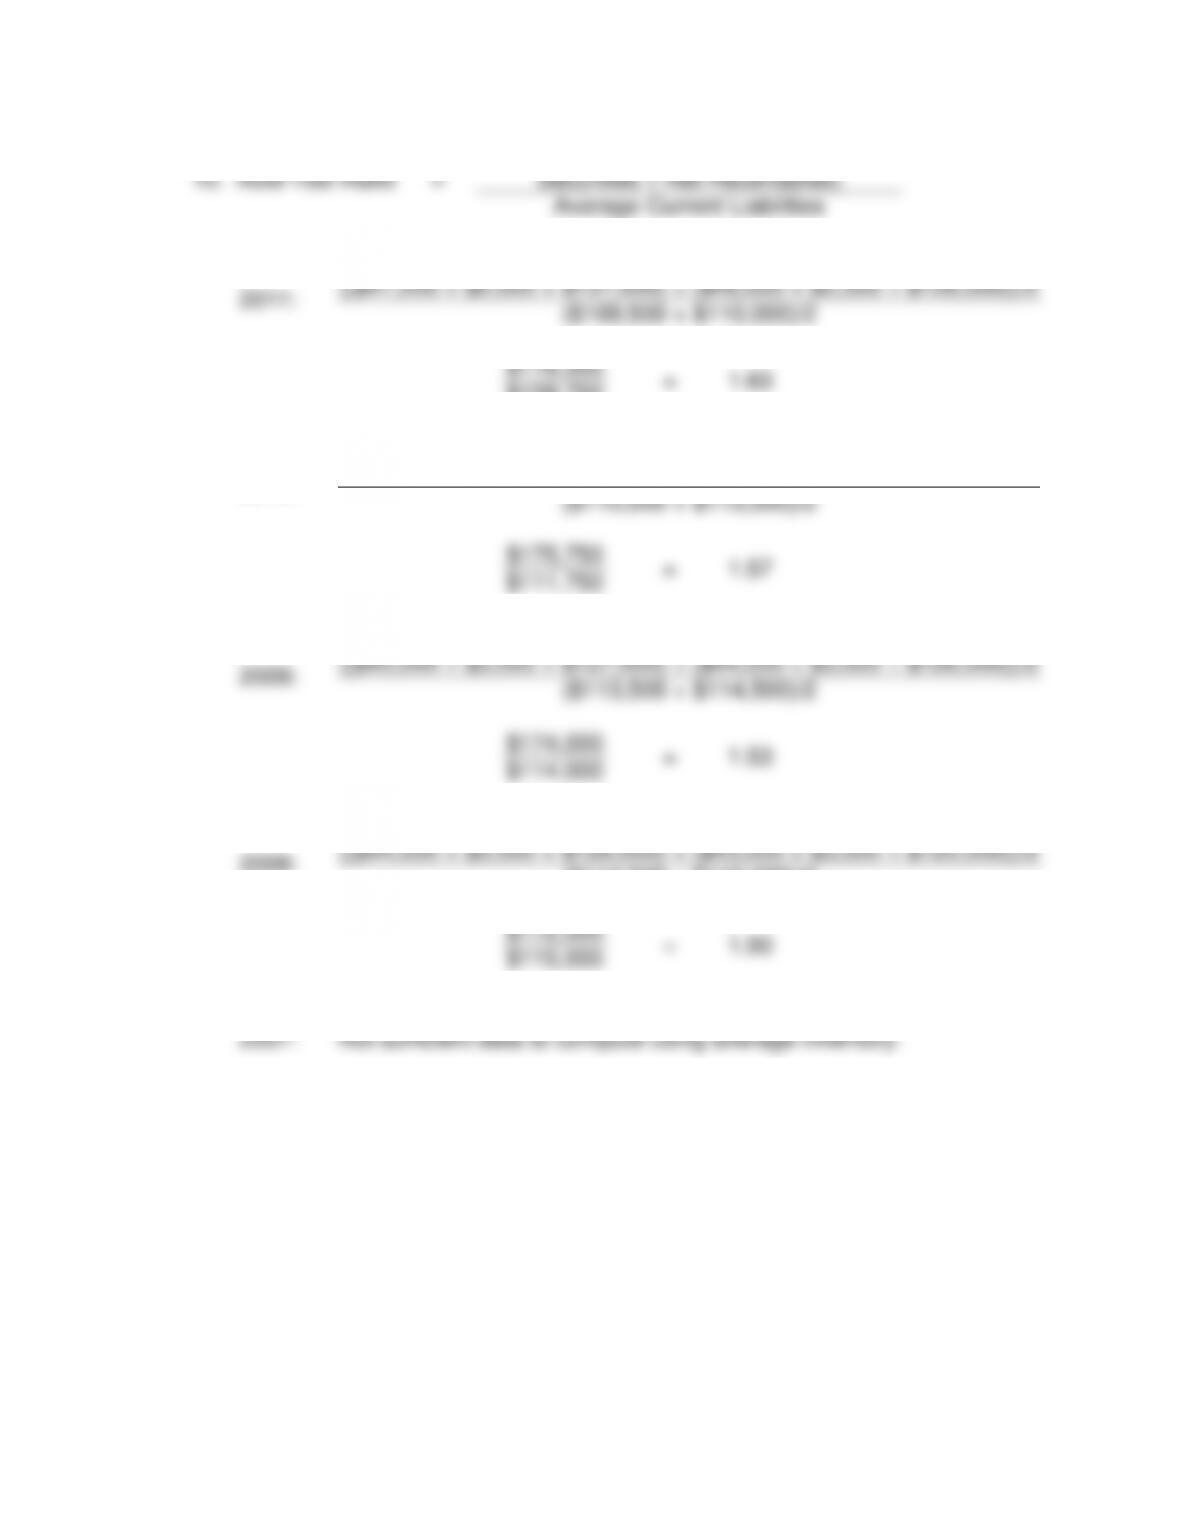
9.
Current Ratio
=
Average Current Assets
Average Current Liabilities
2011:
$304,100
=
2.77
$109,750
2010:
$303,000
=
2.71
$111,750
$302,000
$114,000
$115,000
2007:
Not sufficient data to compute using average inventory.
10.
Acid-Test Ratio
=
Average (Cash Equivalents + Marketable
Securities + Net Receivables)
Average Current Liabilities
2011:
(($47,200 + $2,000 + $131,000) + ($46,000 + $2,500 + $128,000))/2
($109,500 + $110,000)/2
$178,350
=
1.63
$109,750
2010:
(($46,000 + $2,500 + $128,000) + ($45,000 + $3,000 + $127,000))/2
($110,000 + $113,500)/2
$175,750
$111,750
2009:
(($45,000 + $3,000 + $127,000) + ($44,000 + $3,000 + $126,000))/2
($113,500 + $114,500)/2
$174,000
$114,000
2008:
(($44,000 + $3,000 + $126,000) + ($43,000 + $3,000 + $125,000))/2
($114,500 + $115,500)/2
$172,000
=
1.50
$115,000
166
11.
Cash Ratio
=
Average (Cash Equivalents + Marketable Securities)
Average Current Liabilities
2011:
($47,200 + $2,000) + ($46,000 + $2,500)/2
($109,500 + $110,000)/2
$48,850
=
0.45
$109,750
2010:
($46,000 + $2,500) + ($45,000 + 3,000)/2
($110,000 + $113,500)/2
$48,250
=
0.43
$111,750
2009:
($45,000 + $3,000) + ($44,000 + 3,000)/2
($113,500 + $114,500)/2
$47,500
=
0.42
$114,000
2009:
($44,000 + $3,000) + ($43,000 + 3,000)/2
($114,500 + $115,500)/2
$46,500
=
0.40
$115,000
2007:
Not sufficient data to compute using average inventory.
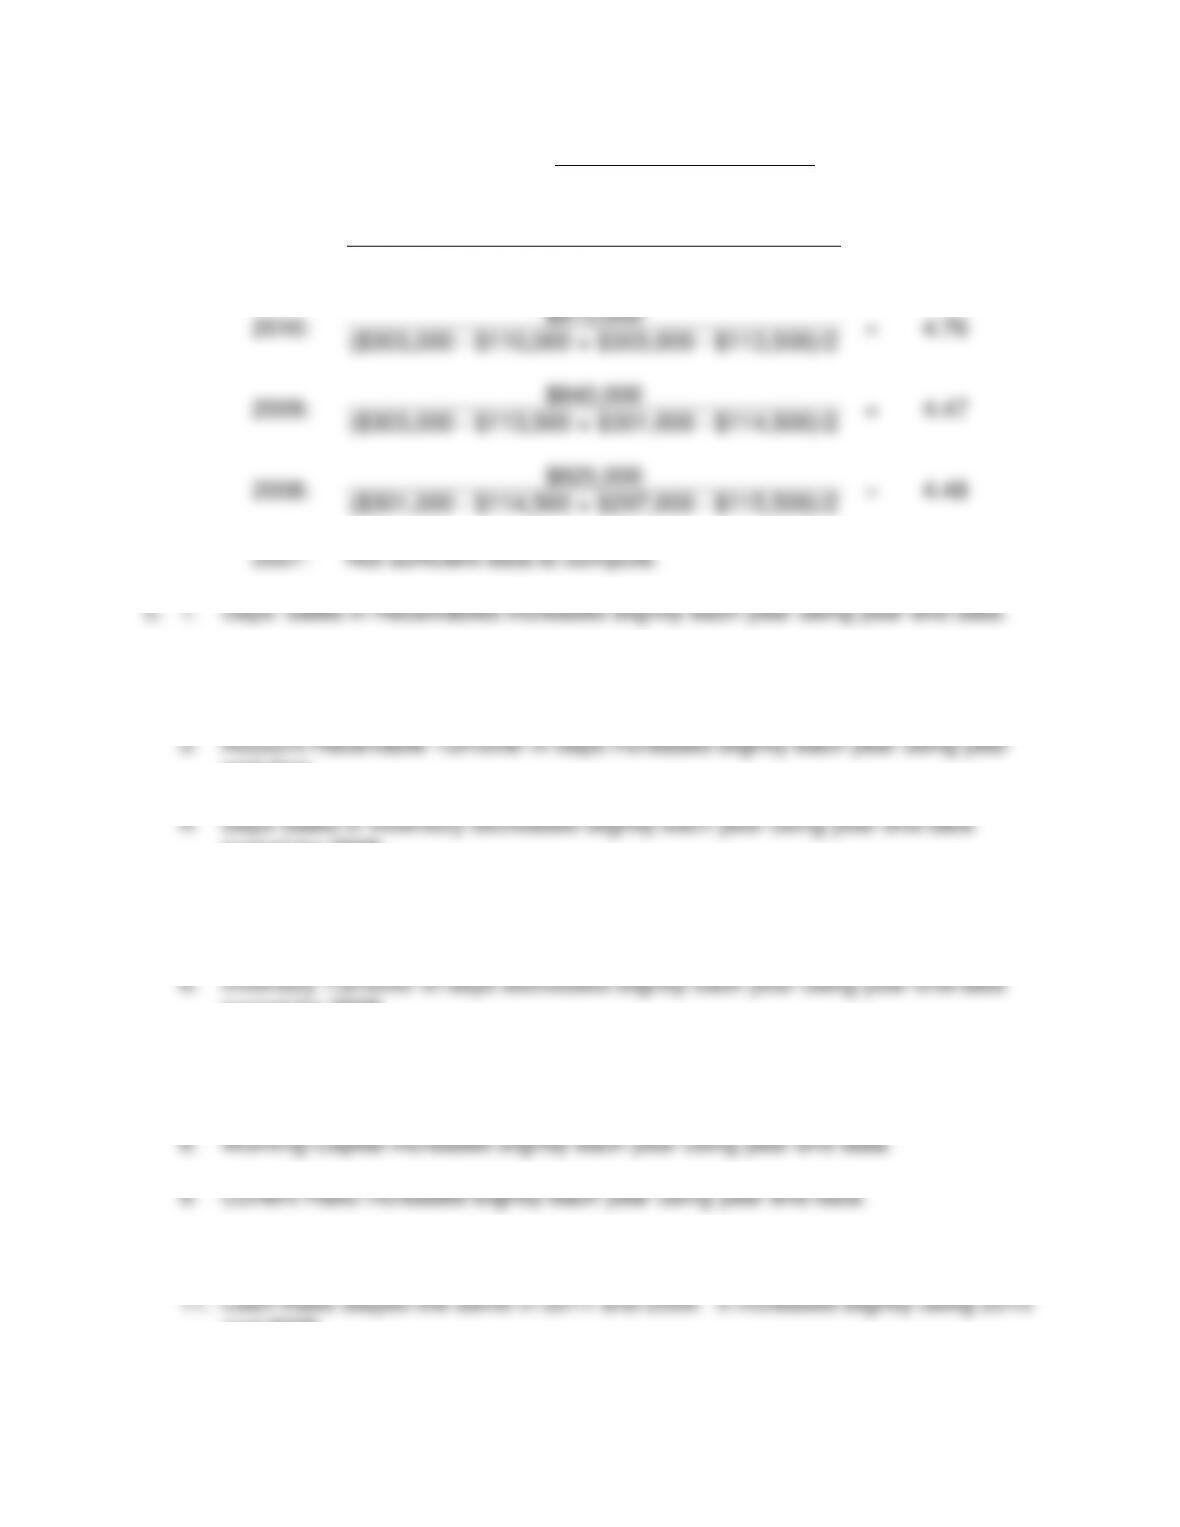
12.
Sales to Working Capital
=
Net Sales
Average Working Capital
2011:
$880,000
=
4.53
($305,200 – $109,500 + $303,000 – $110,000)/2
2010:
$910,000
=
4.76
($303,000 – $110,000 + $303,000 – $113,500)/2
2009:
$840,000
=
4.47
($303,000 – $113,500 + $301,000 – $114,500)/2
$825,000