100
Chapter 5
Basics of Analysis
QUESTIONS
5 – 1. A ratio is a fraction comparing two numbers. Ratios make the comparisons in
5 – 2. a. Liquidity is the ability to meet current obligations. Short-term creditors
ratios.
c. Profitability means earning ability. Investors would be particularly
5 – 3. Comparisons of historical data, industry average, earnings of competitors, etc.
5 – 4. An absolute change would be plus or minus X dollars; a percentage change
5 – 5. Horizontal analysis expresses an item in relation to that same item for a
previous base year. This analysis measures change over time.
Example
year.
Example
analysis would show selling expenses as 10% of 2010 sales.
both for ratios and absolute figures.
5 – 7. When comparing two firms of different size, relative figures are most
101
employers, suppliers, regulators, auditors, and consumers also use financial
reports.
5 – 9. Managers analyze data to study profitability, evaluate how efficiently they use
5 –10. a. Best Buy Co. (Exhibit 5-3)
Current assets is the single-largest asset category. This would be typical
for a retailer. Property and equipment will often be a high category
(capital) assets.
Kelly Services, Inc. (Exhibit 5-4)
Cooper Tire & Rubber Company (Exhibit 5-5)
b. Cooper Tire & Rubber Company
We would expect a manufacturing firm to have a large amount in current
goods, and supplies. A retail firm will only have merchandise inventories.
left in a semi-finished state.
5 –14. Reference Book of Corporate Managements
5 –15. a. 13
102
wholesale trade.
5 –16. a. Yes. The Department of Commerce Financial Reports includes industry
5 –17. a. The SIC is the Standard Industrial Classification. It was developed for
use in the classification of establishments by type of activity in which
they are engaged.
b. The North American Industry Classification system (NAICS) was created
jointly by the United States, Canada, and Mexico. NAICS provides
enhanced industry comparability among the three NAFTA trading
partners.
services-producing industries.
5 –18. Standard & Poor’s Register of Corporations, Directors and Executives, Volume
2, Section 5, lists the officer deaths that have been reported to the publisher.
1. Mergent dividend record, and
2. Standard & Poor’s Annual Dividend Record
5 –23. Standard & Poor’s Statistical Services
103
5 –25. 1. Standard & Poor’s Industry Survey
PROBLEMS
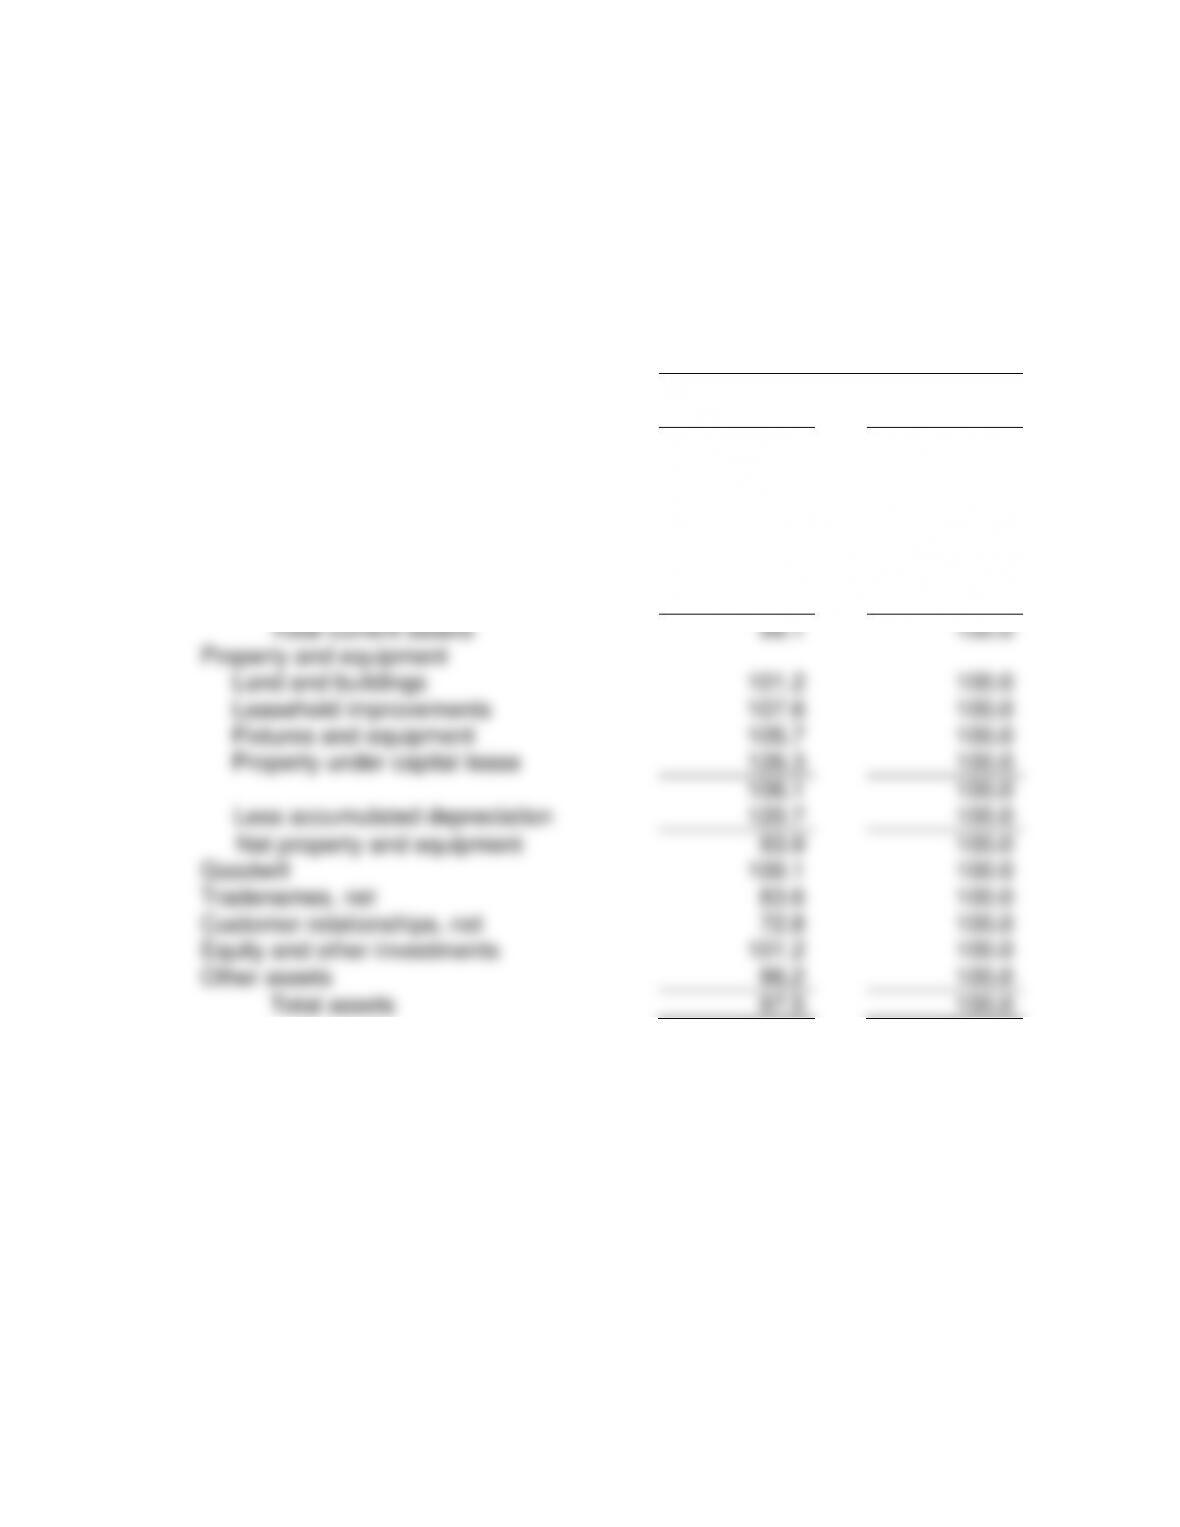
PROBLEM 5-1
a.
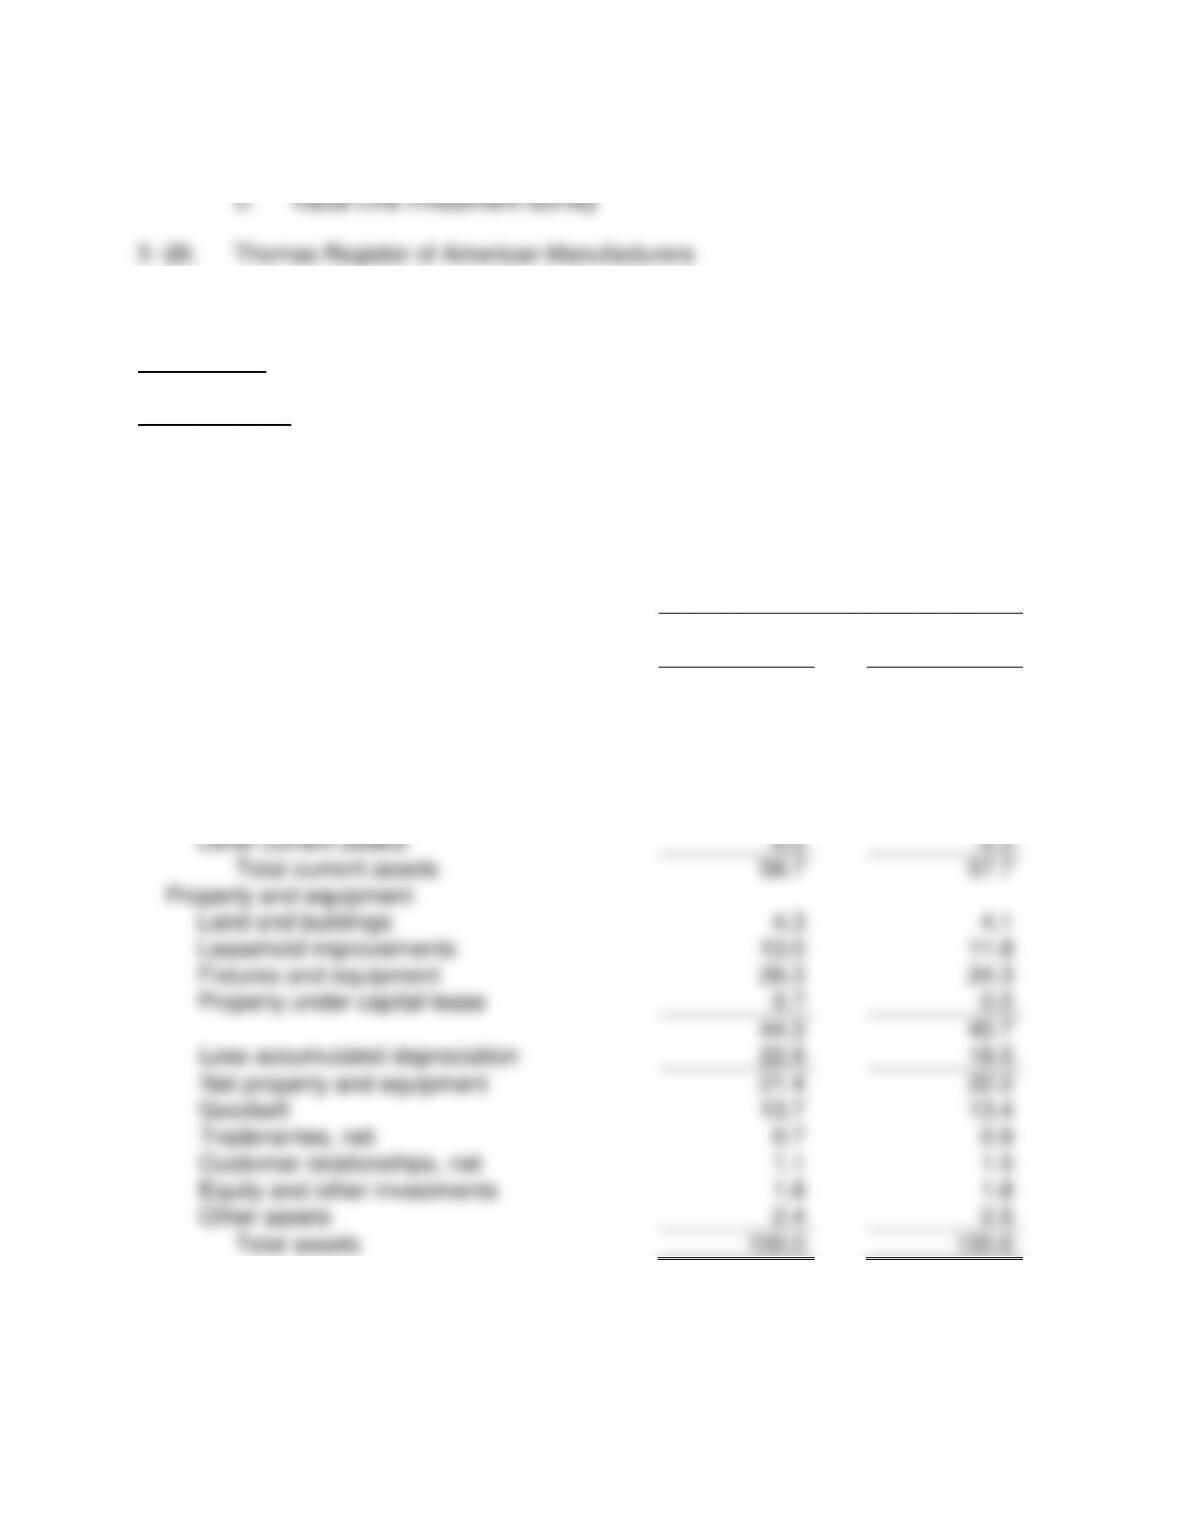
Best Buy Co., Inc.
Vertical Common-Size Balance Sheet
In Percentage*
February 26,
2011
February 27,
2010
Assets
Current assets
Cash and cash equivalents
6.2
10.0
Short-term investments
0.1
0.5
Receivables
13.2
11.0
Merchandise inventories
33.0
30.0
Other current assets
6.2
6.3
Total current assets
58.7
57.7
Property and equipment
Land and buildings
4.3
4.1
Leasehold improvements
13.0
11.8
Fixtures and equipment
26.3
24.3
Property under capital lease
0.7
0.5
44.3
40.7
Less accumulated depreciation
22.9
18.5
Net property and equipment
21.4
22.2
Goodwill
13.7
13.4
Tradenames, net
0.7
0.9
Customer relationships, net
1.1
1.5
Equity and other investments
1.8
1.8
Other assets
2.4
2.5
Total assets
100.0
100.0
*Some rounding differences
104
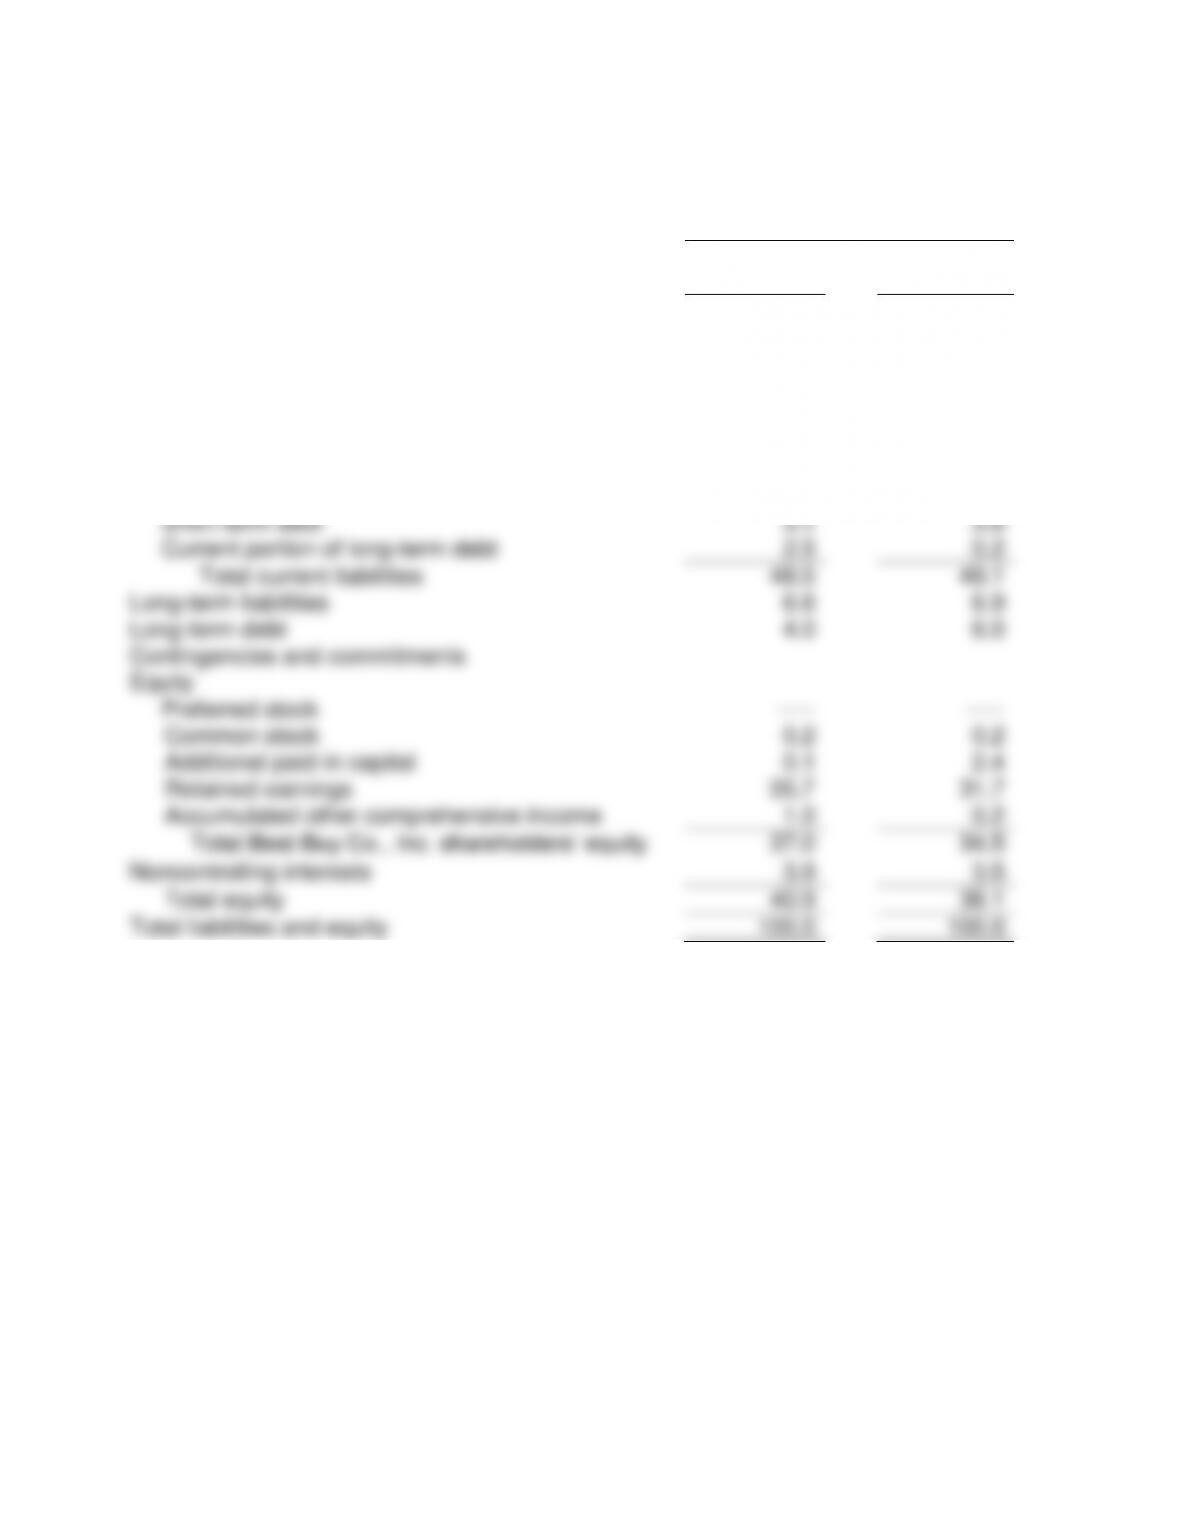
Problem 5-1a Continued
In Percentage*
February 26,
2011
February 27,
2010
Liabilities and equity
Current liabilities
Accounts payable
27.4
28.8
Unredeemed gift card liabilities
2.7
2.5
Accrued compensation and related
expense
3.2
3.0
Accrued liabilities
8.2
9.2
Accrued income taxes
1.4
1.7
Short-term debt
3.1
3.6
Current portion of long-term debt
2.5
0.2
Total current liabilities
48.5
49.1
Long-term liabilities
6.6
6.9
Long-term debt
4.0
6.0
Contingencies and commitments
Equity
Preferred stock
—–
—–
Common stock
0.2
0.2
Additional paid-in capital
0.1
2.4
Retained earnings
35.7
31.7
Accumulated other comprehensive income
1.0
0.2
Total Best Buy Co., Inc. shareholders’ equity
37.0
34.5
Noncontrolling interests
3.9
3.5
Total equity
40.9
38.1
Total liabilities and equity
100.0
100.0
* Some rounding differences
105
Problem 5-1 Continued
b.
Best Buy Co., Inc.
Horizontal Common-Size Balance Sheet
In Percentage
February 26,
2011
February 27,
2010
Assets
Current assets
Cash and cash equivalents
60.5
100.0
Short-term investments
24.4
100.0
Receivables
116.2
100.0
Merchandise inventories
107.5
100.0
Other current assets
96.4
100.0
Total current assets
99.1
100.0
Property and equipment
Land and buildings
101.2
100.0
Leasehold improvements
107.6
100.0
Fixtures and equipment
105.7
100.0
Property under capital lease
126.3
100.0
106.1
100.0
Less accumulated depreciation
120.7
100.0
Net property and equipment
93.9
100.0
Goodwill
100.1
100.0
Tradenames, net
83.6
100.0
Customer relationships, net
72.8
100.0
Equity and other investments
101.2
100.0
Other assets
96.2
100.0
Total assets
97.5
100.0
106
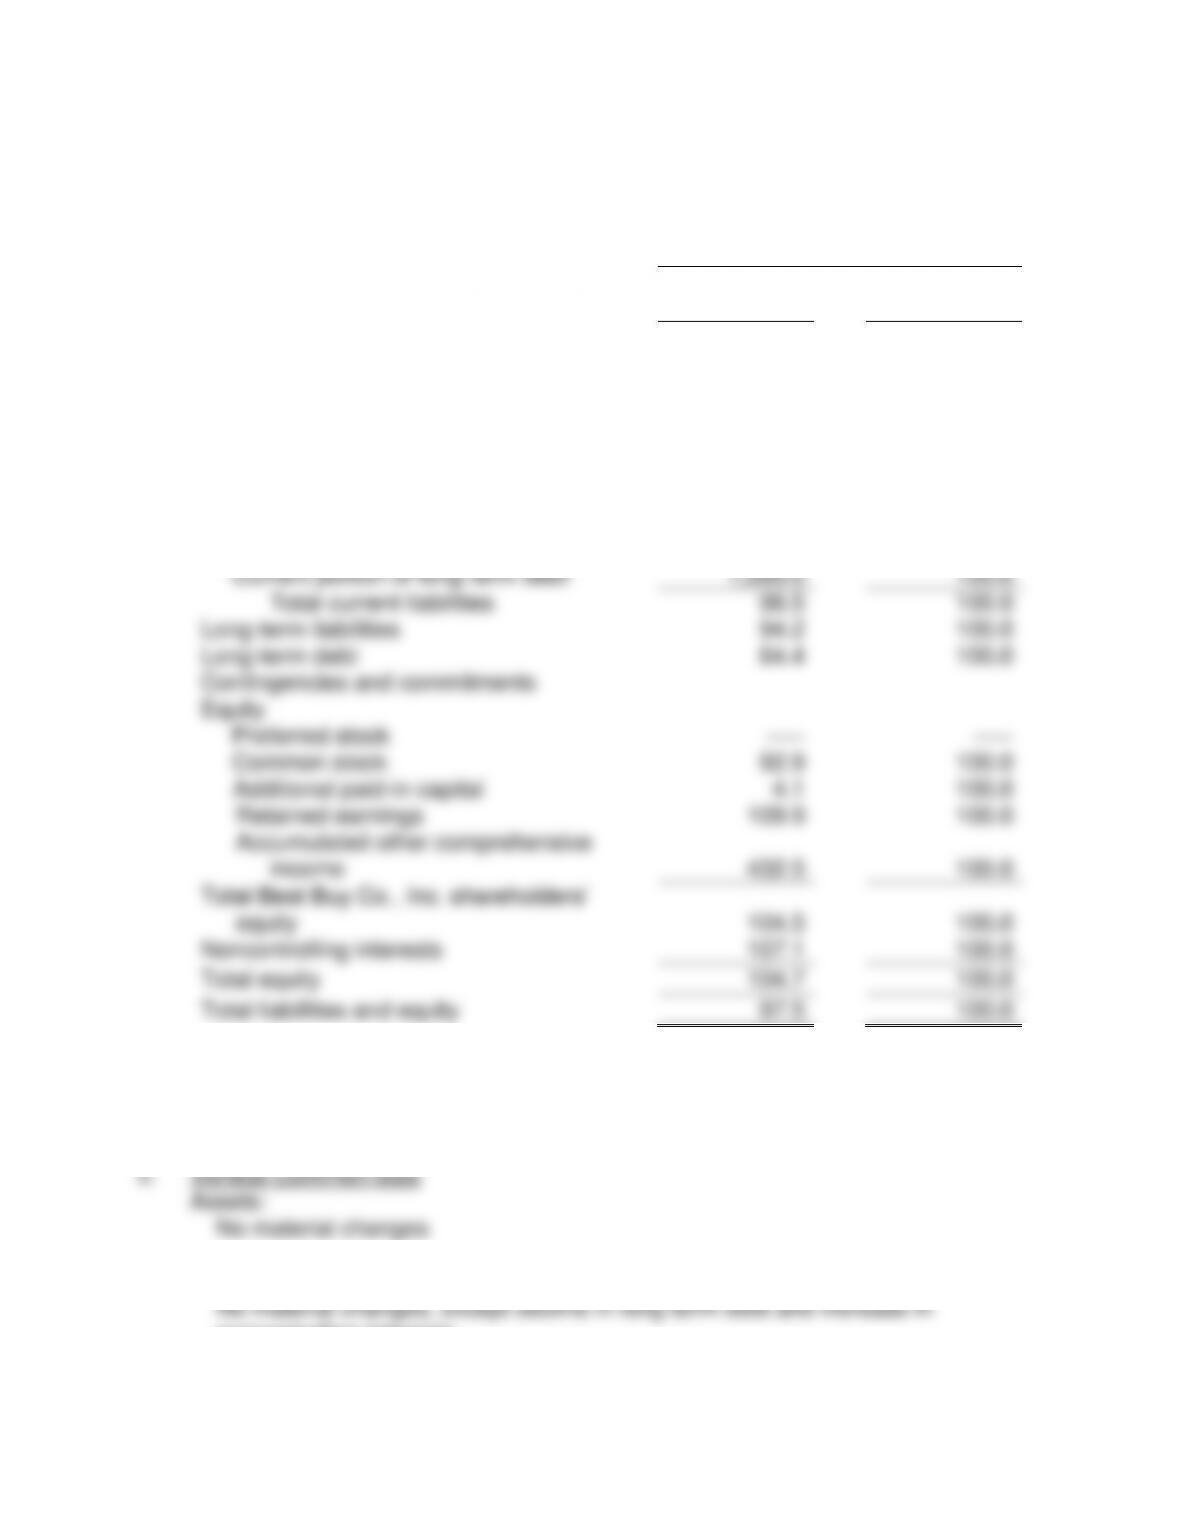
Problem 5-1b Continued
In Percentage
February 26,
2011
February 27,
2010
Liabilities and equity
Current liabilities
Accounts payable
92.8
100.0
Unredeemed gift card liabilities
102.4
100.0
Accrued compensation and related
expense
104.8
100.0
Accrued liabilities
87.5
100.0
Accrued income taxes
81.0
100.0
Short-term debt
84.0
100.0
Current portion of long-term debt
1,260.0
100.0
Total current liabilities
96.5
100.0
Long-term liabilities
94.2
100.0
Long-term debt
64.4
100.0
Contingencies and commitments
Equity
Preferred stock
—–
—–
Common stock
92.9
100.0
Additional paid-in capital
4.1
100.0
Retained earnings
109.9
100.0
Accumulated other comprehensive
income
432.5
100.0
Total Best Buy Co., Inc. shareholders’
equity
104.5
100.0
Noncontrolling interests
107.1
100.0
Total equity
104.7
100.0
Total liabilities and equity
97.5
100.0
Problem 5-1 Continued
Liabilities:
noncontrolling interests.
A substantial increase in total Best Buy Co., Inc. shareholders’ equity and total
107
equity.
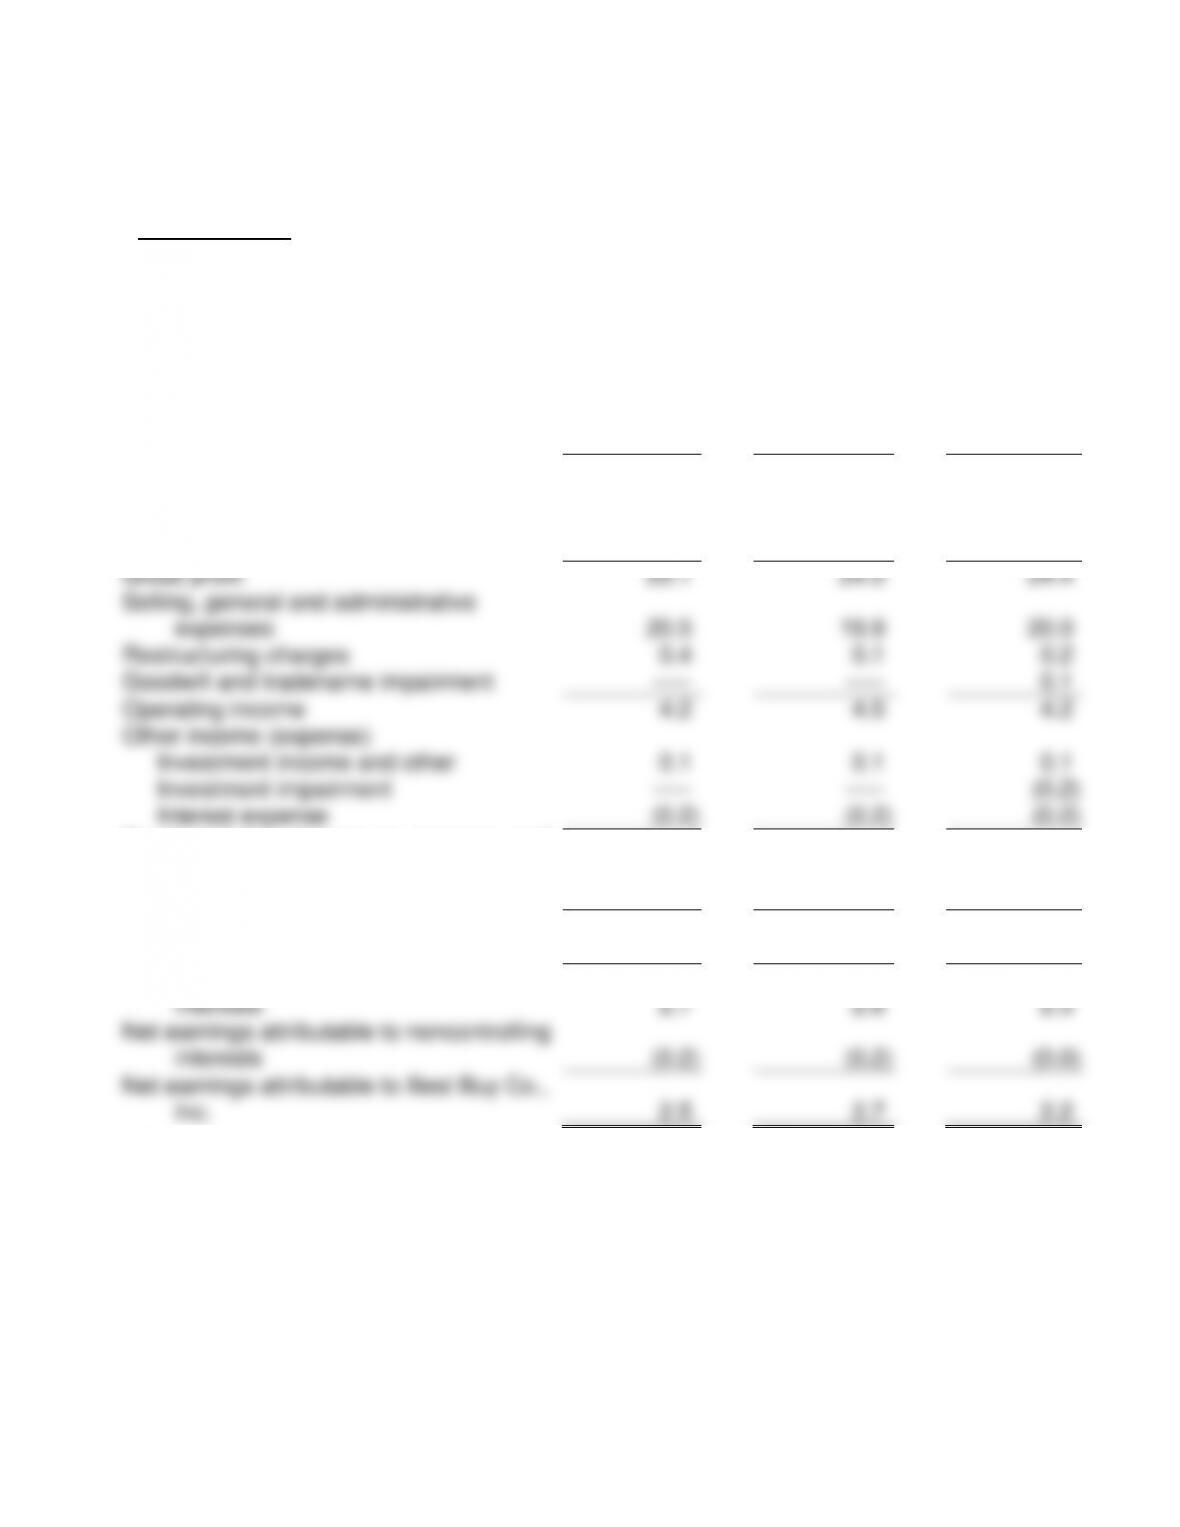
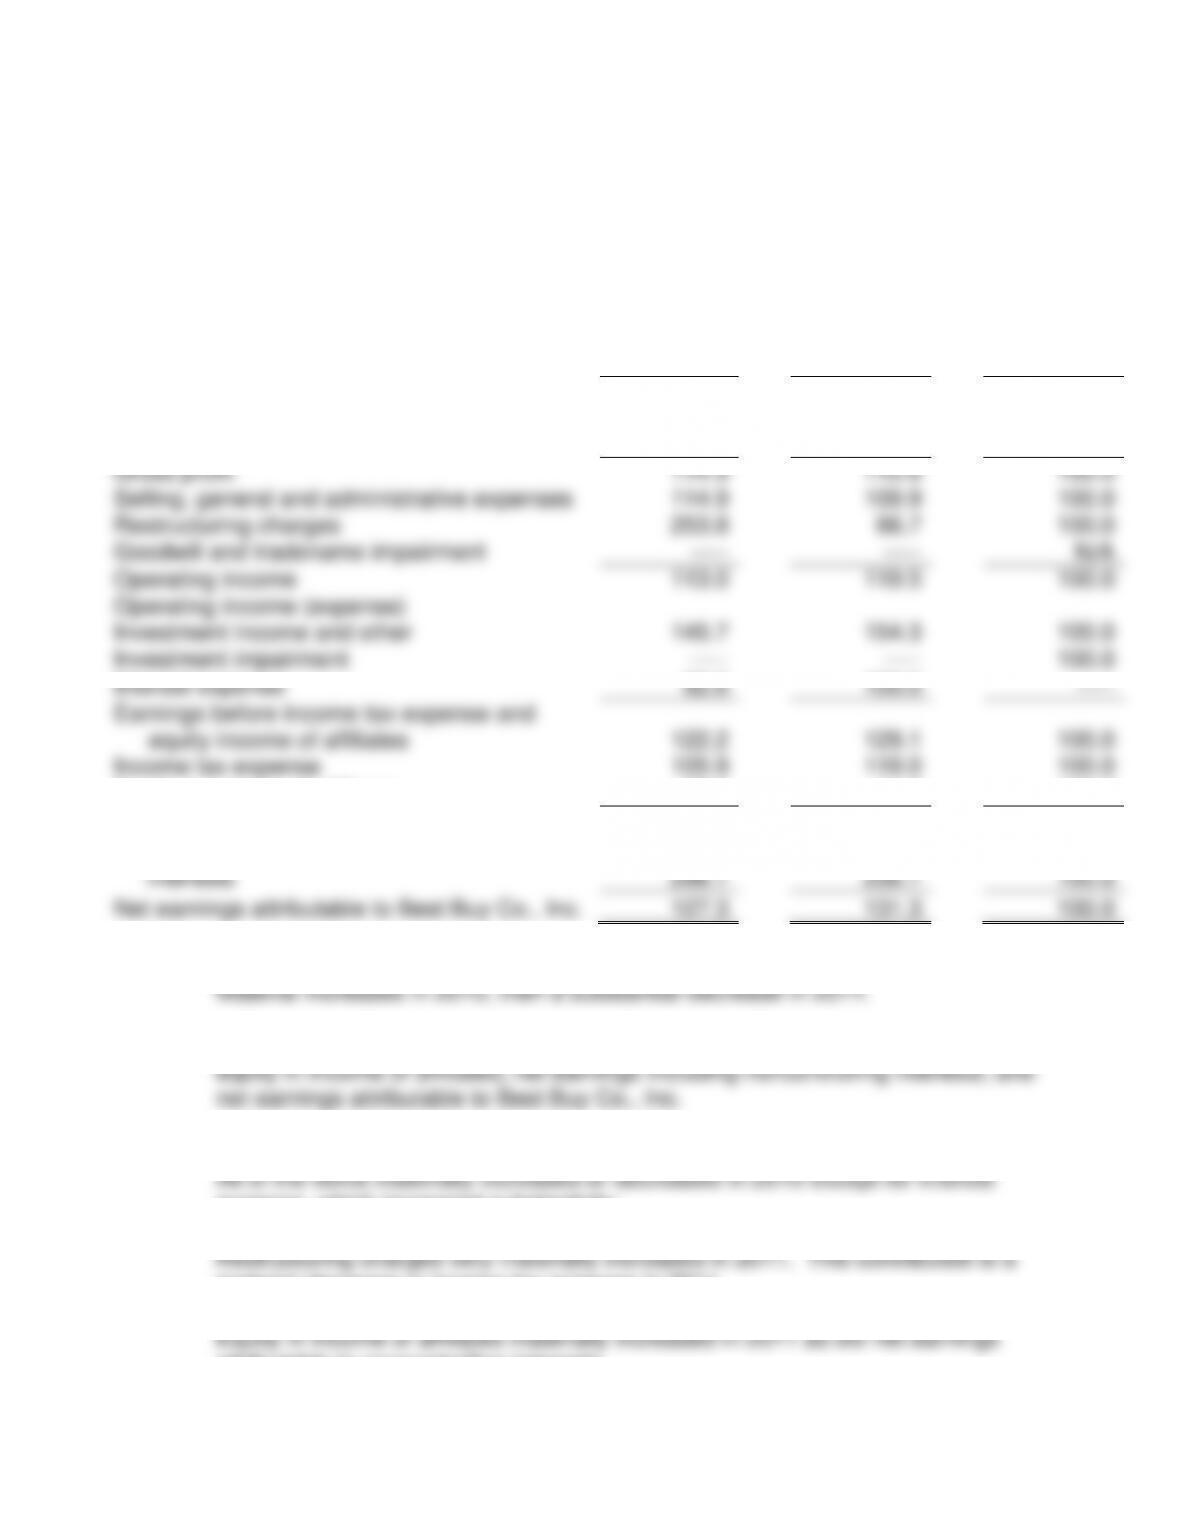
PROBLEM 5-2
a.
Best Buy Co., Inc.
Consolidated Statements of Earnings
Vertical Common-Size
For the fiscal years ended
February 26,
2011
February 27,
2010
February 28,
2009
Revenue
100.0
100.0
100.0
Cost of goods sold
74.8
75.5
75.6
Restructuring charges – cost of goods
sold
0.0
—–
—–
Gross profit
25.1
24.5
24.4
Selling, general and administrative
expenses
20.5
19.9
20.0
Restructuring charges
0.4
0.1
0.2
Goodwill and tradename impairment
—–
—–
0.1
Operating income
4.2
4.5
4.2
Other income (expense)
Investment income and other
0.1
0.1
0.1
Investment impairment
—–
—–
(0.2)
Interest expense
(0.2)
(0.2)
(0.2)
Earnings before income tax expense, and
equity in income of affiliates
4.1
4.4
3.8
Income tax expense
1.4
1.6
1.5
Equity in income of affiliates
0.0
0.0
0.0
Net earnings including noncontrolling
interests
2.7
2.8
2.3
Net earnings attributable to noncontrolling
interests
(0.2)
(0.2)
(0.0)
Net earnings attributable to Best Buy Co.,
Inc.
2.5
2.7
2.2
108
Problem 5-2 Continued
b.
Best Buy Co., Inc.
Consolidated Statements of Earnings
Horizontal Common-Size
For the fiscal years ended
February 26,
2011
February 27,
2010
February 28,
2009
Revenue
111.7
110.4
100.0
Cost of goods sold
110.6
110.3
100.0
Restructuring charges – cost of goods sold
—–
—–
N/A
Gross profit
114.9
110.6
100.0
Selling, general and administrative expenses
114.9
109.9
100.0
Restructuring charges
253.8
66.7
100.0
Goodwill and tradename impairment
—–
—–
N/A
Operating income
113.0
119.5
100.0
Operating income (expense)
Investment income and other
145.7
154.3
100.0
Investment impairment
—–
—–
100.0
Interest expense
92.6
100.0
—–
Earnings before income tax expense and
equity income of affiliates
122.2
129.1
100.0
Income tax expense
105.9
119.0
100.0
Equity in income of affiliates
28.6
14.3
100.0
Net earnings including noncontrolling interests
132.2
134.9
100.0
Net earnings attributable to noncontrolling
interests
296.7
256.7
100.0
Net earnings attributable to Best Buy Co., Inc.
127.3
131.3
100.0
c. Vertical Common-Size
Material increases in 2010 were in earnings before income tax expense and
Horizontal Common-Size
expense, which increased substantially.
material decrease in income tax expense in 2011.
attributable to noncontrolling interests.
109
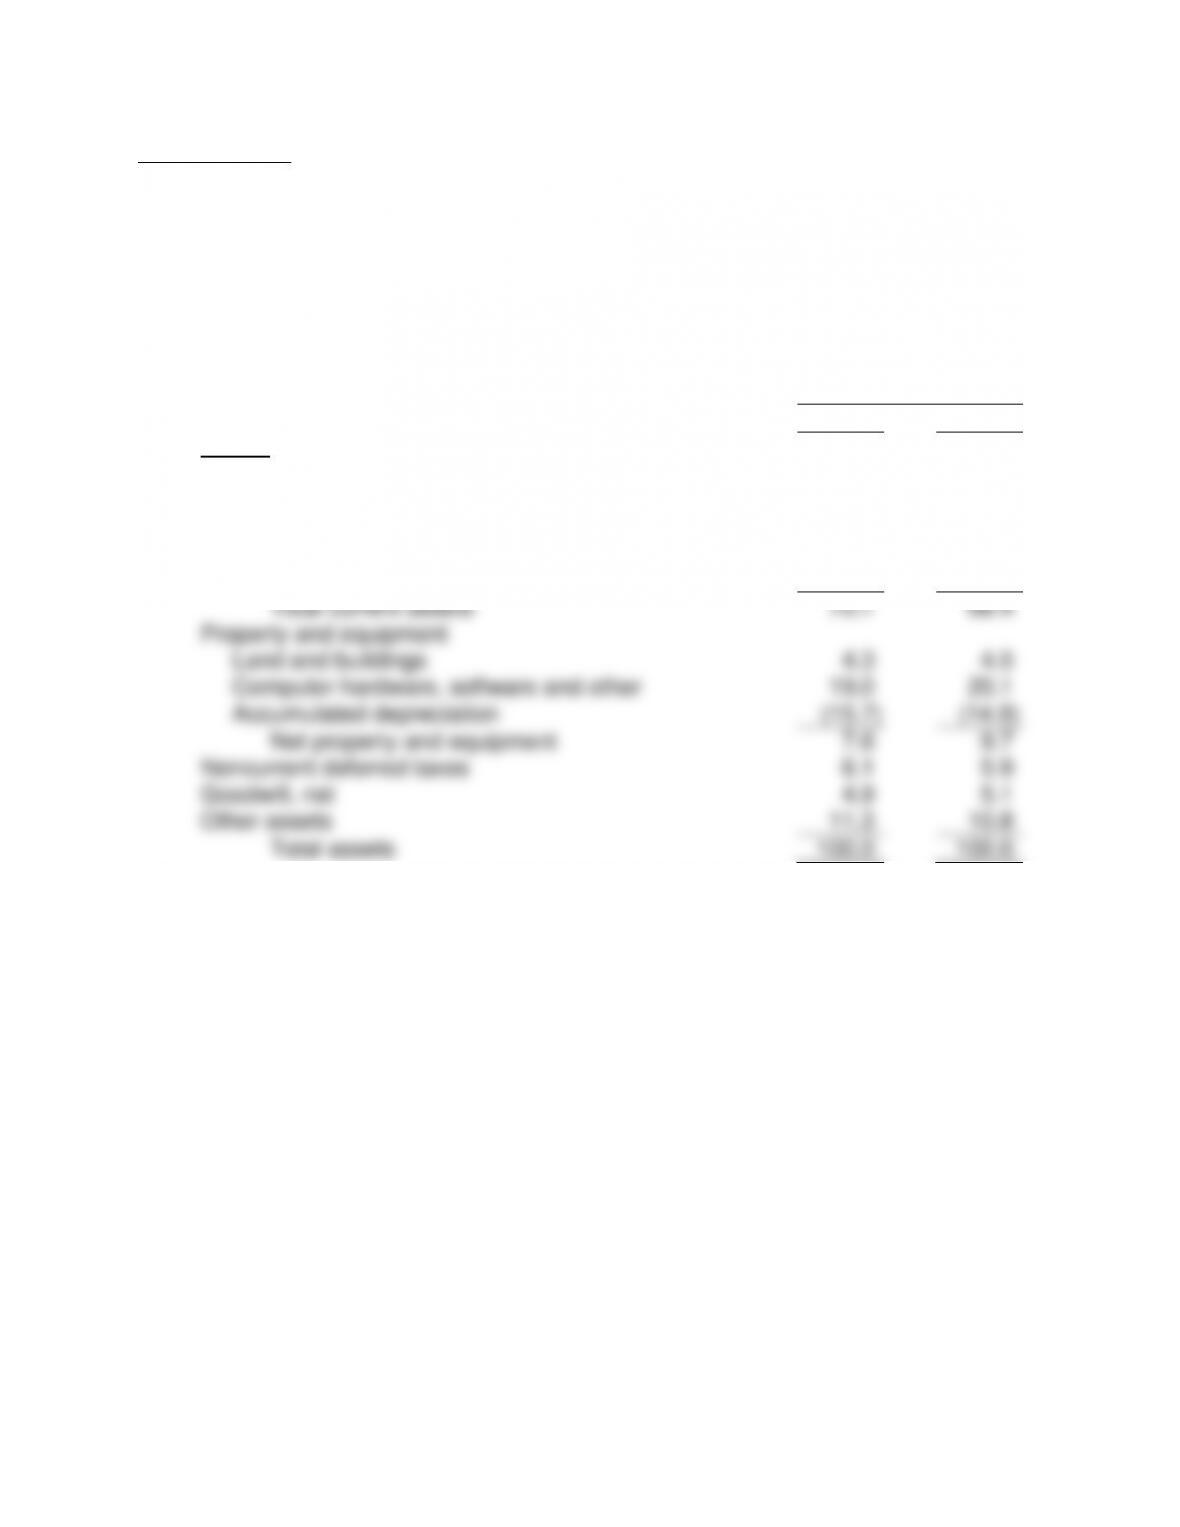
PROBLEM 5-3
a.
Kelly Securities, Inc. and Subsidiaries
Balance Sheets
December 31, 2010 and December 31, 2009
Vertical Common-Size Analysis
In Percentage*
2010
2009
Assets
Current assets
Cash and equivalents
5.9
6.8
Trade accounts receivable
59.3
54.7
Prepaid expenses and other current assets
3.3
5.4
Deferred taxes
1.6
1.6
Total current assets
70.1
68.4
Property and equipment
Land and buildings
4.3
4.5
Computer hardware, software and other
19.0
20.1
Accumulated depreciation
(15.7)
(14.9)
Net property and equipment
7.6
9.7
Noncurrent deferred taxes
6.1
5.9
Goodwill, net
4.9
5.1
Other assets
11.3
10.8
Total assets
100.0
100.0
* There are some rounding differences