Chapter 09
TO THE NET
1. Belden
a. Earnings per common share (basic and diluted)
2010
2009
2008
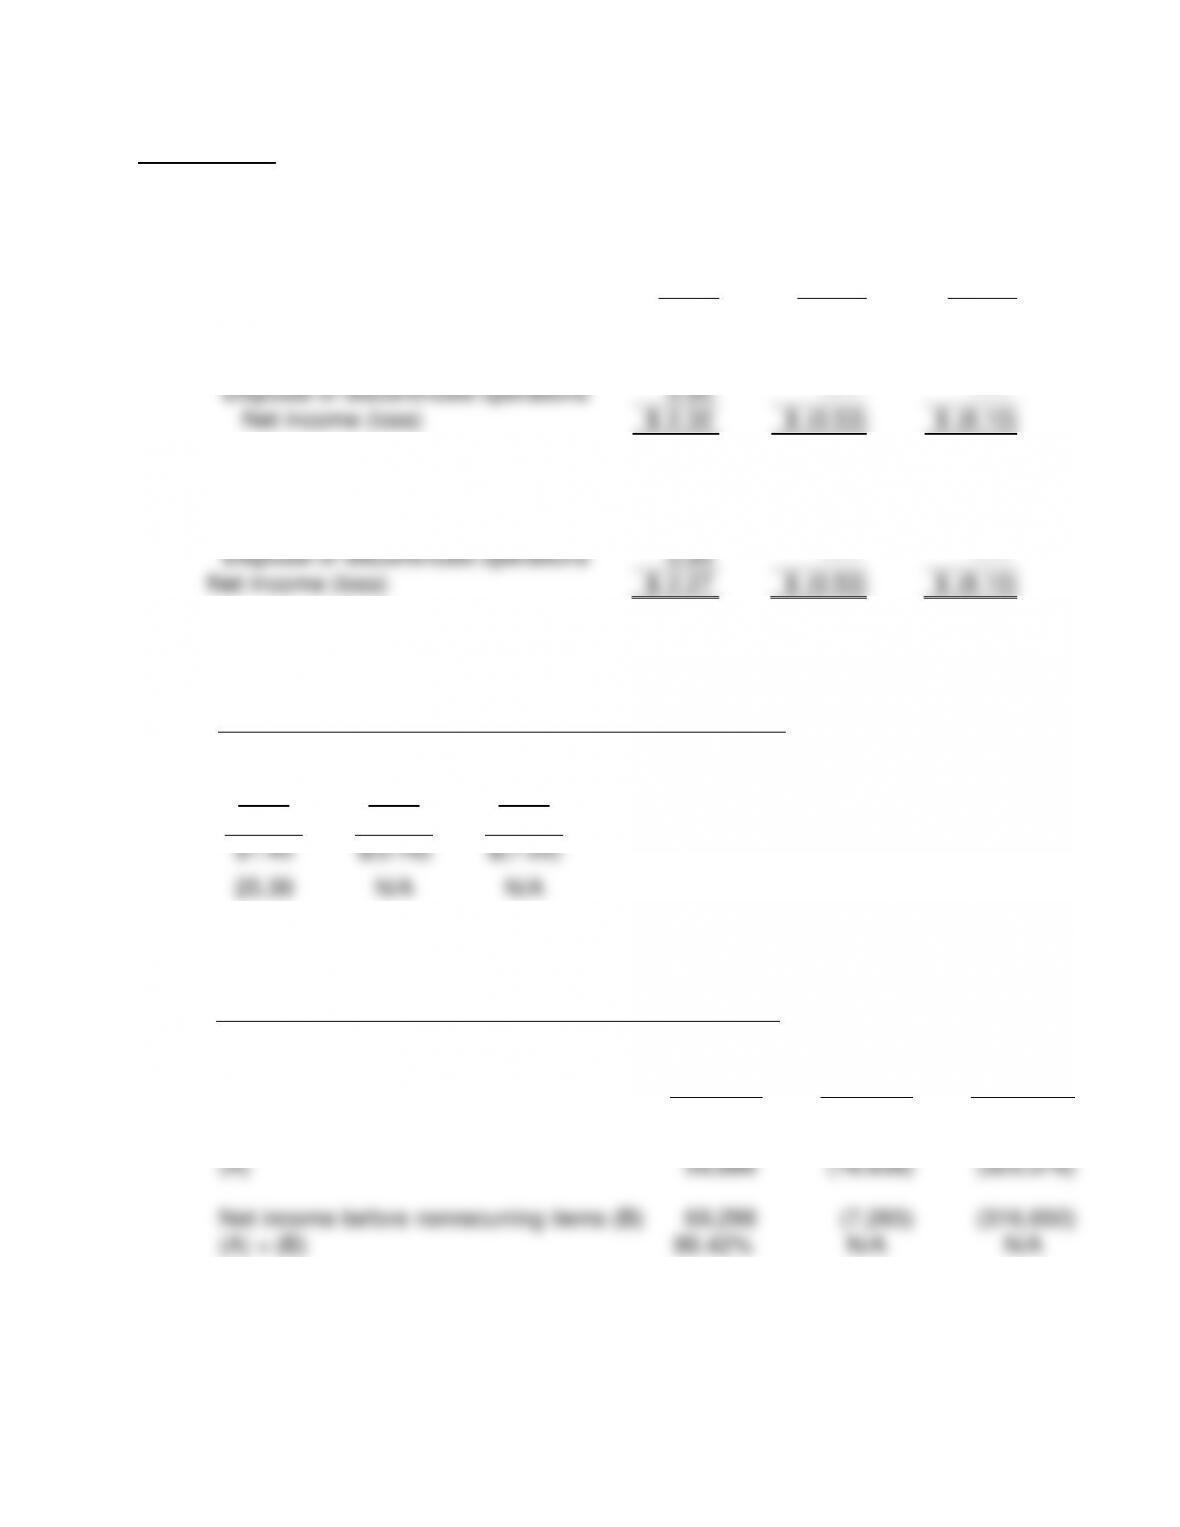
Basic income (loss) per share:
Continuing operations
$
1.48
$
(0.16)
$
(7.09)
Discontinued operations
(.11)
(.37)
(1.01)
Disposal of discontinued operations
0.95
—–
—–
Net income (loss)
$
2.32
$
(0.53)
$
(8.10)
Diluted income (loss) per share:
Continuing operations
$
1.45
$
(0.16)
$
(7.09)
Discontinued operations
(.11)
(.37)
(1.01)
Disposal of discontinued operations
0.93
—–
—–
Net income (loss)
$
2.27
$
(0.53)
$
(8.10)
b. Price / Earnings Ratio =
Market Price Per Share
Diluted Earnings Per Share, Before Nonrecurring Items
2010
2009
2008
$36.82
$21.87
$20.88
$1.45
$(0.16)
$(7.09)
25.39
N/A
N/A
c. Percentage of Earnings Retained =
Net Income Before Nonrecurring Items – All Dividends
Net Income Before Nonrecurring Items
2010
2009
2008
Income (loss) from continuing operations
69,298
(7,265)
(316,650)
Less dividends
(9,412)
(9,373)
(8,926)
(A)
59,886
(16,638)
(325,576)
Net income before nonrecurring items (B)
69,298
(7,265)
(316,650)
(A) ÷ (B)
86.42%
N/A
N/A

Chapter 09
d. Dividend Payout =
Dividends Per Common Share
Diluted Earnings Per Share Before Nonrecurring items
2010
2009
2008
$0.20
$0.20
$0.20
$1.45
$(0.16)
$(7.09)
13.79%
N/A
N/A
e. Dividend Yield =
Dividends per Common Share
Market price per Common Share
2010
2009
2008
(A)
$0.20
$0.20
$0.20
(B)
$36.82
$21.87
$20.88
(A) ÷ (B)
0.54%
0.91%
0.96%
2. Motorola Solutions
Inc. are the following:
Gains on sales of investments and businesses, net
3. Boeing Co.
Net Income – Preferred Dividends
Weighted Average Number of Common Shares Outstanding
2010
2009
2008
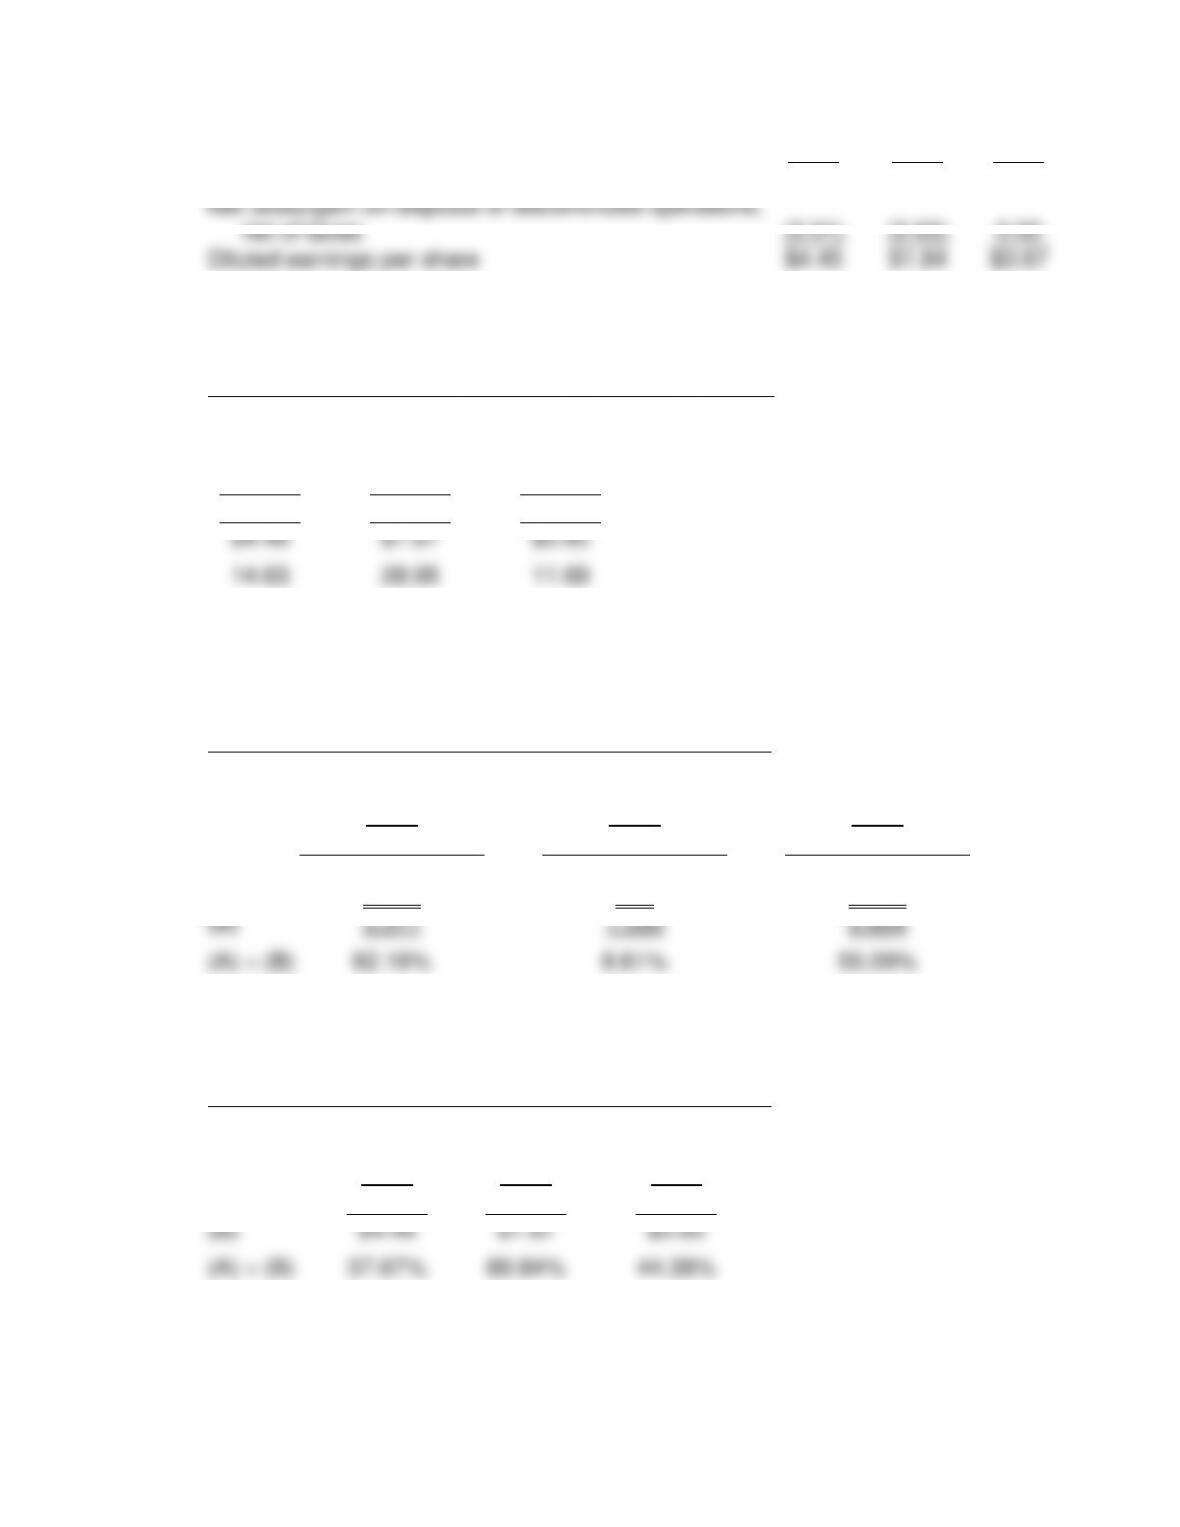
Basic earnings per share from continuing operations
$4.50
$1.89
$3.68
Net (loss)/gain on disposal of discontinued operations,
net of taxes
(0.01)
(0.03)
0.02
Basic earnings per share
$4.49
$1.86
$3.70
Chapter 09
2010
2009
2008
Diluted earnings per share from continuing operations
$4.46
$1.87
$3.65
Net (loss)/gain on disposal of discontinued operations,
net of taxes
(0.01)
(0.03)
0.02
Diluted earnings per share
$4.45
$1.84
$3.67
b. Price / Earnings Ratio =
Market Price Per Share
Diluted Earnings Per Share, Before Nonrecurring Items
2010
2009
2008
$65.26
$54.13
$42.67
$4.46
$1.87
$3.65
14.63
28.95
11.69
c. Percentage of earnings retained =
Net Income Before Nonrecurring Items – All Dividends
Net Income Before Nonrecurring Items
2010
2009
2008
$3,311 – ($1,253)
$1,335 – ($1,220)
$2,654 – ($1,192)
$3,311
$1,335
$2,654
(A)
2,058
115
1,462
(B)
3,311
1,335
2.654
(A) ÷ (B)
62.16%
8.61%
55.09%
d. Dividend Payout =
Dividends Per Common Share
Diluted Earnings Per Share Before Nonrecurring Items
2010
2009
2008
(A)
$1.68
$1.68
$1.62
(B)
$4.46
$1.87
$3.65
(A) ÷ (B)
37.67%
89.84%
44.38%
e. Dividend Yield =
Chapter 09
Dividends Per Common Share
Market Price Per Common Share
2010
2009
2008
(A)
$1.68
$1.68
$1.62
(B)
$65.26
$54.13
$42.67
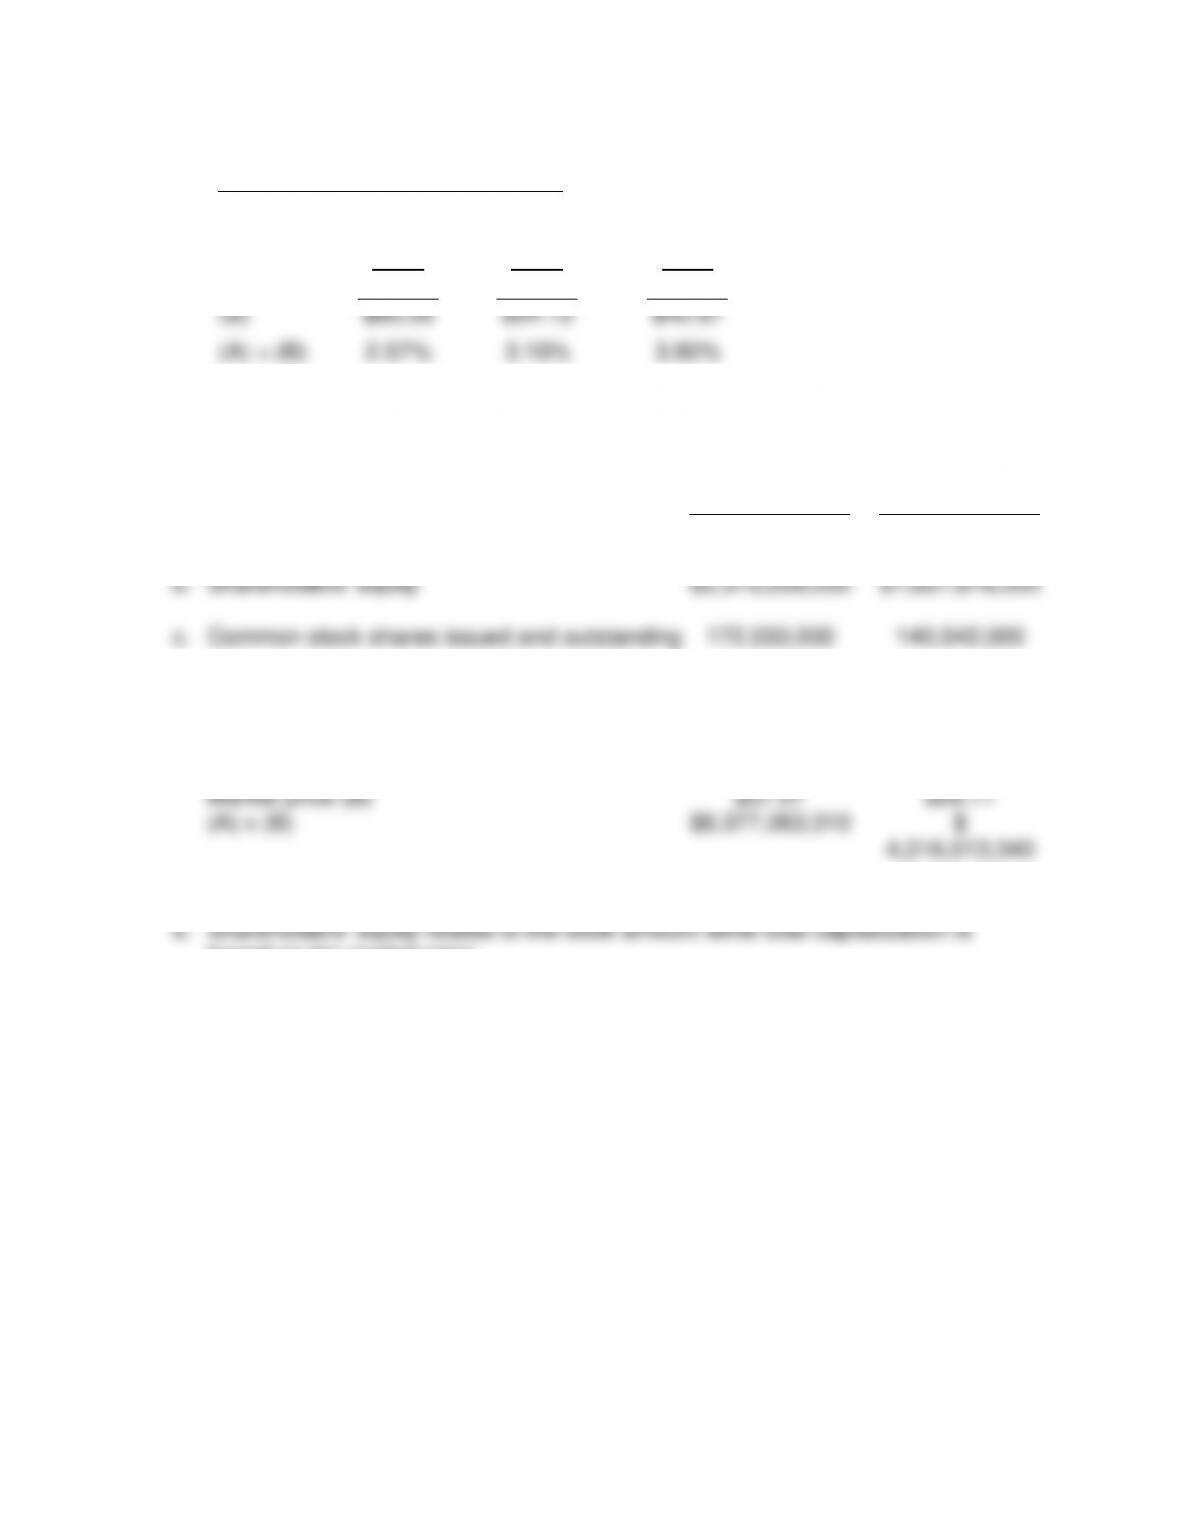
(A) ÷ (B)
2.57%
3.10%
3.80%
4. Whole Foods Market
September 26,
2010
September 27,
2009
a. Total assets
$3,986,540,000
$3,783,388,000
b. Shareholders’ equity
$2,373,258,000
$1,627,876,000
c. Common stock shares issued and outstanding
172,033,000
140,542,000
d. Total capitalization at September 26, 2010 and
September 27, 2009
Common stock shares issued and outstanding
(A)
172,033,000
146,542,000
Market price (B)
$37.07
$28.77
(A) x (B)
$6,377,263,310
$
4,216,013,340
based on the market price.