Chapter 08
222
TO THE NET
1. a. Item 1 business
Google is a global technology leader focused on improving the ways people
connect with information.
b.
2008
2009
2010
Revenue
100.0
108.5
134.5
Income from operations
100.0
125.3
156.5
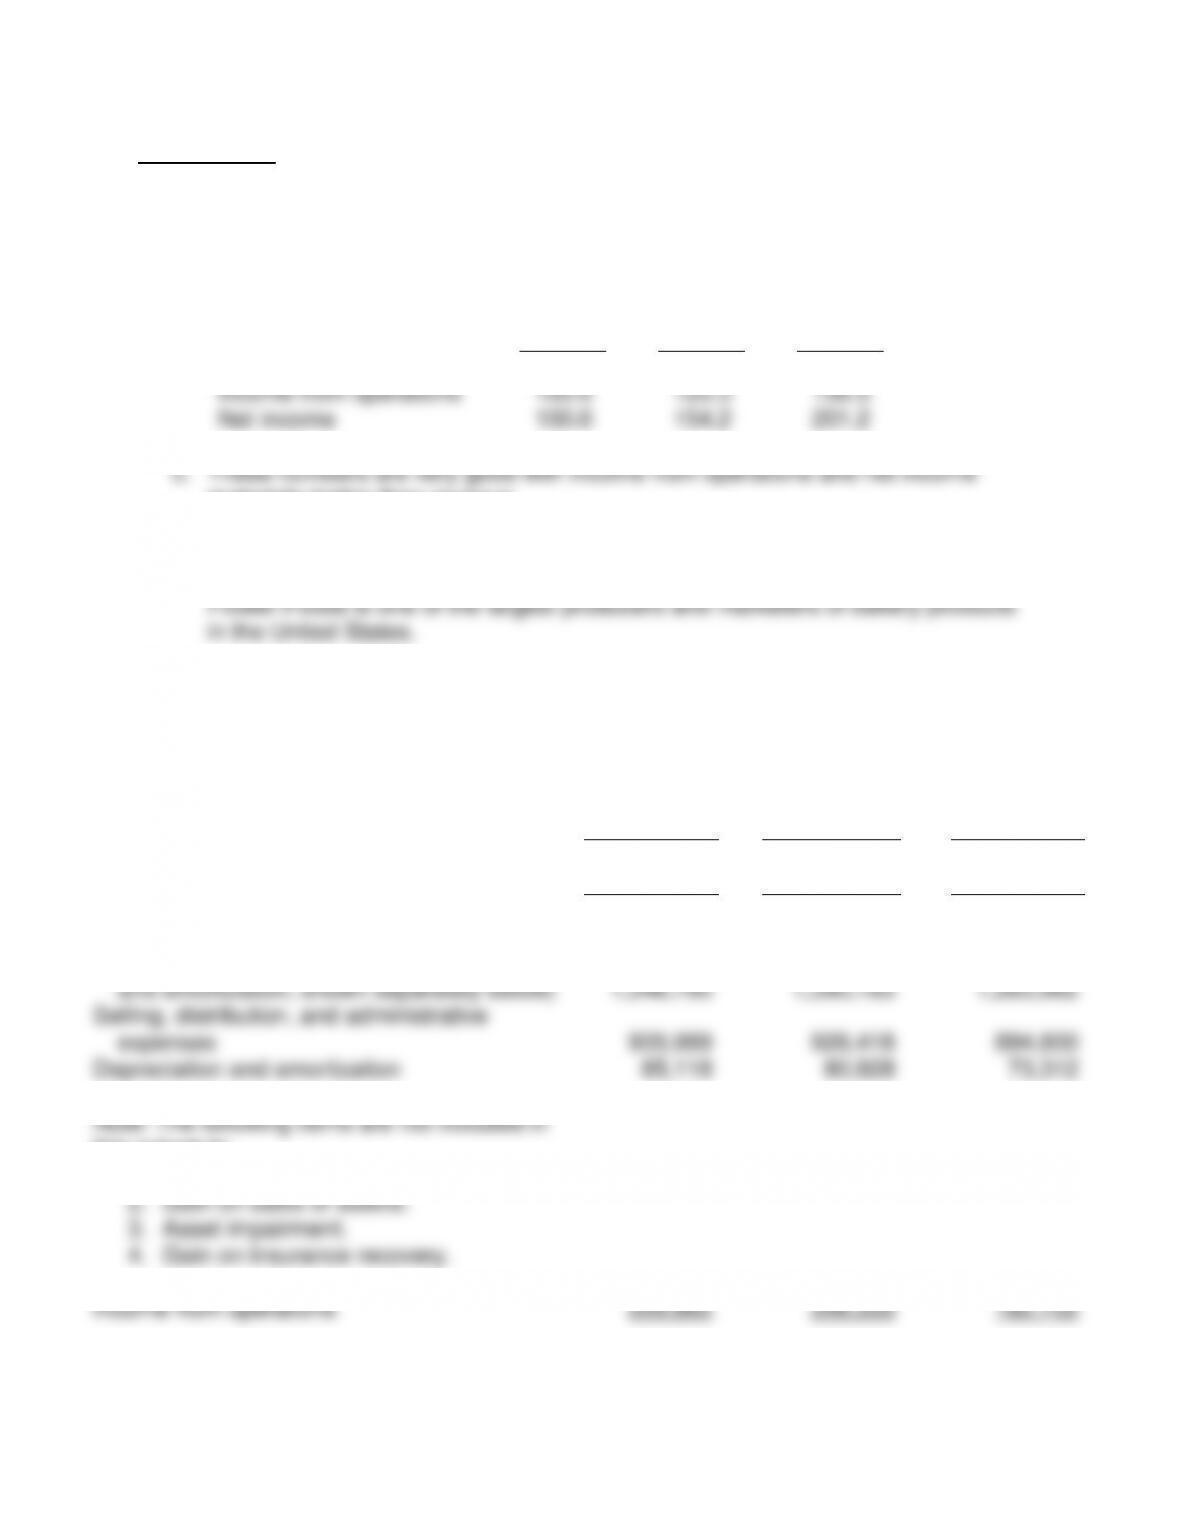
Net income
100.0
154.2
201.2
materially better than revenue.
2. a. Item 1 Business
The Company
b. Flower Foods, Inc. and Subsidiaries
Consolidated Statements of Income (in part)
52 Weeks
52 Weeks
53 Weeks
(Amounts in thousands)
January 1,
2011
January 2,
2010
January 3,
2009
Sales
$
2,573,769
$
2,600,849
$
2,414,892
Materials, supplies, labor and other
production costs (exclusive of depreciation
and amortization, shown separately below)
1,346,790
1,390,183
1,263,962
Selling, distribution, and administrative
expenses
935,999
926,418
894,800
Depreciation and amortization
85,118
80,928
73,312
Note: The following items are not included in
this schedule.
1. Gain on acquisition.
2. Gain on sales of assets.
3. Asset impairment.
4. Gain on insurance recovery.
Income from operations
205,862
206,333
182,702
Chapter 08
223
c. Flower Foods, Inc. and Subsidiaries
Consolidated Statements of Income (in part)
Horizontal Common-Size Analysis
52 Weeks
Ended
52 Weeks
Ended
53 Weeks
Ended
January 1,
2011
January 2,
2010
January 3,
2009
Sales
106.6
107.7
100.0
Materials, supplies, labor and
other production costs
(exclusive of depreciation
and amortization, shown
separately below)
106.6
110.0
100.0
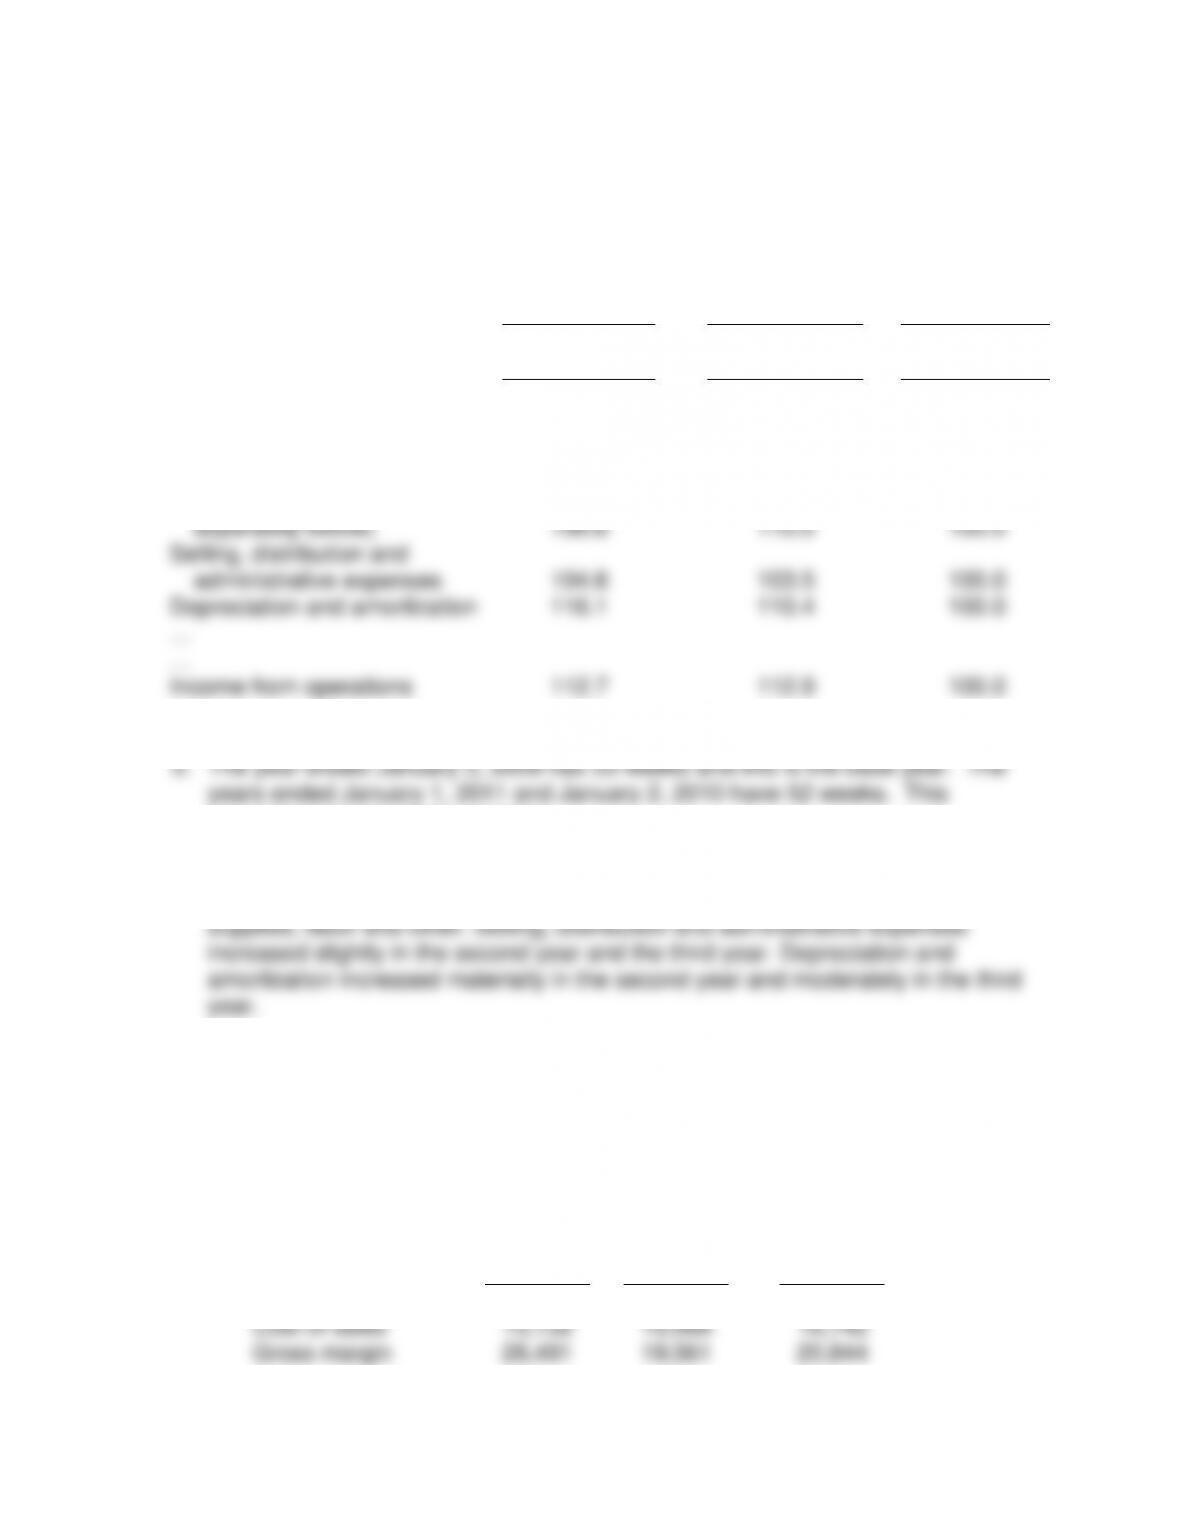
Selling, distribution and
administrative expenses
104.6
103.5
100.0
Depreciation and amortization
116.1
110.4
100.0
…
…
Income from operations
112.7
112.9
100.0
presents a comparability problem.
e. Income from operations increased materially in the second year and then
decreased slightly in the third year. This was also the case with materials,
3. a. Item 1 Business
We are the world’s largest semiconductor chip maker, based on revenue.
b. Intel Corporation
Three Years Ended December 25, 2010
(In Millions)
2010
2009
2008
Net revenue
$43,623
$35,127
$37,586
Cost of sales
15,132
15,566
16,742
Gross margin
28,491
19,561
20,844
Chapter 08
224
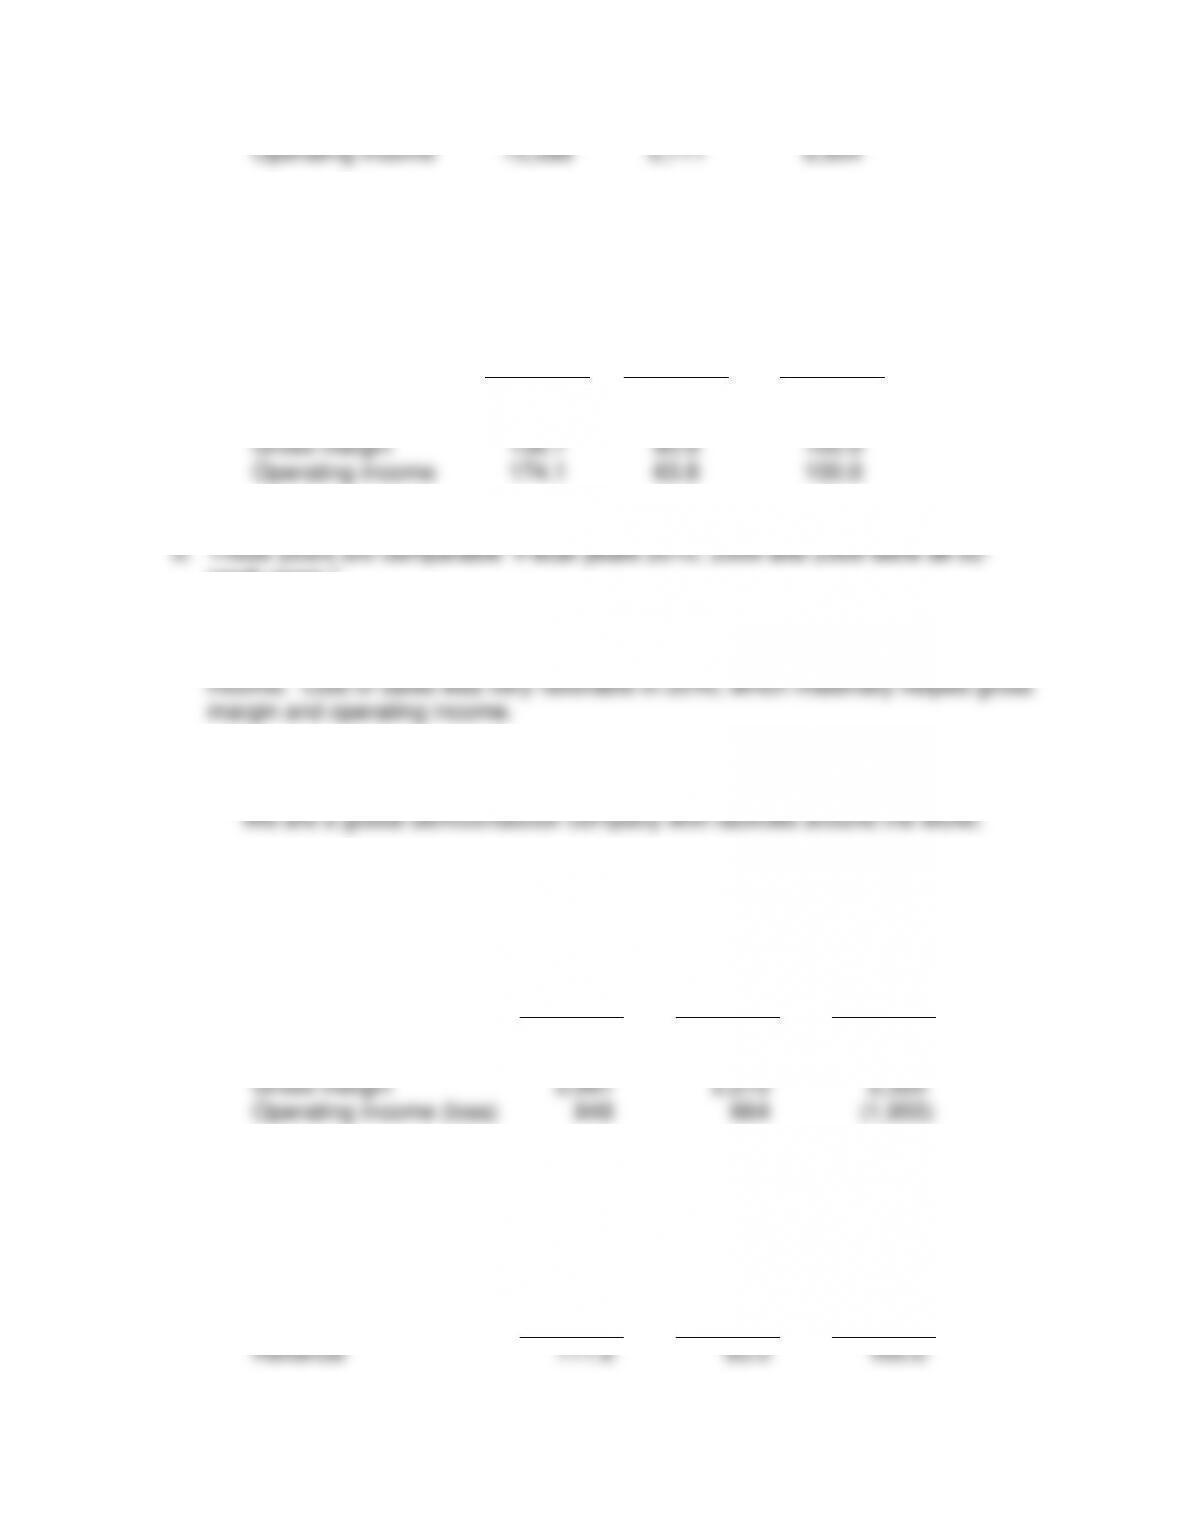
Operating income
15,588
5,711
8,954
c. Intel Corporation
Common-Size
Three Years Ended December 25, 2010
(In Millions)
2010
2009
2008
Net revenue
116.1
93.5
100.0
Cost of sales
90.4
93.0
100.0
Gross margin
136.7
93.8
100.0
Operating income
174.1
63.8
100.0
week years.”
e. 2009 was a material down year, especially in terms of operating income. A
material improvement in 2010 for net revenue, gross margin, and operating
4. a. 1. Item 1 Business
General
b. Advanced Micro Devices, Inc.
Consolidated Statement of Operations (in part)
Three Years Ended December 25, 2010
(In millions)
2010
2009
2008
Revenue
$6,494
$5,403
$5,808
Cost of sales
3,533
3,131
3,488
Gross margin
2,961
2,272
2,320
Operating income (loss)
848
664
(1,955)
c. Advanced Micro Devices, Inc.
Common-Size
Consolidated Statement of Operations (in part)
Three Years Ended December 25, 2010
(In millions)
2010
2009
2008
Revenue
111.8
93.0
100.0
Chapter 08
225
Cost of sales
101.3
89.7
100.0
Gross margin
127.6
97.9
100.0
Operating income (loss)
Negative
A material increase in revenue in 2010, while cost of sales was held in check.
This resulted in a material increase in gross margin.
Impressive increase in operating income for Intel. Operating income also
increased impressively for Advanced Micro Devices, Inc.