Chapter 05
1
To The Net
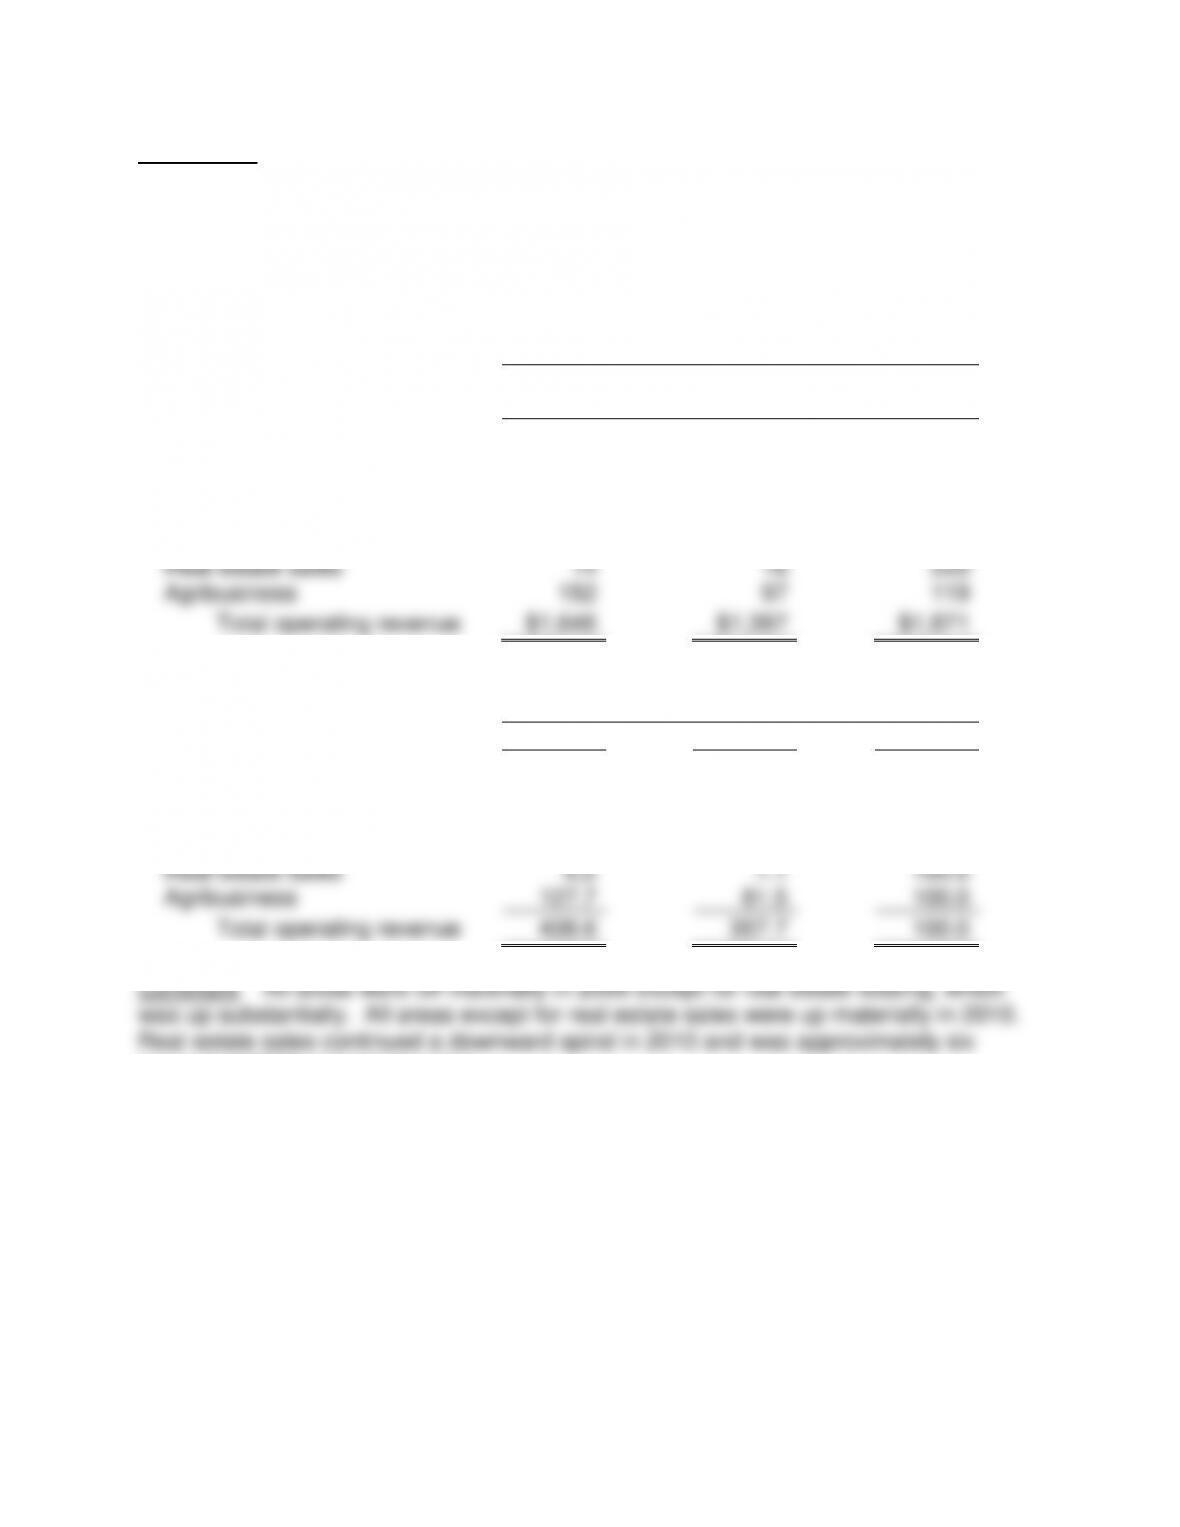
1. ALEXANDER & BALDWIN, INC.
CONSOLIDATED STATEMENTS OF INCOME
(In millions, except per-share amounts)
Years Ended December 31
In Millions
2010
2009
2008
(In millions)
Operating revenue:
Ocean transportation
$1,040
$887
$1,021
Logistics services
355
321
436
Real estate leasing
85
76
70
Real estate sales
14
16
225
Agribusiness
152
97
119
Total operating revenue
$1,646
$1,397
$1,871
Horizontal Common-Size
Years Ended December 31
2010
2009
2008
Operating revenue:
Ocean transportation
101.9
86.9
100.0
Logistics services
81.4
73.6
100.0
Real estate leasing
121.4
108.6
100.0
Real estate sales
6.2
7.1
100.0
Agribusiness
127.7
81.5
100.0
Total operating revenue
438.6
357.7
100.0
percent of 2008 real estate sales.
Chapter 05
2
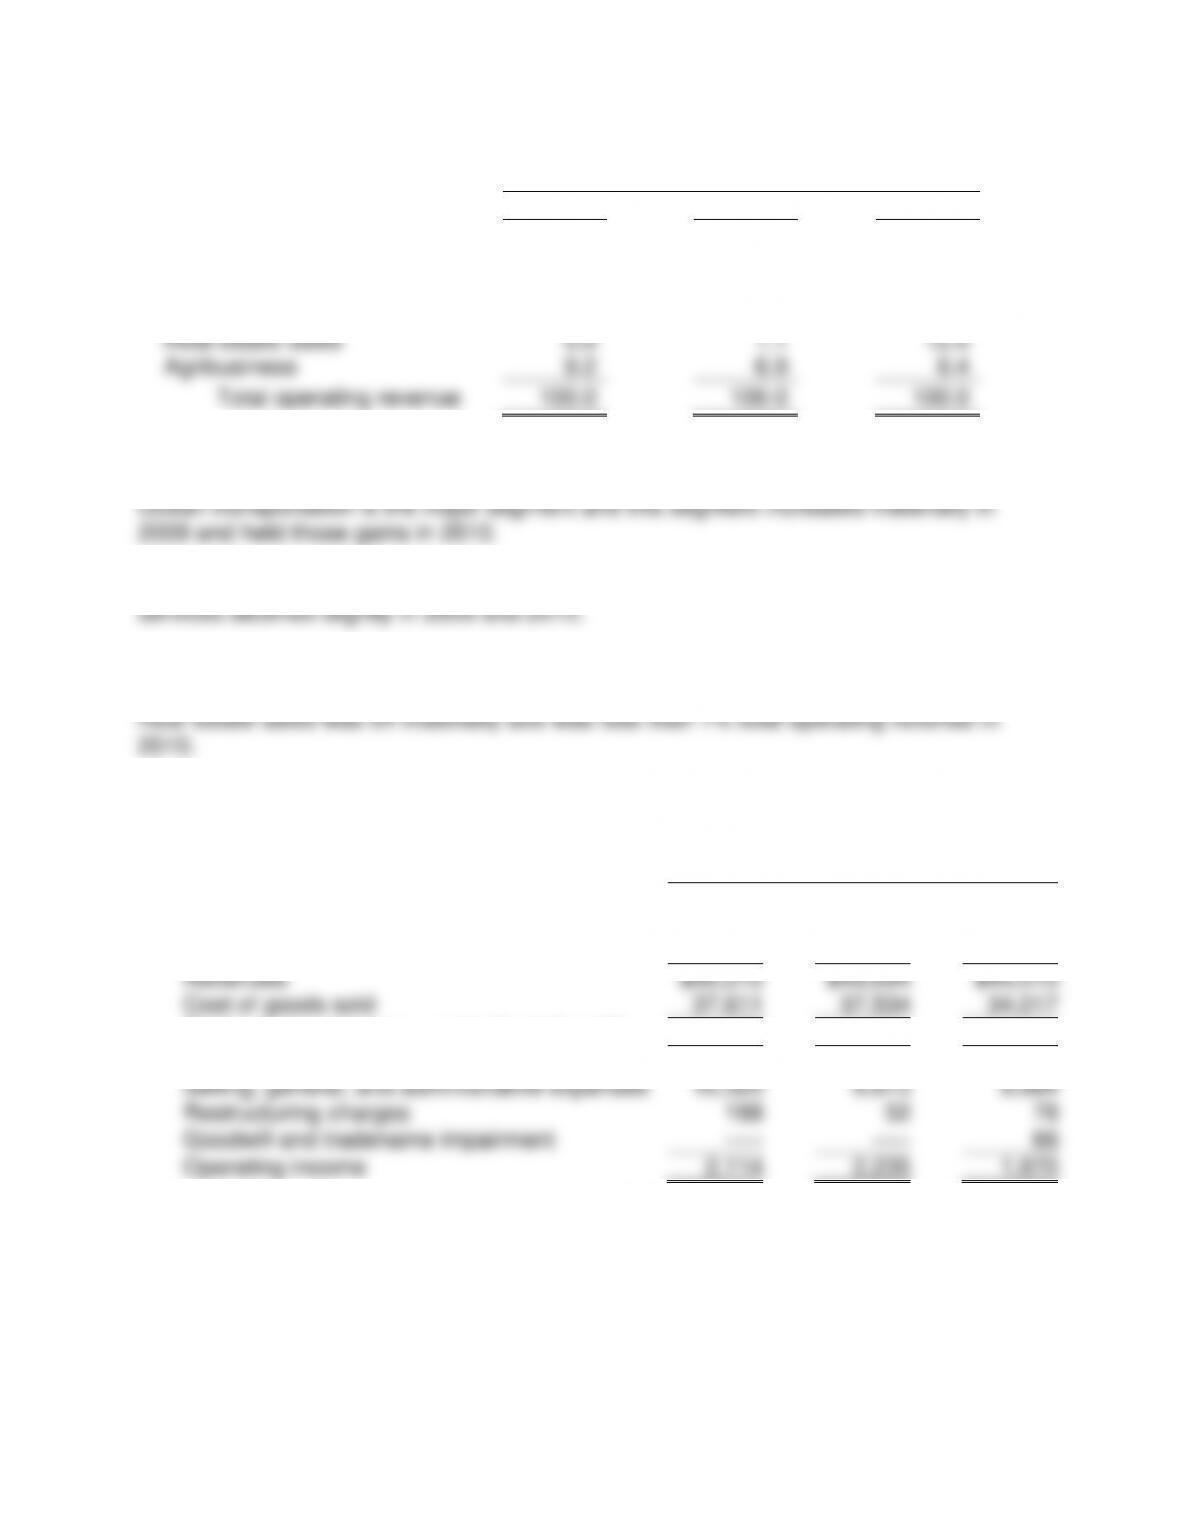
Vertical Common-Size*
Years Ended December 31
2010
2009
2008
Operating revenue:
Ocean transportation
63.2
63.5
54.6
Logistics services
21.6
23.0
23.3
Real estate leasing
5.2
5.4
3.7
Real estate sales
0.9
1.1
12.0
Agribusiness
9.2
6.9
6.4
Total operating revenue
100.0
100.0
100.0
*Some rounding differences
Logistics services was the second largest segment by a material amount. Logistics
Real estate leasing and agribusiness both increased materially.
2.
Consolidated Statements of Earnings
(In Millions)
Feb. 26,
2011
Feb. 27,
2010
Feb. 28,
2009
Revenues
$50,272
$49,694
$45,015
Cost of goods sold
37,611
37,534
34,017
Restructuring charges – cost of goods sold
24
—–
—–
Gross Profit
12,637
12,160
10,998
Selling, general, and administrative expenses
10,325
9,873
8,984
Restructuring charges
198
52
78
Goodwill and tradename impairment
—–
—–
66
Operating income
2,114
2,235
1,870
Chapter 05
3
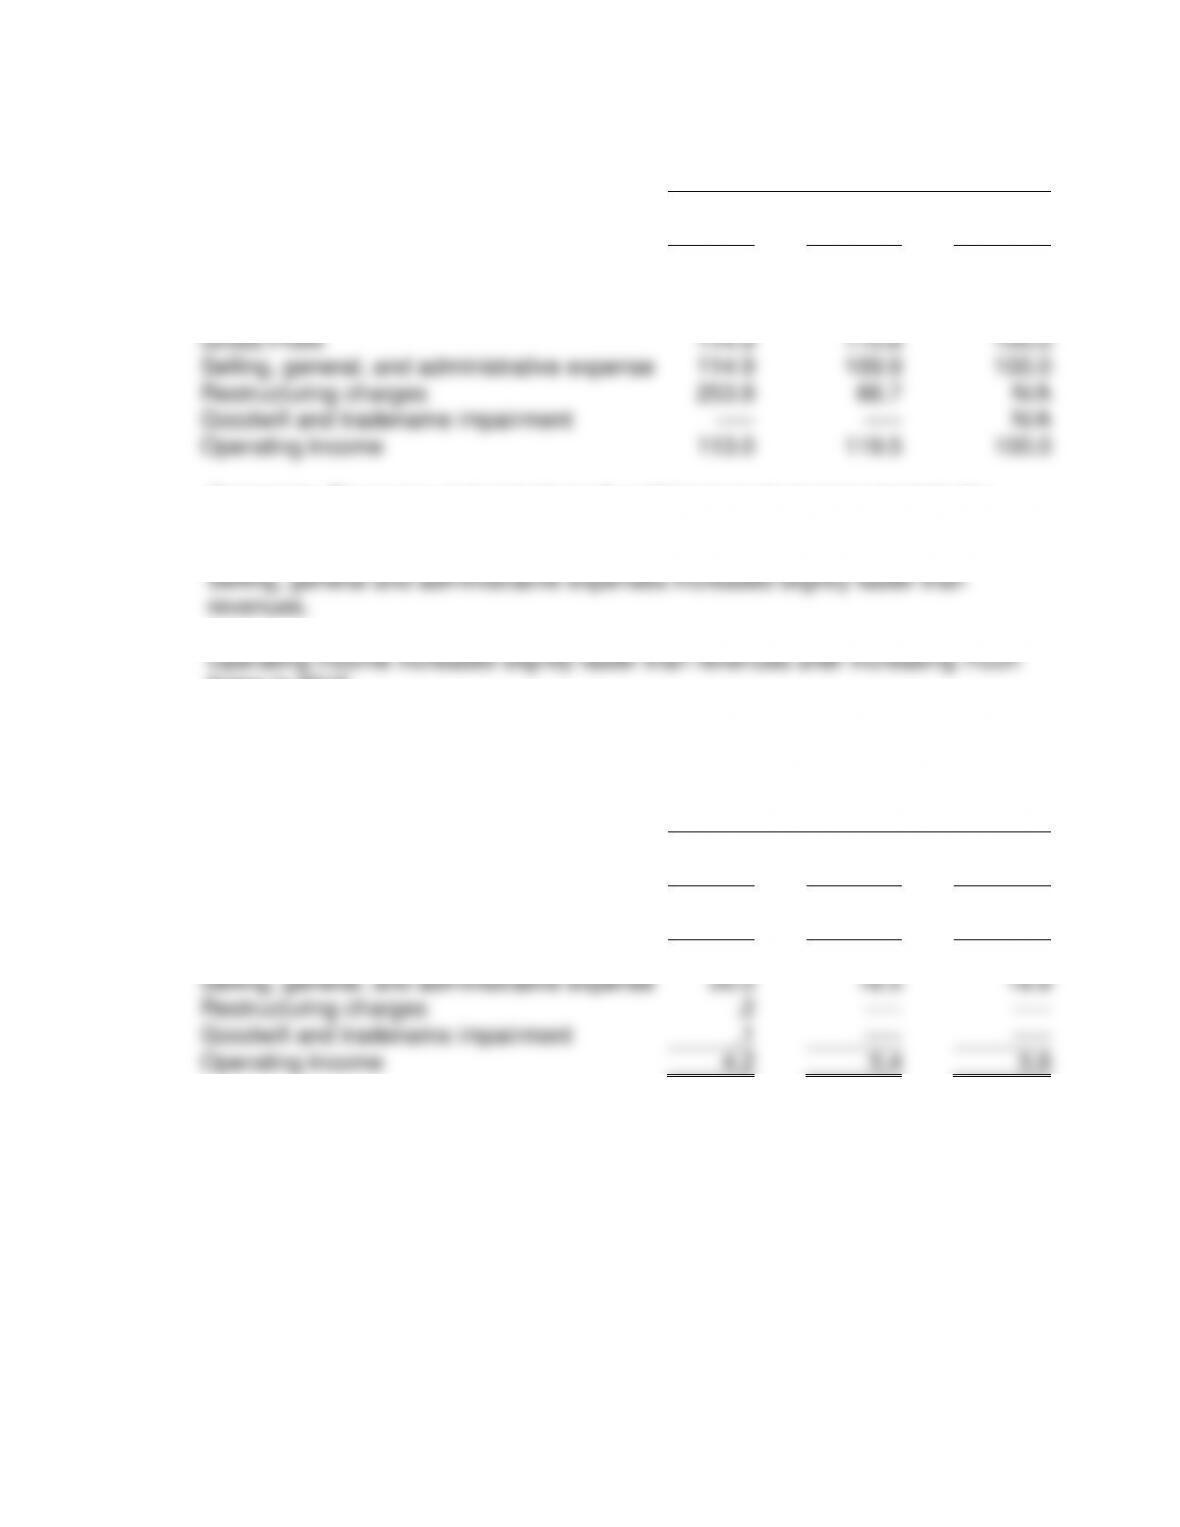
Horizontal Common-Size
Consolidated Statements of Earnings
Feb. 26,
2011
Feb. 27,
2010
Feb. 28,
2009
Revenues
111.7
110.4
100.0
Cost of goods sold
110.6
110.3
100.0
Restructuring charges – cost of goods sold
N/A
N/A
N/A
Gross Profit
114.9
110.6
100.0
Selling, general, and administrative expense
114.9
109.9
100.0
Restructuring charges
253.8
66.7
N/A
Goodwill and tradename impairment
—–
—–
N/A
Operating income
113.0
119.5
100.0
same rate.
faster in 2010.
Vertical Common-Size
Consolidated Statements of Earnings
Feb. 28,
2009
March 1,
2008
March 3,
2007
Revenue
100.0
100.0
100.0
Cost of goods sold
75.6
76.1
75.6
Gross Profit
24.4
23.9
24.4
Selling, general, and administrative expense
20.0
18.5
18.8
Restructuring charges
.2
—–
—–
Goodwill and tradename impairment
.1
—–
—–
Operating income
4.2
5.4
5.6
Comment: No major changes.
Chapter 05
4
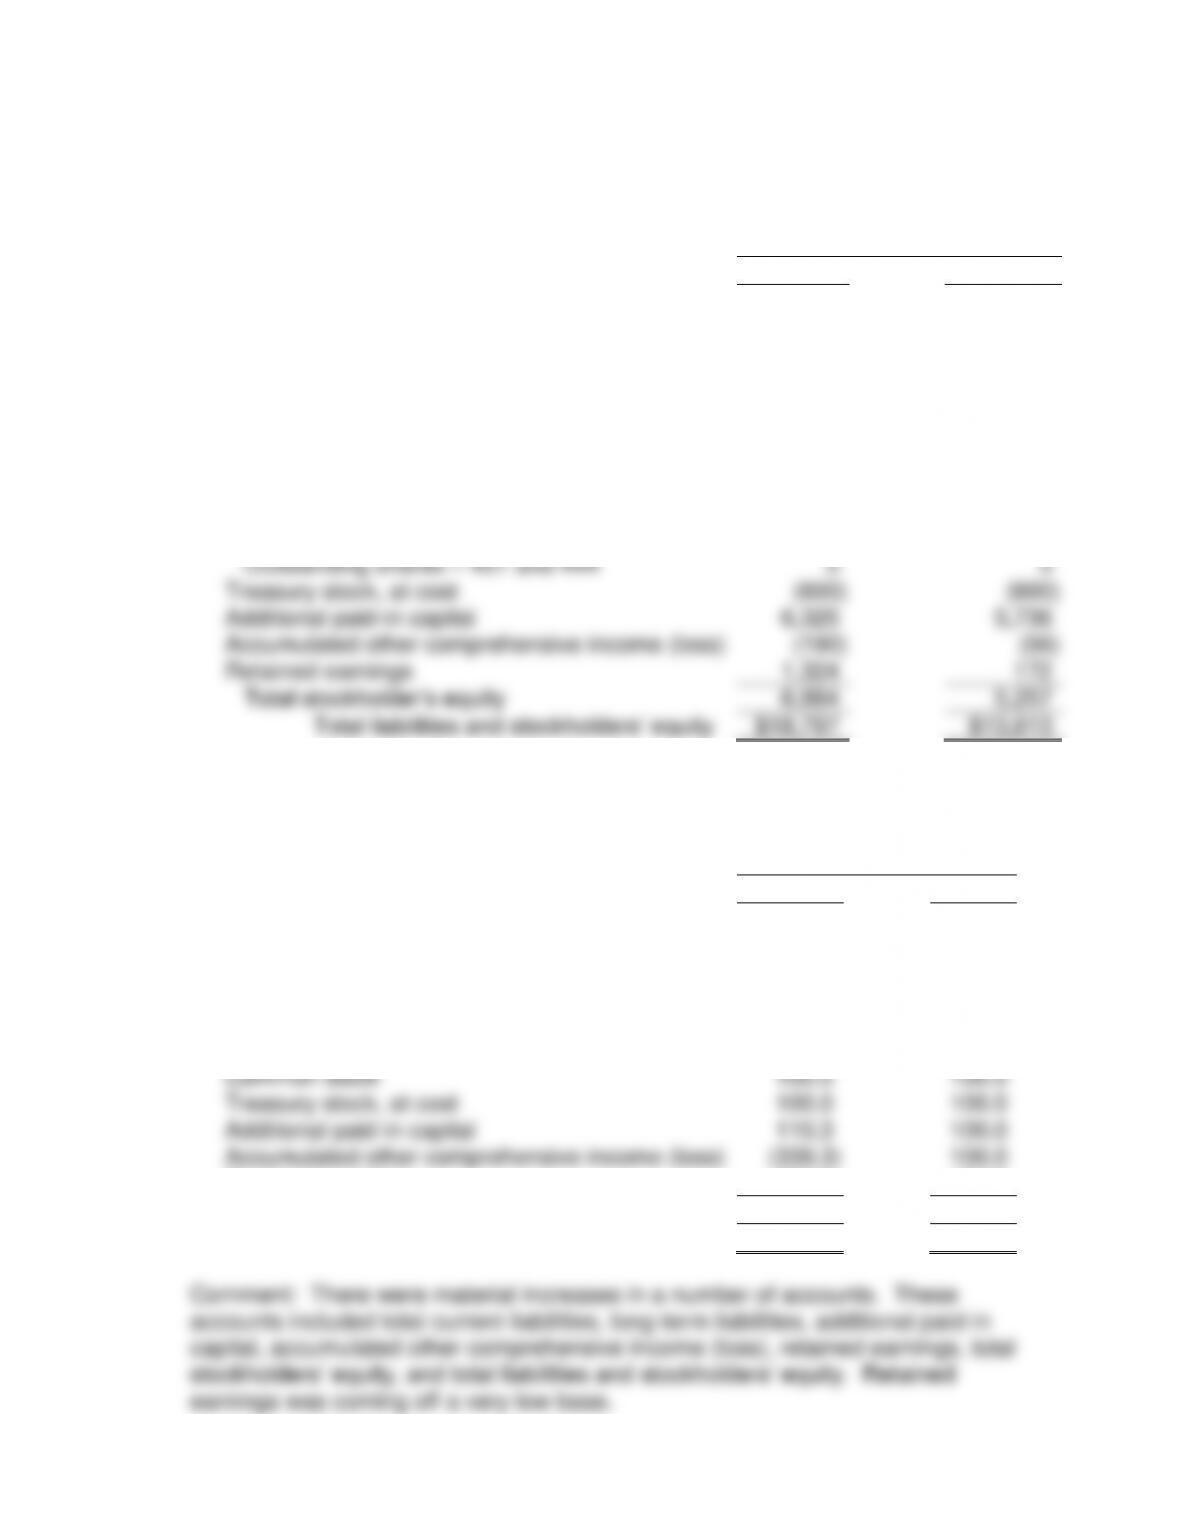
3. Amazon.com, Inc.
Consolidated Balance Sheets (In Part)
(In millions, except per share data)
December 31,
2010
2009
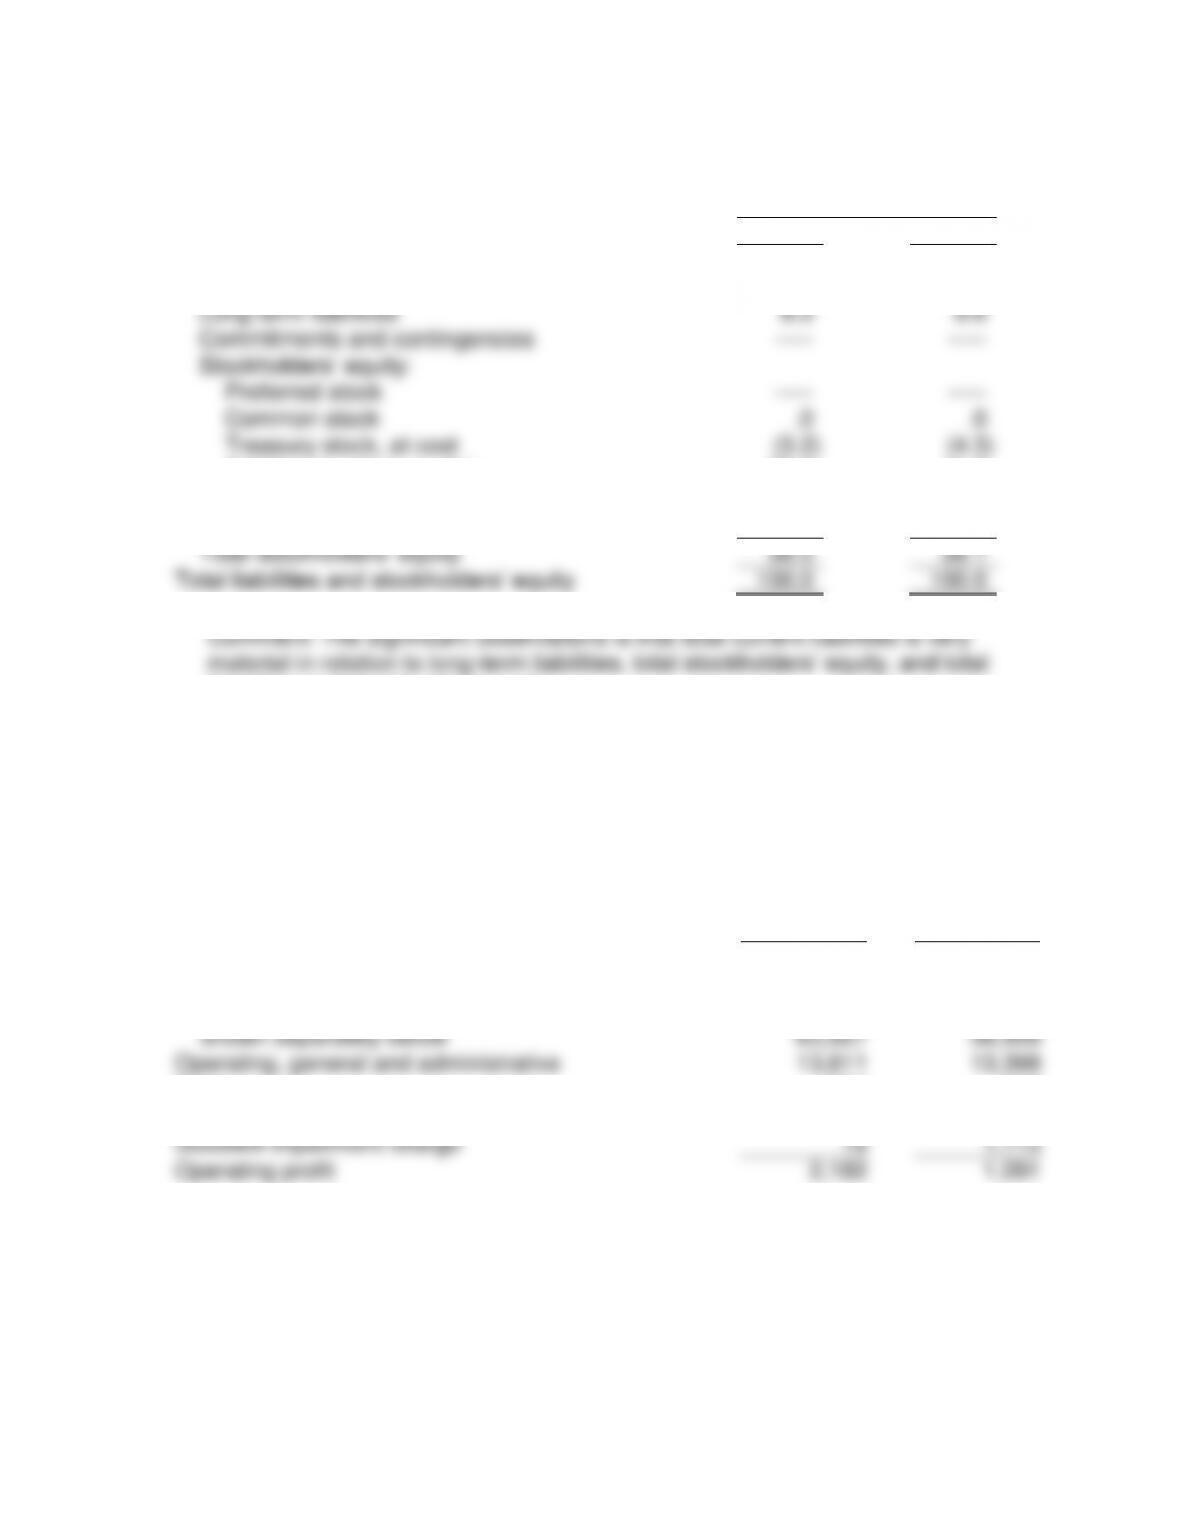
Liabilities and stockholders’ equity
Total current liabilities
$10,372
$7,364
Commitments and contingencies
—–
—–
Stockholders’ equity:
Preferred stock, $0.01 par value:
Authorized shares – 500
Issued and outstanding shares – none
—–
—–
Common stock, $0.01 par value:
Authorized shares – 5,000
Issued shares – 468 and 461
Outstanding shares – 451 and 444
5
5
Treasury stock, at cost
(600)
(600)
Additional paid-in capital
6,325
5,736
Accumulated other comprehensive income (loss)
(190)
(56)
Retained earnings
1,324
172
Total stockholder’s equity
6,864
5,257
Total liabilities and stockholders’ equity
$18,797
$13,813
Horizontal Common-Size
Consolidated Balance Sheets (In Part)
December 31,
2010
2009
Liabilities and stockholders’ equity:
Total current liabilities
140.8
100.0
Long-term liabilities
131.0
100.0
Commitments and contingencies
—–
—–
Stockholders’ equity:
Preferred stock
—–
—–
Common stock
100.0
100.0
Treasury stock, at cost
100.0
100.0
Additional paid-in capital
110.3
100.0
Accumulated other comprehensive income (loss)
(339.3)
100.0
Retained earnings
769.8
100.0
Total stockholders’ equity
130.6
100.0
Total liabilities and stockholders’ equity
136.1
100.0
Chapter 05
5
Vertical Common-Size
Consolidated Balance Sheets (In Part)
December 31,
2010
2009
Liabilities and stockholders’ equity:
Total current liabilities
55.2
53.3
Long-term liabilities
8.3
8.6
Commitments and contingencies
—–
—–
Stockholders’ equity:
Preferred stock
—–
—–
Common stock
.0
.0
Treasury stock, at cost
(3.2)
(4.3)
Additional paid-in capital
33.6
41.5
Accumulated other comprehensive income (loss)
(1.0)
(0.4)
Retained earnings
7.0
1.2
Total stockholders’ equity
36.5
38.1
Total liabilities and stockholders’ equity
100.0
100.0
liabilities and stockholders’ equity.
4. The Kroger Co.
Consolidated Statement of Operations (In Part)
Years Ended January 29, 2011 and January 30, 2010
2010
2009
(52 Weeks)
(52 Weeks)
Sales
82,189
76,733
Merchandise costs, including advertising,
warehousing, and transportation, excluding items
shown separately below
63,927
58,958
Operating, general and administrative
13,811
13,398
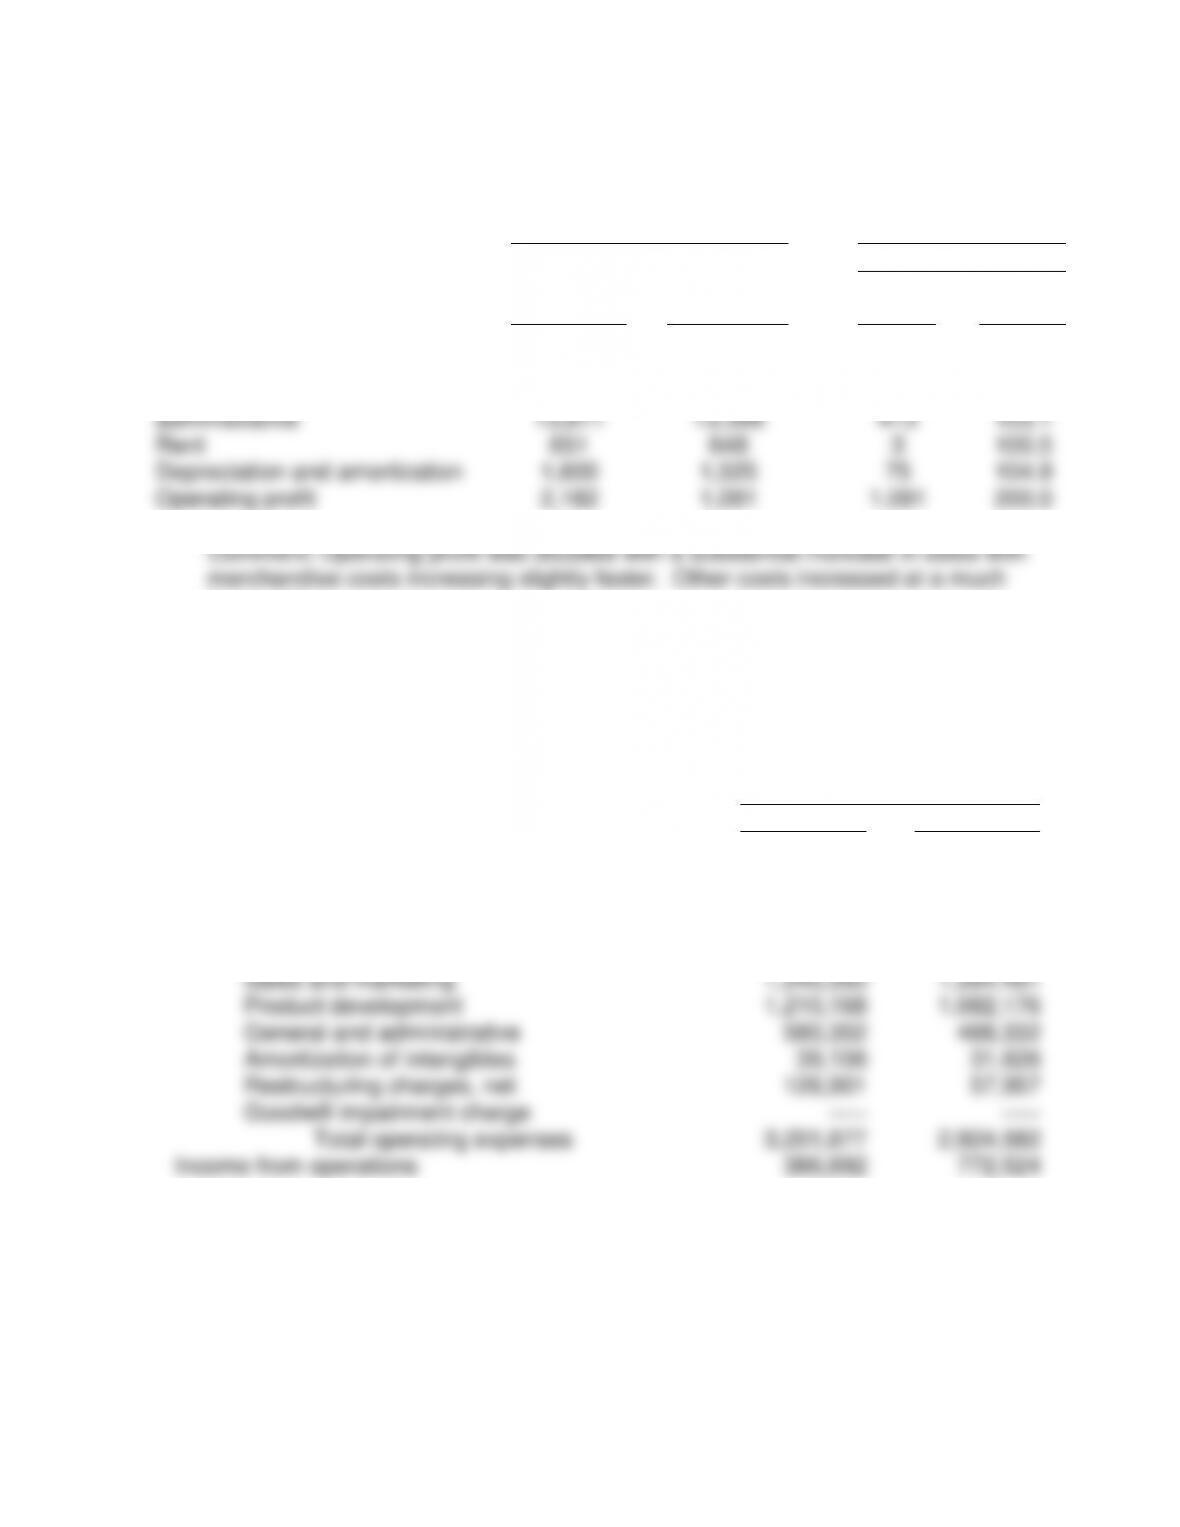
Rent
651
648
Depreciation and amortization
1,600
1,525
Goodwill impairment charge
18
1,113
Operating profit
2,182
1,091
Chapter 05
6
The Kroger Co.
Consolidated Statements of Operations (In Part)
In Millions
Increase
(Decrease)
Jan. 29,
2011
(52 weeks)
Jan. 30,
2010
(52 weeks)
Dollars
Percent
Sales
$82,189
$76,733
$5,456
107.1
Merchandise costs, etc.
63,927
58,958
4,969
108.4
Operating, general and
administrative
13,811
13,398
413
103.1
Rent
651
648
3
100.5
Depreciation and amortization
1,600
1,525
75
104.9
Operating profit
2,182
1,091
1,091
200.0
lower rate.
5. Yahoo! Inc.
Consolidated Statement of Income (In Part)
Years Ended December 31,
2009
2010
(In thousands)
Revenue
$6,460,315
$6,324,651
Cost of revenue
2,871,746
2,627,545
Gross profit
3,588,569
3,697,106
Operating expenses:
Sales and marketing
1,245,350
1,264,491
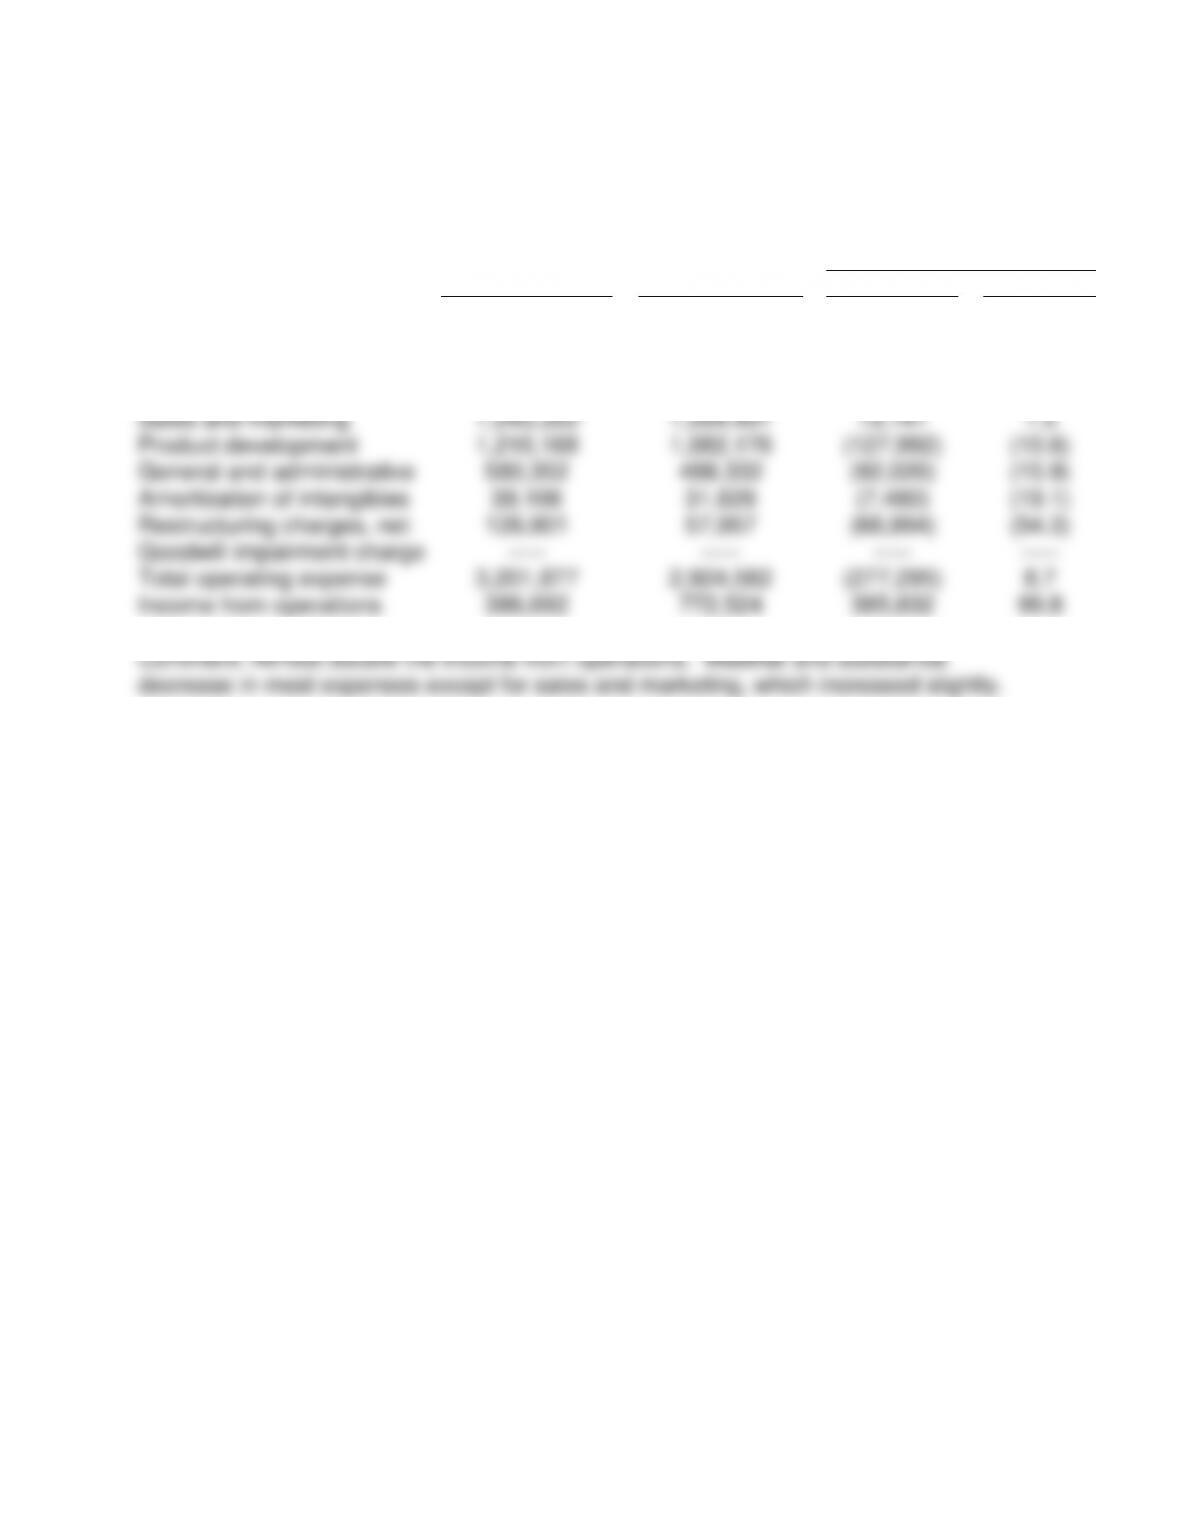
Product development
1,210,168
1,082,176
General and administrative
580,352
488,332
Amortization of intangibles
39,106
31,626
Restructuring charges, net
126,901
57,957
Goodwill impairment charge
—–
—–
Total operating expenses
3,201,877
2,924,582
Income from operations
386,692
772,524
Chapter 05
7
Yahoo! Inc.
Consolidated Statements of Income
Years Ended December 31, 2009 and December 31, 2010
(In thousands)
Dec. 31,
2009
Dec. 31,
2010
Increase (Decrease)
Dollars
Percent
Revenues
$6,460,315
$6,324,651
($135,664)
(2.1)
Cost of revenues
2,871,746
2,627,545
(244,201)
(8.5)
Gross profit
3,588,569
3,697,106
108,537
3.0
Operating expenses:
Sales and marketing
1,245,350
1,264,491
19,141
1.5
Product development
1,210,168
1,082,176
(127,992)
(10.6)
General and administrative
580,352
488,332
(92,020)
(15.9)
Amortization of intangibles
39,106
31,626
(7,480)
(19.1)
Restructuring charges, net
126,901
57,957
(68,994)
(54.3)
Goodwill impairment charge
—–
—–
—–
—–
Total operating expense
3,201,877
2,924,582
(277,295)
8.7
Income from operations
386,692
772,524
385,832
99.8