Chapter 17: Fundamental Review of the Trading Book
17.7 (Spreadsheet provided)
Suppose that an investor owns the $10 million portfolio in Table 13.1 on September 30, 2014.
The values of the four indices on that day were 17,042.90, 6622.7, 4,416.24, 16,173.52. The
exchange rates on that day were:1.6211 USD per GBP, 0.7917 EUR per USD, and 109.64 JPY
per USD. Suppose that the 250 days ending September 9, 2008 constitutes the stressed period for
the portfolio. The liquidity horizon for each index is 10 days. Calculate the 97.5% expected
shortfall using the overlapping periods method in conjunction with historical simulation..
The spreadsheet shows how losses over 10-day periods in the past can be used to provide
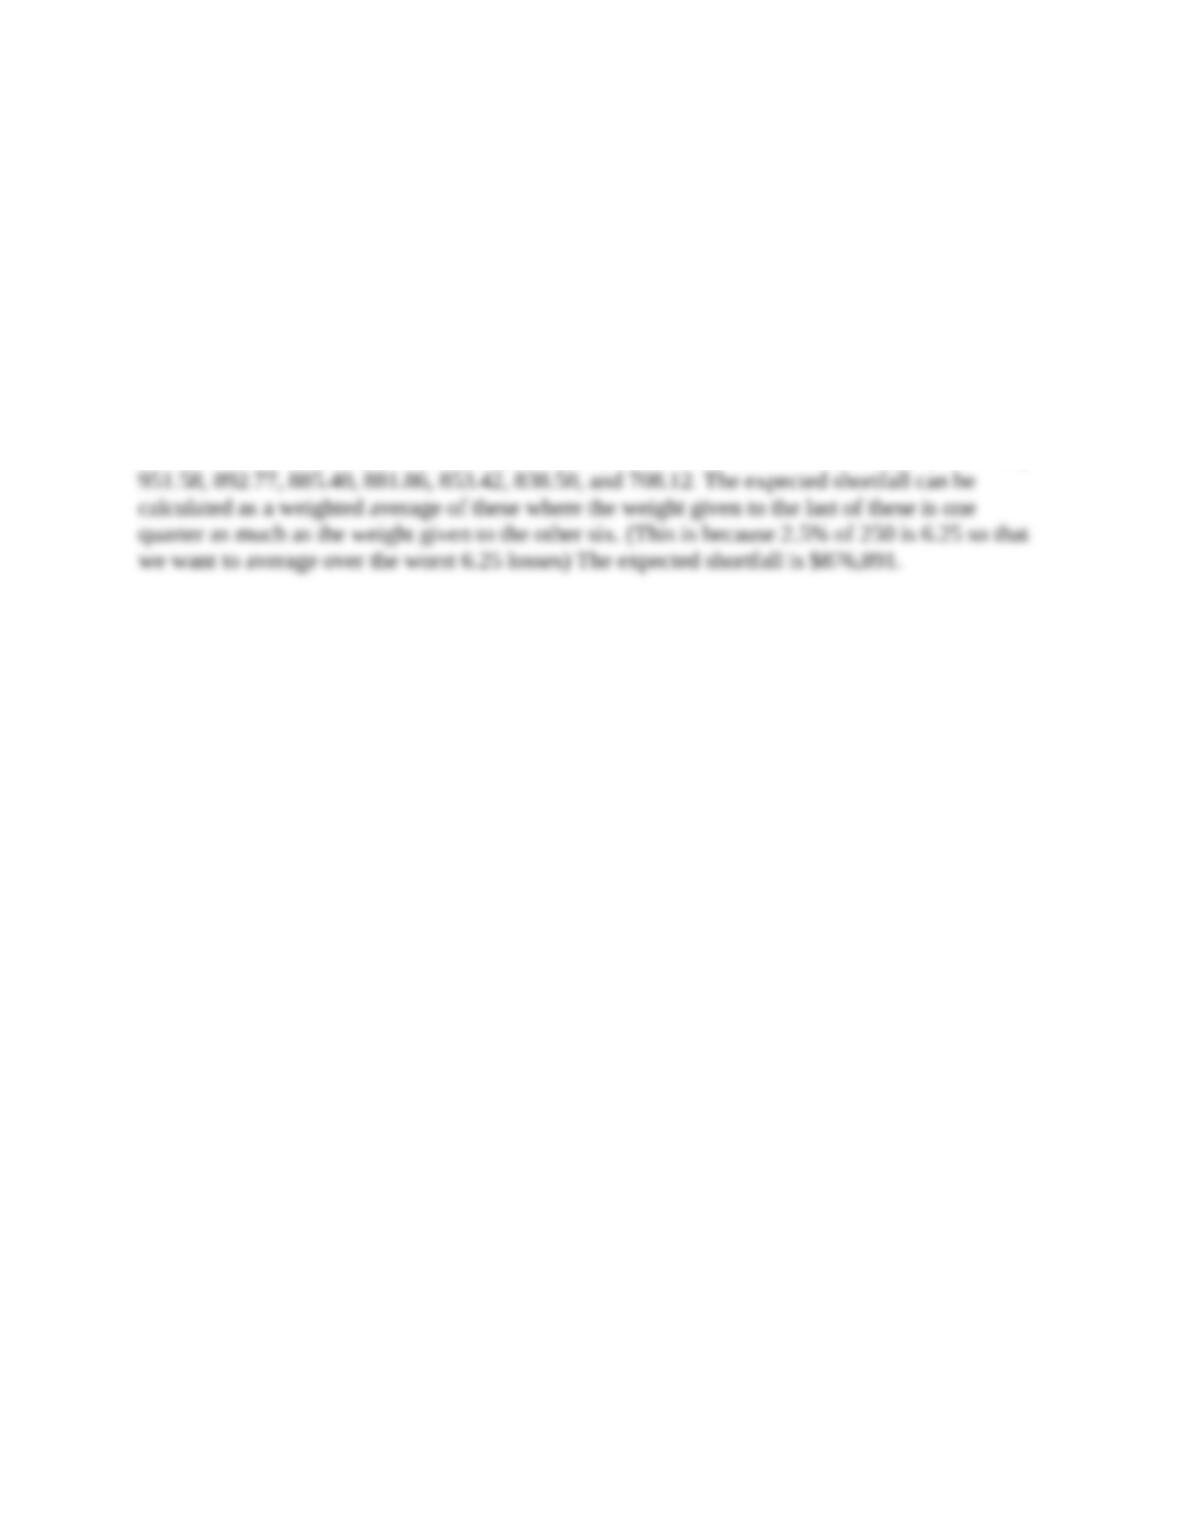
simulated losses for the portfolio on September 30, 2014. The seven worst losses are (in $’000s)