Chapter 1: Introduction
1.15.
Suppose that one investment has a mean return of 8% and a standard deviation of return of 14%.
Another investment has a mean return of 12% and a standard deviation of return of 20%. The
correlation between the returns is 0.3. Produce a chart similar to Figure 1.2 showing alternative
risk-return combinations from the two investments.
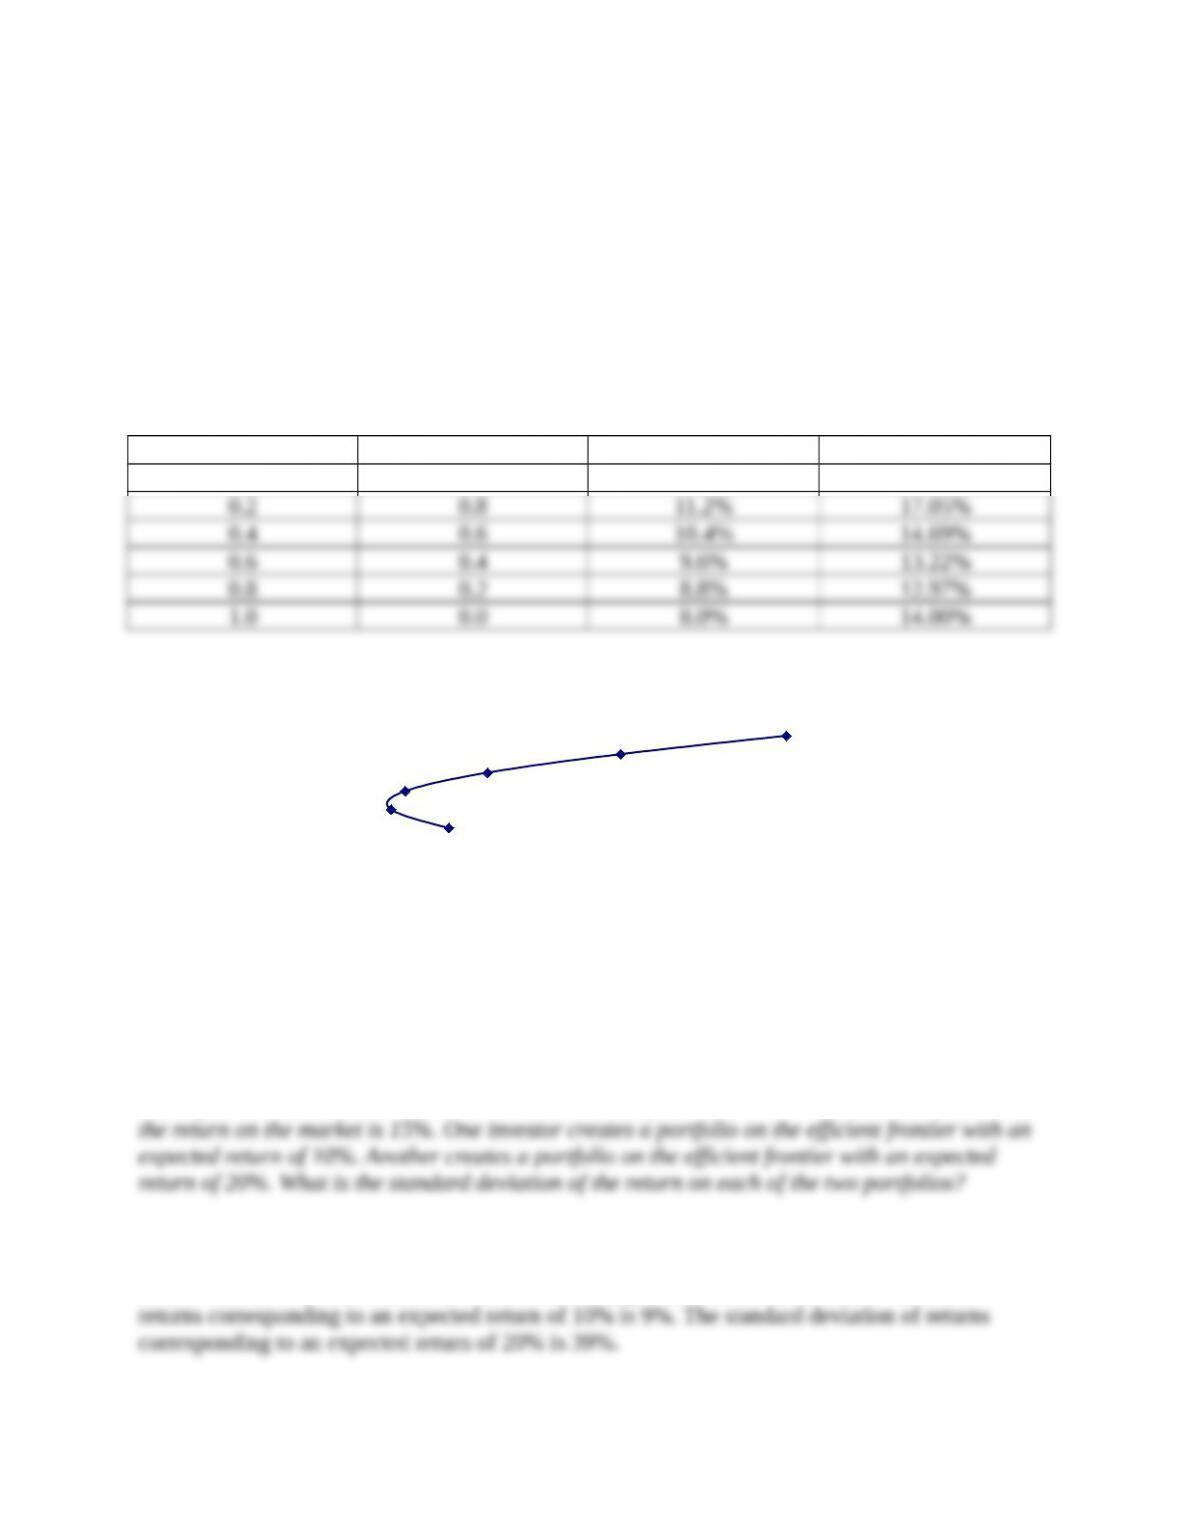
The impact of investing w1 in the first investment and w2 = 1 – w1 in the second investment is
shown in the table below. The range of possible risk-return trade-offs is shown in figure below.
w1w2PP
0.0 1.0 12% 20%
1.16.
The expected return on the market is 12% and the risk-free rate is 7%. The standard deviation of
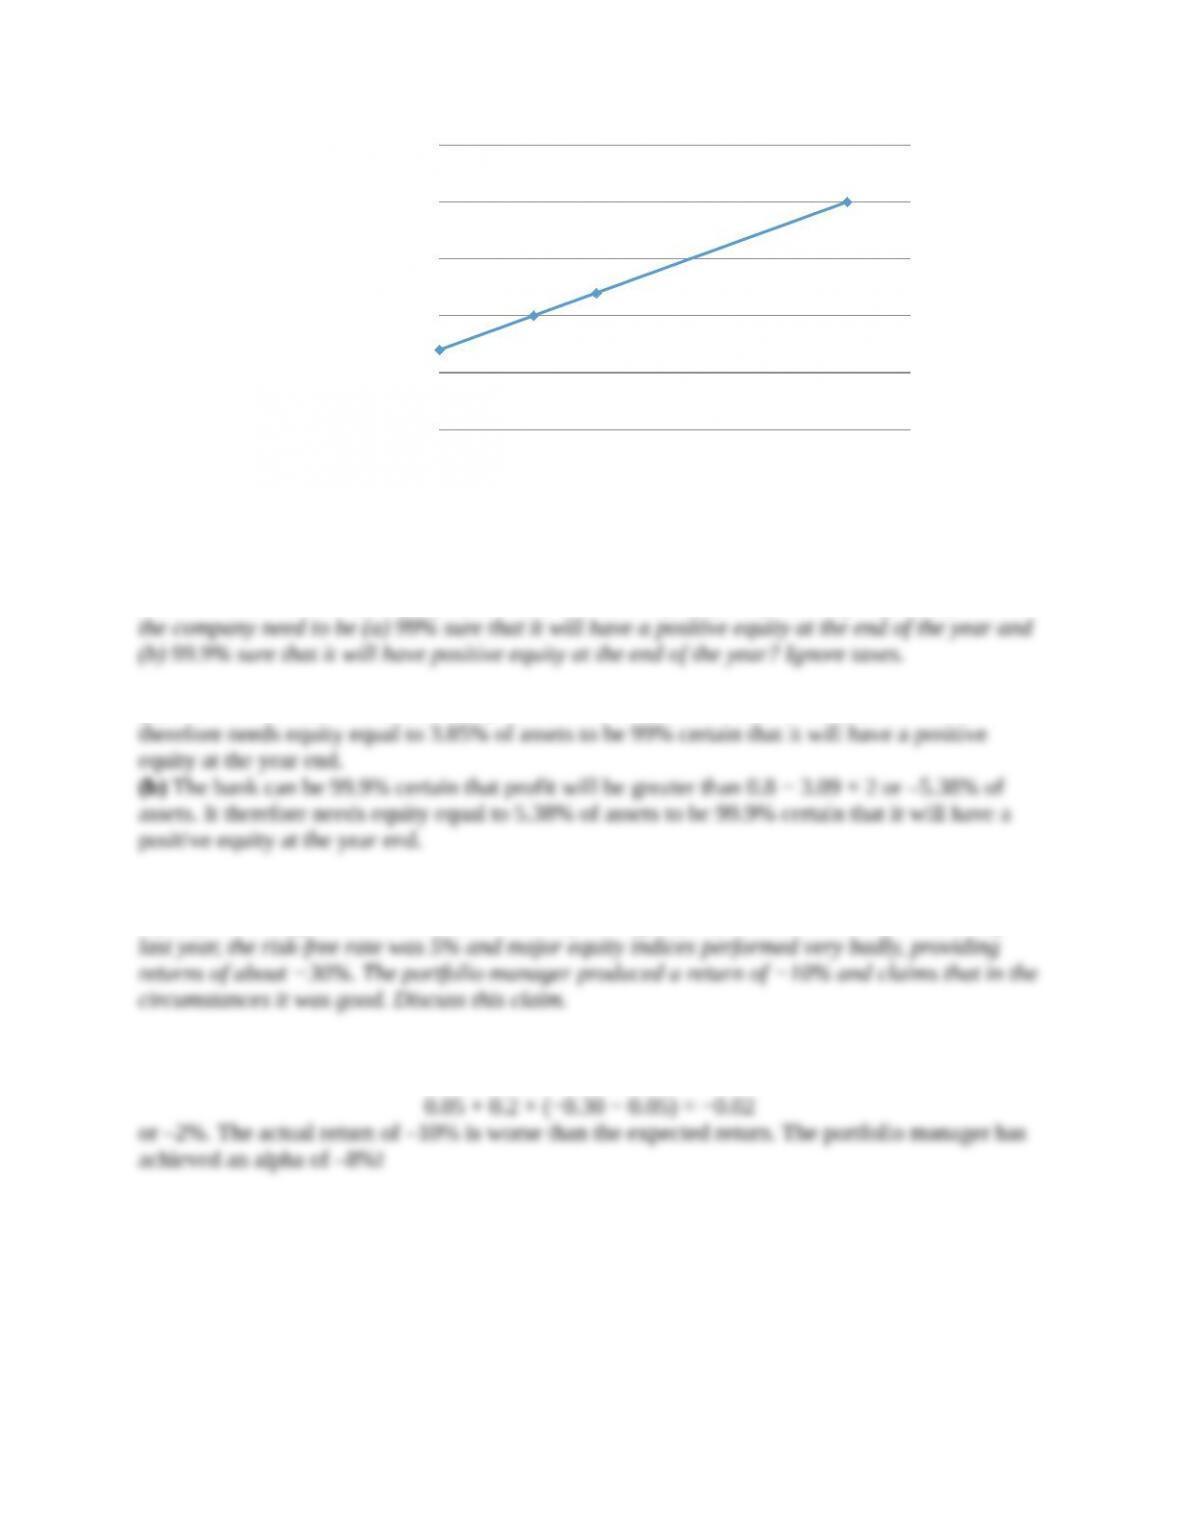
In this case the efficient frontier is as shown in the figure below. The standard deviation of
Standard Deviaon of Ret urn
Expecte d Ret urn
1.17.
A bank estimates that its profit next year is normally distributed with a mean of 0.8% of assets
and the standard deviation of 2% of assets. How much equity (as a percentage of assets) does
(a) The bank can be 99% certain that profit will better than 0.8−2.33×2 or –3.85% of assets. It
1.18.
A portfolio manager has maintained an actively managed portfolio with a beta of 0.2. During the
When the expected return on the market is −30% the expected return on a portfolio with a beta of
0.2 is