
Chapter 15
Question 1
Current Forecast Current Forecast
year year year year
Revenues 120.0 100.0
Cost of sales (90.0) (75.0) 75% 75%
Depreciation (18.0) (15.0) 15% 15%
Operating profit 12.0 10.0 10% 10%
Working capital 36.0 30.0 30% 30%
Property and equipment 120.0 100.0 100% 100%
Invested capital 156.0 130.0 130% 130%
1. Cost of sales will drop only if all costs are variable (or management reduces fixed costs).
2. The value of property and equipment drops $20 million. Since depreciation equals $10 million, the remaining $10
million drop must come from either an asset sale or a write-off. Is an asset sale plausible, and have you modeled the tax
implications? If the drop represents a write-off, did you model this in free cash flow? If equipment remains constant,
then it should only drop to $110 million, and property and equipment cannot remain at 100 percent of revenues.
% of sales
$ million

Chapter 15
Questions 2 & 3
Correct Scenario 1 Scenario 2 Incorrect Average
NOPLAT, $ million 100.0 100.0 NOPLAT, $ million 100.0
Growth 6.0% 2.0% Growth 4.0%
ROIC 16.0% 8.0% ROIC 12.0%
WACC 10.0% 10.0% WACC 10.0%
Value, $ million 1,562.5 937.5 Value, $ million 1,111.1
Probability 0.5 0.5 Value
Weighted value, $ million 781.3 468.8 1,250.0
Which is correct?
Since valuation is not a linear function, you cannot average the inputs to determine the expected value.
Each input must be calculated specifically to that scenario, and equity value must be tied directly to the
individual inputs. Therefore, Question 2 leads to the correct valuation, not Question 3.
Chapter 15
Questions 4 & 5
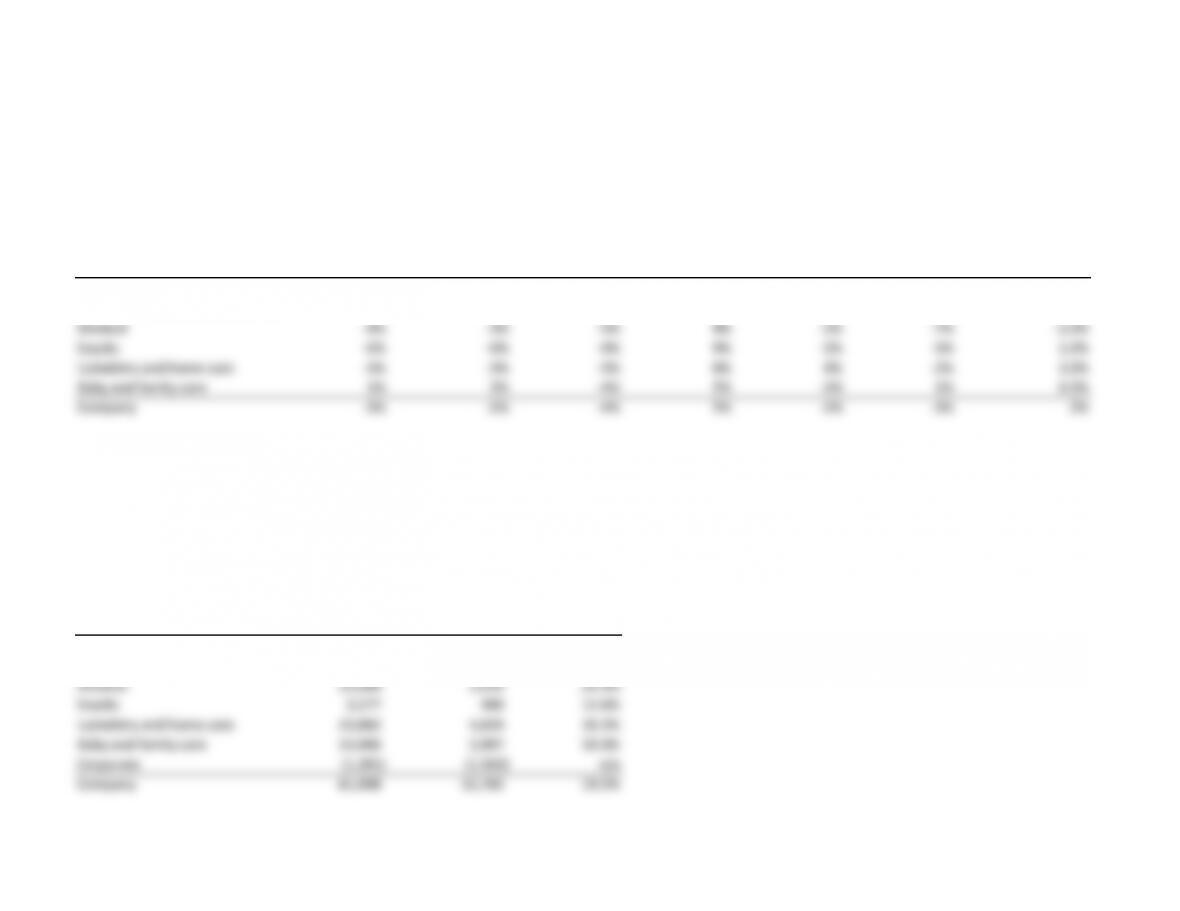
Consumer Products Co annual report
Net sales change drivers vs. year ago, %
Volume
Volume with excluding
acquisitions acquisitions Foreign Net sales Organic
Segment and divestitures and divestitures exchange Price Other growth growth
Styling -2% -1% -4% 2% 0% -4% 1.0%
Refinement -6% -5% -6% 5% -2% -9% -2.0%
Medical -4% -3% -5% 4% -2% -7% -1.0%
Snacks -6% -6% -4% 9% -2% -3% 1.0%
Upholstry and home care -3% -3% -5% 6% 0% -2% 3.0%
Baby and family care 1% 2% -4% 5% -1% 1% 6.0%
Company -3% -2% -4% 5% -1% -3% 2%
Commentary
Consumer Products Co reports six business segements, which appear to have different dynamics at play. For example, baby care is significantly outgrowing grooming.
If this trend persists, a valuation based on the aggregate will not capture the different trends across segments.
Consumer Products Co annual report
$ million
Operating Operating
Segment Revenues profit margin
Styling 19,011 3,455 18.2%
Refinement 7,602 2,116 27.8%
Medical 13,688 3,559 26.0%
Snacks 3,177 400 12.6%
Upholstry and home care 23,882 4,820 20.2%
Baby and family care 14,949 2,997 20.0%
Corporate (1,301) (1,562) n/a
Company 81,008 15,785 19.5%
Commentary
Margins range from 12.6 percent to 27.8 percent, so valuations are likely to be quite different. Note how the lowest-growth segments have the highest
margins. Also, given how low the margins are for snacks and pet care, is the segment creating value? Estimates of ROIC are required!
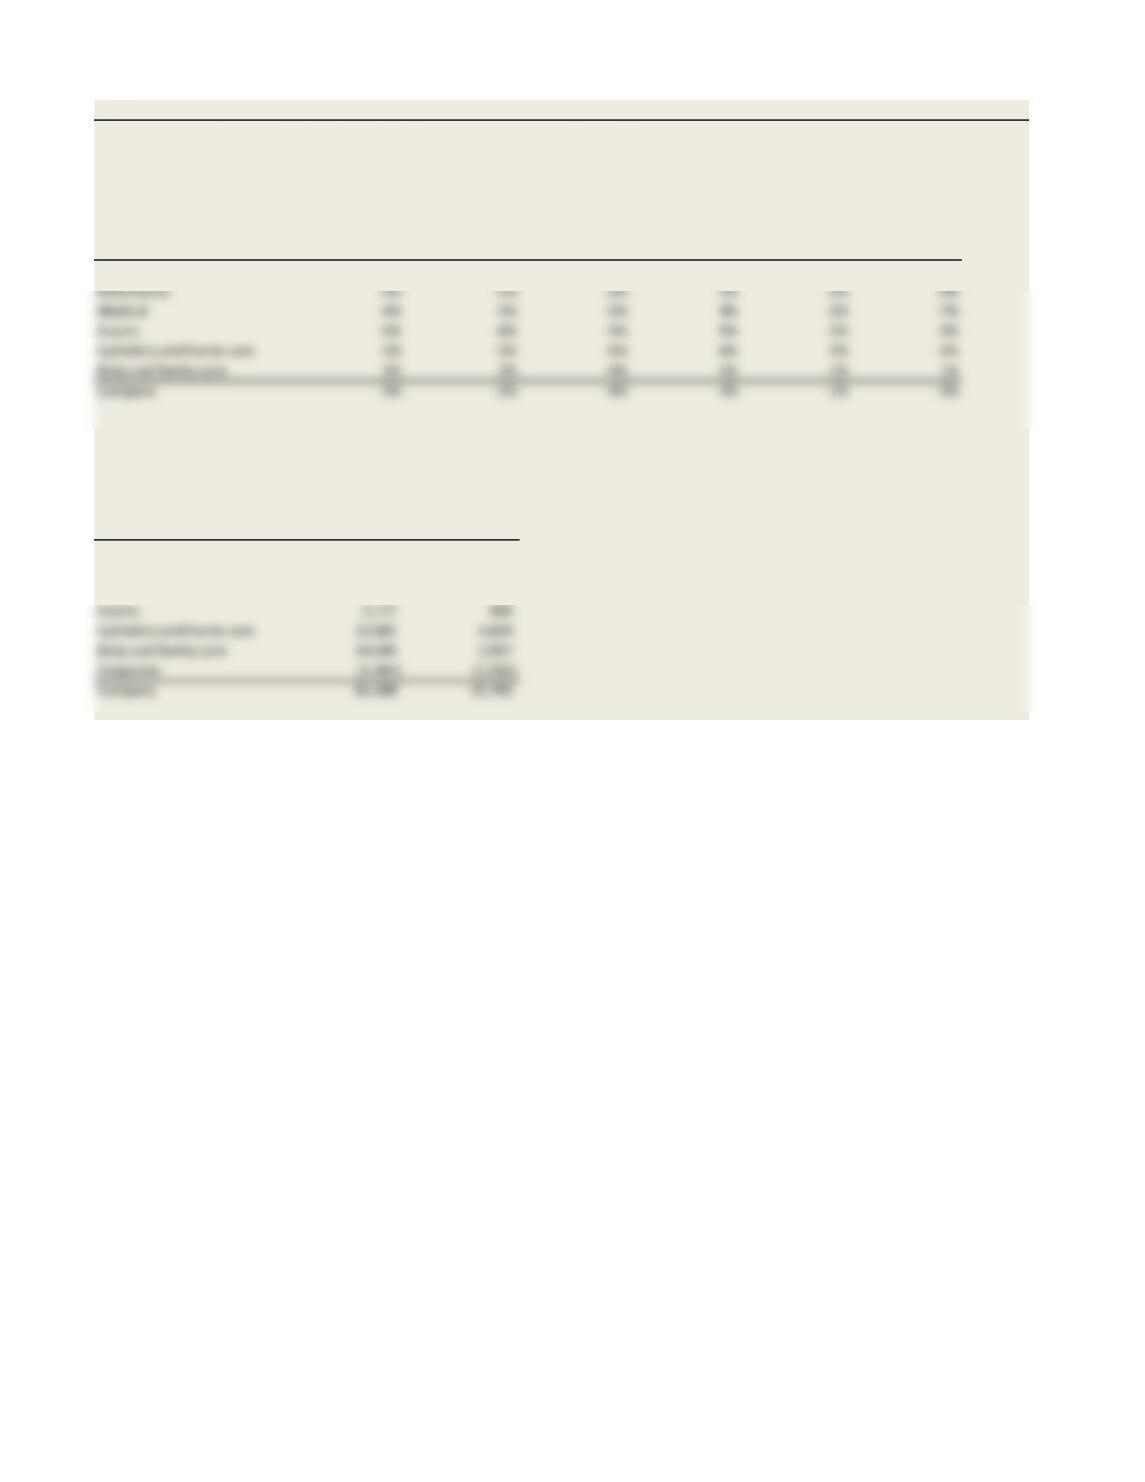
Exhibit 15.6 Consumer Products Co Annual Report
A. Net sales change drivers vs. year ago
%Volume
Volume with excluding
acquisitions acquisitions Foreign Net sales
Segment and divestitures and divestitures exchange Price Other growth
Styling -2% -1% -4% 2% 0% -4%
Refinement -6% -5% -6% 5% -2% -9%
Medical -4% -3% -5% 4% -2% -7%
Snacks -6% -6% -4% 9% -2% -3%
Upholstry and home care -3% -3% -5% 6% 0% -2%
Baby and family care 1% 2% -4% 5% -1% 1%
Company -3% -2% -4% 5% -1% -3%
B. Footnote 10: Financials by segment
$ million
Operating
Segment Revenues profit
Styling 19,011 3,455
Refinement 7,602 2,116
Medical 13,688 3,559
Snacks 3,177 400
Upholstry and home care 23,882 4,820
Baby and family care 14,949 2,997
Corporate (1,301) (1,562)
Company 81,008 15,785