Chapter 11
Question 1
Accrued and other liabilities—current
$ million
Year 1
Marketing and promotion 2,833.0
Compensation expenses 1,846.0 From Footnote 4
Accrued ShaveCo exit costs 456.0
Taxes payable 922.0 ShaveCo severance costs are a restructuring charge and therefore should be
Other 102.0 treated as a debt equivalent. Debt equivalents should not be forecast
Total 6,159.0 within free cash flow and therefore should not be included in accrued and other liabilities.
One would also want to dig into the final line, “Other,” to see if there are
Consolidated statements of earnings nonoperating items included in this figure. If so, they should be removed as well.
Revenues, $ million 49,000.0
Ratio analysis (as stated),
% of revenues 12.6%
Ratio analysis (adjusted),
% of revenues 11.6%
Chapter 11
Questions 2–4
PartsCo PartsCo
Income statement Financial ratio analysis
$ million % of revenues
Prior Current Forecast Forecast Forecast Forecast Forecast Prior Current Forecast Forecast Forecast Forecast Forecast
year year year 1 year 2 year 3 year 4 year 5 year year year 1 year 2 year 3 year 4 year 5
Revenues 1,100.0 1,188.0 1,283.0 1,385.7 1,496.5 1,616.3 1,745.6 Revenues n/a 8.0% 8.0% 8.0% 8.0% 8.0% 8.0%
Cost of sales (825.0) (891.0) (962.3) (1,039.3) (1,122.4) (1,212.2) (1,309.2) Cost of sales/revenues 75.0% 75.0% 75.0% 75.0% 75.0% 75.0% 75.0%
Selling costs (165.0) (178.2) (192.5) (207.9) (224.5) (242.4) (261.8) Selling costs/revenues 15.0% 15.0% 15.0% 15.0% 15.0% 15.0% 15.0%
Depreciation (27.6) (29.7) (32.1) (34.6) (37.4) (40.4) (43.6)
Depreciation/net PP&Et–1 n/a 6.8% 6.8% 6.8% 6.8% 6.8% 6.8%
Operating profit 82.4 89.1 96.2 103.9 112.2 121.2 130.9 Operating profits 7.5% 7.5% 7.5% 7.5% 7.5% 7.5% 7.5%
Interest (15.0) (15.0) (15.0) (15.0) (15.0) (15.0) (15.0) Interest, % of prior year’s debt n/a 5.0% 5.0% 5.0% 5.0% 5.0% 5.0%
Earnings before taxes (EBT) 67.4 74.1 81.2 88.9 97.2 106.2 115.9 Earnings before taxes (EBT) 6.1% 6.2% 6.3% 6.4% 6.5% 6.6% 6.6%
Taxes (20.2) (22.2) (24.4) (26.7) (29.2) (31.9) (34.8) Effective tax rate, % of EBT 30.0% 30.0% 30.0% 30.0% 30.0% 30.0% 30.0%
Net income 47.2 51.9 56.9 62.2 68.1 74.4 81.1 Net income 4.3% 4.4% 4.4% 4.5% 4.5% 4.6% 4.6%
Dividends 19.0 21.0 23.0 25.2 27.6 30.1 32.9 Dividend payout ratio 40.3% 40.5% 40.5% 40.5% 40.5% 40.5% 40.5%
PartsCo PartsCo
Balance sheet Financial ratio analysis
$ million % of revenues (or cost of sales)
Prior Current Forecast Forecast Forecast Forecast Forecast Prior Current Forecast Forecast Forecast Forecast Forecast
Assets year year year 1 year 2 year 3 year 4 year 5 Assets year year year 1 year 2 year 3 year 4 year 5
Working cash 22.0 23.8 25.7 27.7 29.9 32.3 34.9 Working cash/revenues 2.0% 2.0% 2.0% 2.0% 2.0% 2.0% 2.0%
Excess cash 385.2 377.6 369.7 361.6 353.3 344.9 336.3 Excess cash – – 28.8% 26.1% 23.6% 21.3% 19.3%
Accounts receivable 110.0 118.8 128.3 138.6 149.7 161.6 174.6 Accounts receivable 10.0% 10.0% 10.0% 10.0% 10.0% 10.0% 10.0%
Current assets 641.0 653.9 668.0 683.8 701.3 720.7 742.1
Property, plant and equipment, net 440.0 475.2 513.2 554.3 598.6 646.5 698.2 Property and equipment/revenues 40.0% 40.0% 40.0% 40.0% 40.0% 40.0% 40.0%
Equity investments 320.0 320.0 320.0 320.0 320.0 320.0 320.0 Equity investments, $ million 320 320 320 320 320 320 320
Liabilities and equity Liabilities and equity
Accounts payable 123.8 133.7 144.3 155.9 168.4 181.8 196.4 Accounts payable, % of cost of sales 15.0% 15.0% 15.0% 15.0% 15.0% 15.0% 15.0%
Short-term debt 90.0 90.0 90.0 90.0 90.0 90.0 90.0 Short-term debt, $ million 90 90 90 90 90 90 90
Accrued expenses 88.0 95.0 102.6 110.9 119.7 129.3 139.6 Accrued expenses 8.0% 8.0% 8.0% 8.0% 8.0% 8.0% 8.0%
Current liabilities 301.8 318.7 337.0 356.7 378.1 401.1 426.0
Long-term debt 210.0 210.0 210.0 210.0 210.0 210.0 210.0 Long-term debt, $ million 210 210 210 210 210 210 210
Newly issued debt 0.0 0.0 0.0 0.0 0.0 0.0 0.0 Total debt, $ million 210 210 210 210 210 210 210
Common stock 150.0 150.0 150.0 150.0 150.0 150.0 150.0 Common stock, $ million 150 150 150 150 150 150 150
Retained earnings 739.2 770.4 804.2 841.3 881.8 926.0 974.3
Chapter 11
Question 5
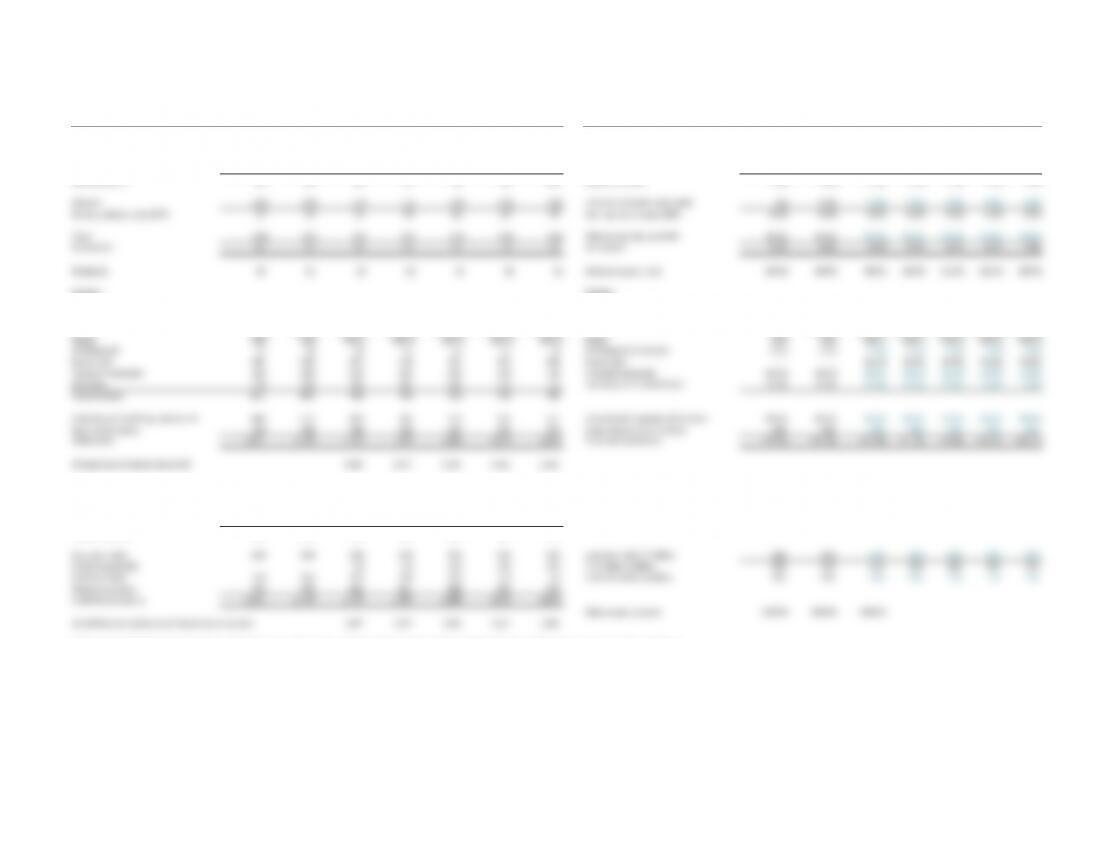
PartsCo PartsCo
Income statement Financial ratio analysis
$ million % of revenues
Prior Current Forecast Forecast Forecast Forecast Forecast Prior Current Forecast Forecast Forecast Forecast Forecast
year year year 1 year 2 year 3 year 4 year 5 year year year 1 year 2 year 3 year 4 year 5
Revenues 1,100 1,188 1,224 1,260 1,298 1,337 1,377 Revenues n/a 8.0% 3.0% 3.0% 3.0% 3.0% 3.0%
Cost of sales (825) (891) (918) (945) (974) (1,003) (1,033) Cost of sales/revenues 75.0% 75.0% 75.0% 75.0% 75.0% 75.0% 75.0%
Selling costs (165) (178) (184) (189) (195) (201) (207) Selling costs/revenues 15.0% 15.0% 15.0% 15.0% 15.0% 15.0% 15.0%
Depreciation (28) (30) (32) (33) (34) (35) (36)
Depreciation/net PP&Et–1 n/a 6.8% 6.8% 6.8% 6.8% 6.8% 6.8%
Operating profit 82 89 90 93 96 99 102 Operating profits 7.5% 7.5% 7.4% 7.4% 7.4% 7.4% 7.4%
Interest (15) (15) (15) (15) (15) (15) (15) Interest, % of prior year’s debt n/a 5.0% 5.0% 5.0% 5.0% 5.0% 5.0%
Earnings before taxes (EBT) 67 74 75 78 81 84 87 Earnings before taxes (EBT) 6.1% 6.2% 6.2% 6.2% 6.2% 6.3% 6.3%
Taxes (20) (22) (23) (23) (24) (25) (26) Effective tax rate, % of EBT 30.0% 30.0% 30.0% 30.0% 30.0% 30.0% 30.0%
Net income 47 52 53 55 57 59 61 Net income 4.3% 4.4% 4.3% 4.3% 4.4% 4.4% 4.4%
Dividends 19 21 21 22 23 24 25 Dividend payout ratio 40.3% 40.5% 40.5% 40.5% 40.5% 40.5% 40.5%
PartsCo PartsCo
Balance sheet Financial ratio analysis
$ million % of revenue (or cost of sales)
Prior Current Forecast Forecast Forecast Forecast Forecast Prior Current Forecast Forecast Forecast Forecast Forecast
Assets year year year 1 year 2 year 3 year 4 year 5 Assets year year year 1 year 2 year 3 year 4 year 5
Working cash 22 24 24 25 26 27 28 Working cash/revenues 2.0% 2.0% 2.0% 2.0% 2.0% 2.0% 2.0%
Excess cash 385 378 393 410 427 444 463 Excess cash – – 32.1% 32.5% 32.9% 33.2% 33.6%
Accounts receivable 110 119 122 126 130 134 138 Accounts receivable 10.0% 10.0% 10.0% 10.0% 10.0% 10.0% 10.0%
Inventory 124 134 138 142 146 150 155 Inventory, % of cost of sales 15.0% 15.0% 15.0% 15.0% 15.0% 15.0% 15.0%
Current assets 641 654 678 703 729 755 783
Property, plant and equipment, net 440 475 489 504 519 535 551 Property and equipment/revenues 40.0% 40.0% 40.0% 40.0% 40.0% 40.0% 40.0%
Equity investments 320 320 320 320 320 320 320 Equity investments, $ million 320 320 320 320 320 320 320
Total assets 1,401 1,449 1,487 1,527 1,568 1,610 1,654 Total assets/revenues 127.4% 122.0% 121.5% 121.1% 120.8% 120.4% 120.1%
All asset accounts except excess cash 1,094 1,117 1,141 1,166 1,191
Liabilities and equity Liabilities and equity
Accounts payable 124 134 138 142 146 150 155 Accounts payable, % of cost of sales 15.0% 15.0% 15.0% 15.0% 15.0% 15.0% 15.0%
Short-term debt 90 90 90 90 90 90 90 Short-term debt, $ million 90 90 90 90 90 90 90
Accrued expenses 88 95 98 101 104 107 110 Accrued expenses 8.0% 8.0% 8.0% 8.0% 8.0% 8.0% 8.0%
Current liabilities 302 319 326 333 340 347 355
Long-term debt 210 210 210 210 210 210 210 Long-term debt, $ million 210 210 210 210 210 210 210
Newly issued debt – – 0.0 0.0 0.0 0.0 0.0 Total debt, $ million 210 210 210 210 210 210 210
Common stock 150 150 150 150 150 150 150 Common stock, $ million 150 150 150 150 150 150 150
Retained earnings 739 770 802 834 868 903 939
Liabilities and equity 1,401 1,449 1,487 1,527 1,568 1,610 1,654
Debt to equity (book) 140.0% 140.0% 140.0%
All liabilities and equity accounts except short-term debt 1,487 1,527 1,568 1,610 1,654
If the company generates more cash than it needs, the firm could pay out dividends to reduce the cash balance. This would reduce the equity account (through a reduction
in retained earnings. Alternatively, the firm could buy back shares, which also would reduce the equity account.
Chapter 11
Question 6
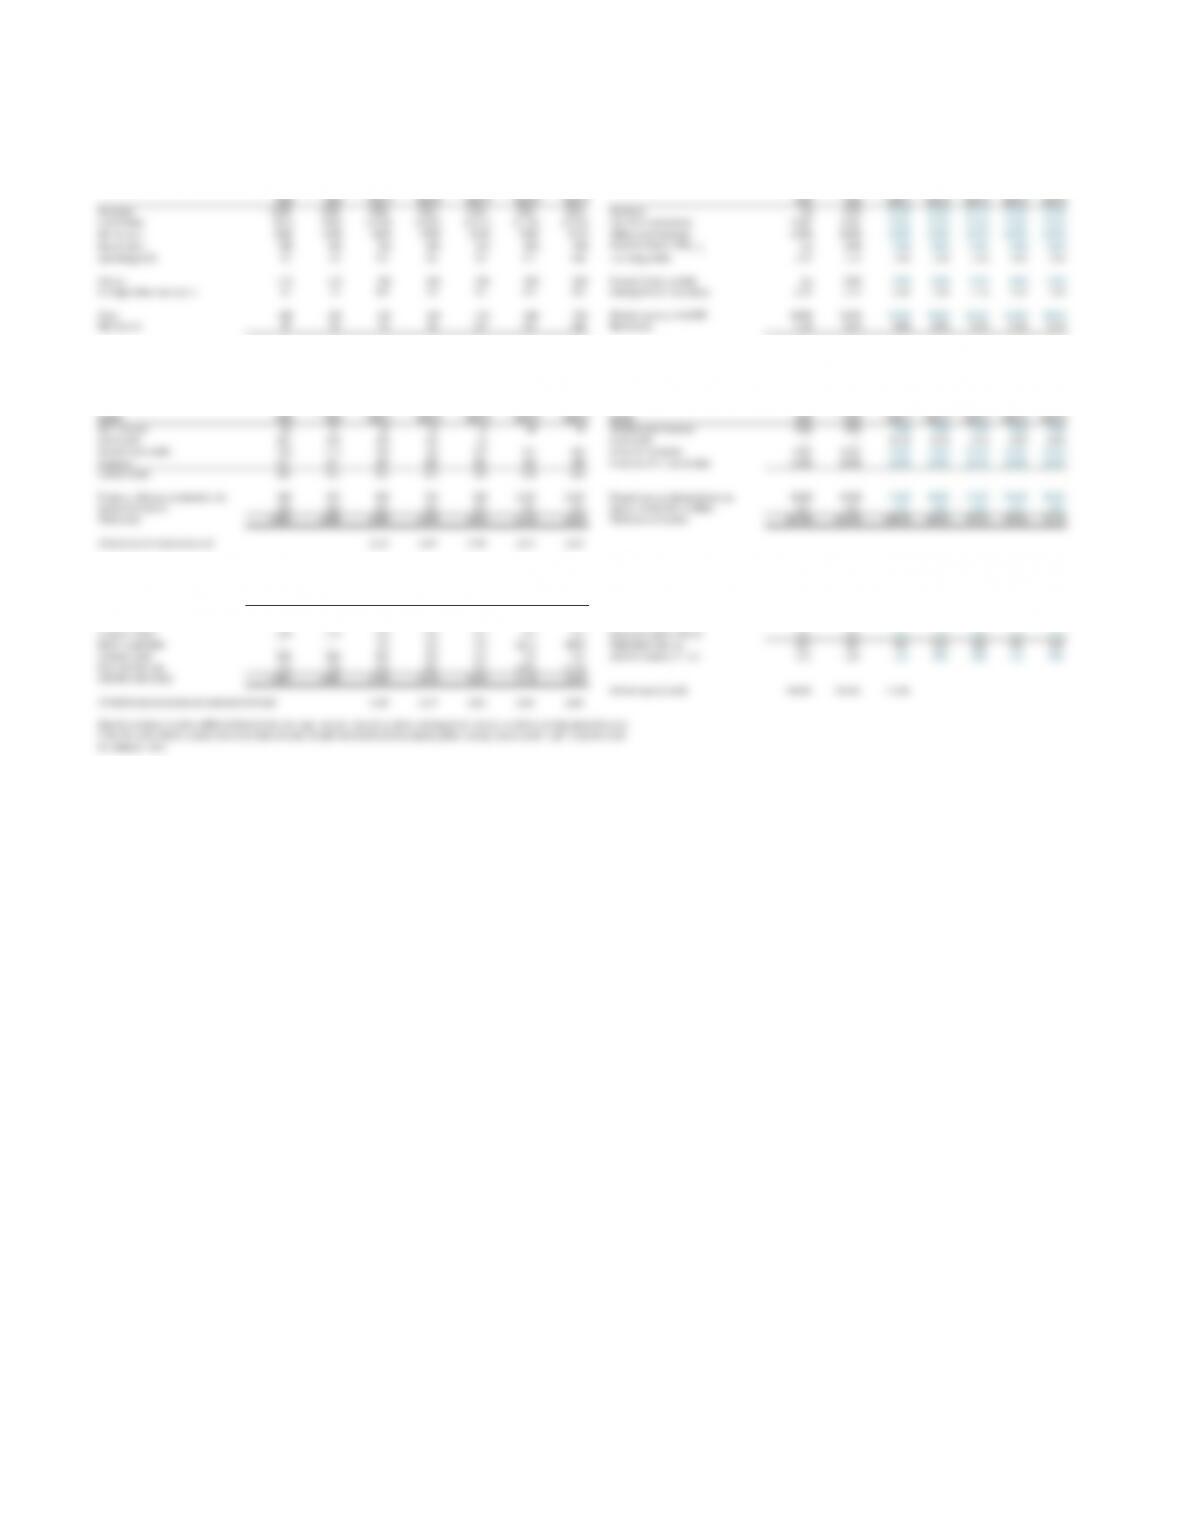
PartsCo PartsCo
Income statement Financial ratio analysis
$ million % of revenues
Prior Current Forecast Forecast Forecast Forecast Forecast Prior Current Forecast Forecast Forecast Forecast Forecast
year year year 1 year 2 year 3 year 4 year 5 year year year 1 year 2 year 3 year 4 year 5
Revenues 1,100 1,188 1,485 1,856 2,320 2,900 3,625 Revenues n/a 8.0% 25.0% 25.0% 25.0% 25.0% 25.0%
Cost of sales (825) (891) (1,114) (1,392) (1,740) (2,175) (2,719) Cost of sales/revenues 75.0% 75.0% 75.0% 75.0% 75.0% 75.0% 75.0%
Selling costs (165) (178) (223) (278) (348) (435) (544) Selling costs/revenues 15.0% 15.0% 15.0% 15.0% 15.0% 15.0% 15.0%
Depreciation (28) (30) (32) (40) (50) (63) (78)
Depreciation/net PP&Et–1 n/a 6.8% 6.8% 6.8% 6.8% 6.8% 6.8%
Operating profit 82 89 116 146 182 227 284 Operating profits 7.5% 7.5% 7.8% 7.8% 7.8% 7.8% 7.8%
Interest (15) (15) (15) (15) (15) (15) (21) Interest, % of prior debt n/a 5.0% 5.0% 5.0% 5.0% 5.0% 5.0%
Earnings before taxes (EBT) 67 74 101 131 167 212 263 Earnings before taxes (EBT) 6.1% 6.2% 6.8% 7.0% 7.2% 7.3% 7.3%
Taxes (20) (22) (30) (39) (50) (64) (79) Effective tax rate, % of EBT 30.0% 30.0% 30.0% 30.0% 30.0% 30.0% 30.0%
Net income 47 52 71 91 117 149 184 Net income 4.3% 4.4% 4.8% 4.9% 5.0% 5.1% 5.1%
Dividends 19 21 29 37 47 60 75 Dividend payout ratio 40.3% 40.5% 40.5% 40.5% 40.5% 40.5% 40.5%
PartsCo PartsCo
Balance sheet Financial ratio analysis
$ million % of revenue (or cost of sales)
Prior Current Forecast Forecast Forecast Forecast Forecast Prior Current Forecast Forecast Forecast Forecast Forecast
Assets year year year 1 year 2 year 3 year 4 year 5 Assets year year year 1 year 2 year 3 year 4 year 5
Working cash 22 24 30 37 46 58 73 Working cash/revenues 2.0% 2.0% 2.0% 2.0% 2.0% 2.0% 2.0%
Excess cash 385 378 289 180 46 – – Excess cash – – 19.5% 9.7% 2.0% 0.0% 0.0%
Accounts receivable 110 119 149 186 232 290 363 Accounts receivable 10.0% 10.0% 10.0% 10.0% 10.0% 10.0% 10.0%
Inventory 124 134 167 209 261 326 408 Inventory, % of cost of sales 15.0% 15.0% 15.0% 15.0% 15.0% 15.0% 15.0%
Current assets 641 654 635 612 585 674 843
Property, plant and equipment, net 440 475 594 743 928 1,160 1,450 Property and equipment/revenues 40.0% 40.0% 40.0% 40.0% 40.0% 40.0% 40.0%
Equity investments 320 320 320 320 320 320 320 Equity investments, $ million 320 320 320 320 320 320 320
Total assets 1,401 1,449 1,549 1,674 1,833 2,154 2,613 Total assets/revenues 127.4% 122.0% 104.3% 90.2% 79.0% 74.3% 72.1%
All asset accounts except excess cash 1,259 1,494 1,788 2,154 2,613
Liabilities and equity Liabilities and equity
Accounts payable 124 134 167 209 261 326 408 Accounts payable, % of cost of sales 15.0% 15.0% 15.0% 15.0% 15.0% 15.0% 15.0%
Short-term debt 90 90 90 90 90 90 90 Short-term debt, $ million 90 90 90 90 90 90 90
Accrued expenses 88 95 119 149 186 232 290 Accrued expenses 8.0% 8.0% 8.0% 8.0% 8.0% 8.0% 8.0%
Current liabilities 302 319 376 447 537 648 788
Long-term debt 210 210 210 210 210 210 210 Long-term debt, $ million 210 210 210 210 210 210 210
Newly issued debt – – 0.0 0.0 0.0 121.1 330.5 Total debt, $ million 210 210 210 210 210 210 210
Common stock 150 150 150 150 150 150 150 Common stock, $ million 150 150 150 150 150 150 150
Retained earnings 739 770 813 867 937 1,025 1,135
Liabilities and equity 1,401 1,449 1,549 1,674 1,833 2,154 2,613
Debt to equity (book) 140.0% 140.0% 140.0%
All liabilities and equity accounts except short-term debt 1,549 1,674 1,833 2,033 2,283
Now the company requires additional debt to fund the large increase in property, plant, and equipment needed to achieve the high growth in sales.
If this firm were able to achieve some economies of scale, it might not need as much property, plant, and equipment, which might lessen the need
for additional debt.

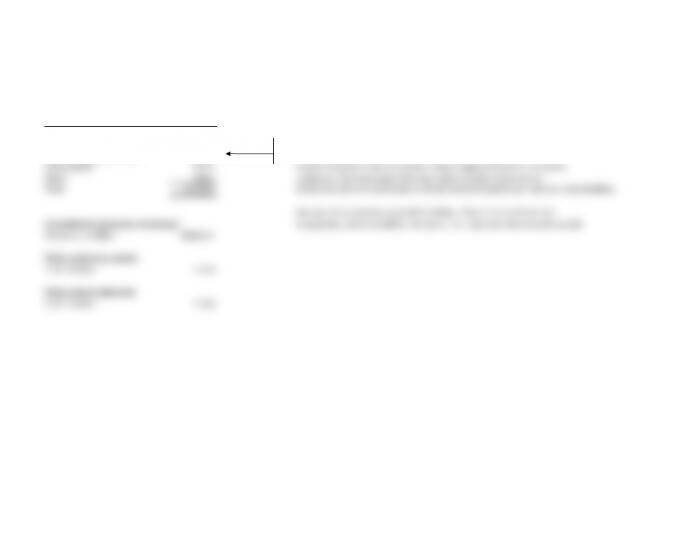
EXHIBIT 11.15 HouseholdCo: Annual Report
Note 4
Supplemental financial information
Selected components of current and noncurrent liabilities were as follows:
Accrued and other liabilities—current
$ million
Year 1
Marketing and promotion 2,833.0
Compensation expenses 1,846.0
Accrued ShaveCo exit costs* 456.0
Taxes payable 922.0
Other 102.0
Total 6,159.0
*Results from severance costs due to acquisition of ShaveCo,
a consumer products firm, in prior year.
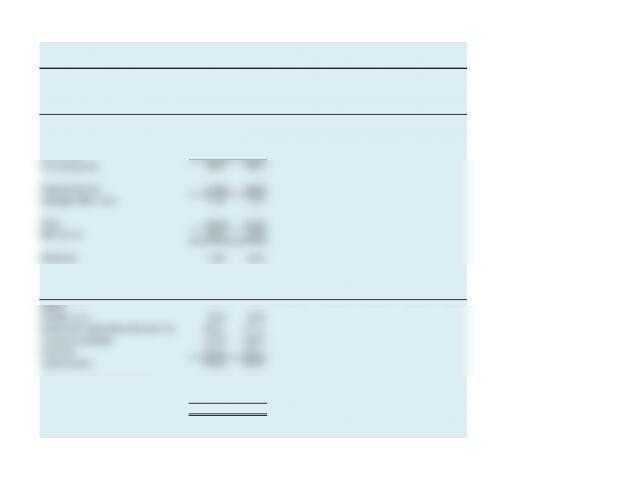
EXHIBIT 11.16 PartsCo: Consolidated Financial Statements
$ million
Prior Current Forecast Forecast Forecast Forecast Forecast
Income statement year year year 1 year 2 year 3 year 4 year 5
Revenues 1,100.0 1,188.0
Cost of sales (825.0) (891.0)
Selling costs (165.0) (178.2)
Depreciation (27.6) (29.7)
Operating profit 82.4 89.1
Interest expense (15.0) (15.0)
Earnings before taxes 67.4 74.1
Taxes (20.2) (22.2)
Net income 47.2 51.9
Dividends 19.0 21.0
Prior Current Forecast Forecast Forecast Forecast Forecast
Balance sheet year year year 1 year 2 year 3 year 4 year 5
Assets
Working cash 22.0 23.8
Excess cash and marketable securities 385.2 377.6
Accounts receivable 110.0 118.8
Inventory 123.8 133.7
Current assets 641.0 653.9
Property, plant and equipment 440.0 475.2
Equity investments 320.0 320.0
Total assets 1,401.0 1,449.1

Liabilities and equity
Accounts payable 123.8 133.7
Short-term debt 90.0 90.0
Accrued expenses 88.0 95.0
Current liabilities 301.8 318.7
Long-term debt 210.0 210.0
Newly issued debt – –
Common stock 150.0 150.0
Retained earnings 739.2 770.4
Liabilities and equity 1,401.0 1,449.1