Chapter 10
Questions 1–2
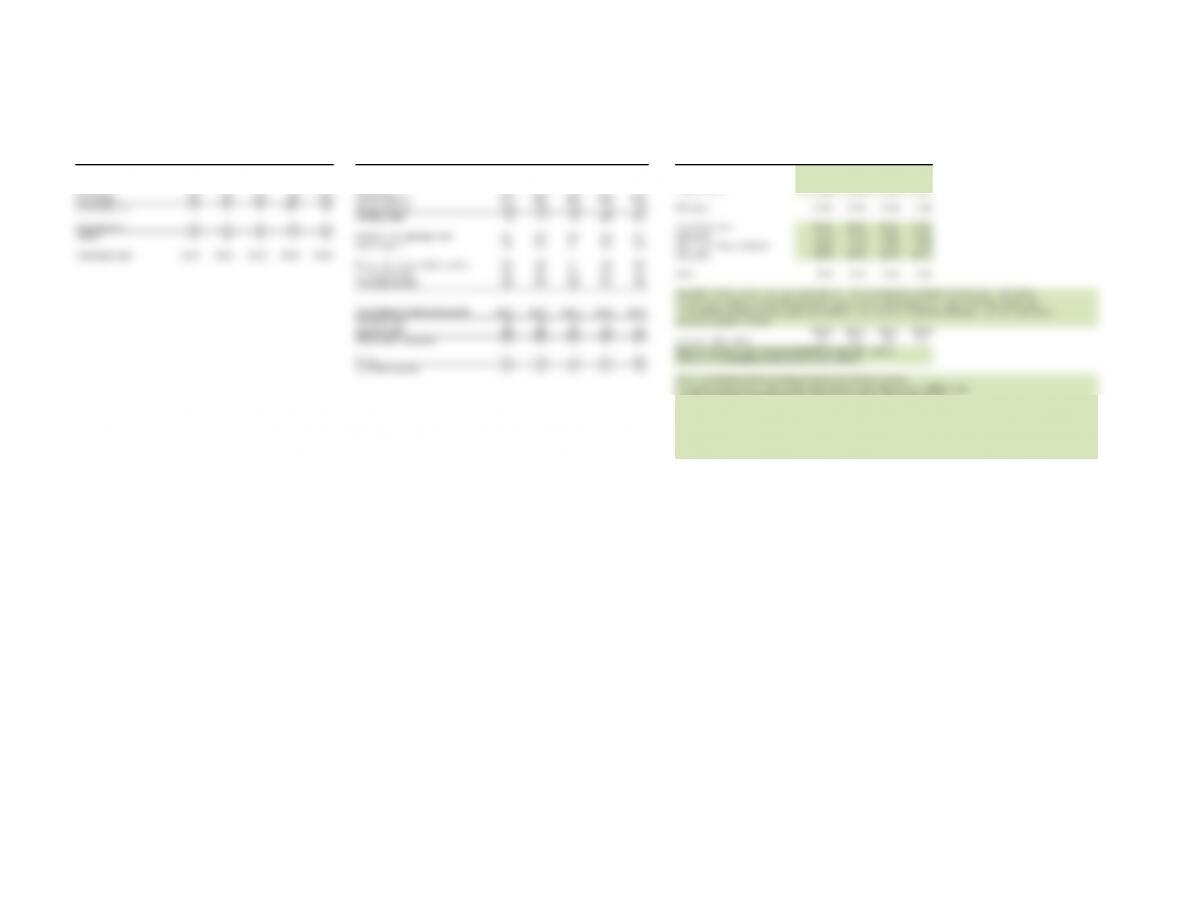
ShipCo: Reorganized financial statements ShipCo: Ratio analysis
$ million
NOPLAT Year 1 Year 2 Year 3 Year 4 Year 5 Total funds invested Year 1 Year 2 Year 3 Year 4 Year 5 Ratio Year 1 Year 2 Year 3 Year 4 Year 5
Revenues 530 557 601 661 674 Working cash 11 11 12 13 13 ROIC 22.8% 22.5% 21.6% 17.1%
Cost of sales (345) (365) (397) (440) (452) Accounts receivable 80 81 93 99 98 Operating margin 11.2% 11.6% 11.6% 9.8%
Selling costs (80) (86) (87) (93) (108) Inventories 170 184 204 231 243 Capital turnover 2.04 1.95 1.87 1.74
Depreciation (16) (17) (18) (20) (20) Accounts payable (117) (120) (126) (136) (135)
Operating income 90 89 99 109 94 Accrued expenses (90) (89) (93) (99) (98) ROIC check 22.8% 22.5% 21.6% 17.1%
Working capital 53 67 90 109 121
Operating taxes (27) (27) (30) (33) (28) Cost of sales/sales 65.5% 66.0% 66.5% 67.0%
NOPLAT 63 62 69 76 66 Property, plant, and equipment 207 220 240 268 276 SG&A/sales 15.5% 14.5% 14.0% 16.0%
Invested capital 260 287 331 377 398 Operating working capital/sales 10.8% 13.1% 15.1% 17.1%
Operating tax rate 30.0% 30.0% 30.0% 30.0% 30.0% PP&E/sales 38.3% 38.3% 38.4% 40.4%
Excess cash and marketable securities 103 109 111 118 140
Equity investments 180 180 180 180 180 WACC 9.0% 9.0% 9.0% 9.0%
Total funds invested 543 575 622 675 718
Since ROIC > WACC, ShipCo is creating value in Years 2–5. This is corroborated by the below-economic-profit calculations.
However, year 5 shows a dramatic decrease in performance of ROIC and economic profit. Upon further investigation, one
Reconciliation of total funds invested Year 1 Year 2 Year 3 Year 4 Year 5 can see that the operating margin dropped significantly from 11.6 percent to 9.8 percent, while capital turnover has also been
Short-term debt 45 45 45 45 45 experiencing significant decline.
Long-term debt 105 105 105 105 105 Year 2 Year 3 Year 4 Year 5
Debt and debt equivalents 150 150 150 150 150 Economic profit, $ million 37.7 41.6 44.5 31.2
(Note that the loss on sale of assets has NO EFFECT on the ROIC measure,
Equity 392 426 472 525 568 as this is a nonoperating item and is not included in NOPLAT.)
Total funds invested 542 576 622 675 718
One can see that the decline in operating margin has been driven by a steady
increase in the ratio of cost of sales to sales, and in the last year by a big increase in SG&A to sales.
However, one must be careful in interpreting the increase in SG&A to sales, as this may be
driven by the dropoff in sales growth in year 5.
The decline in capital turnover is driven by both an increase in operating working capital to sales and
an increase in property, plant, and equipment (PP&E) to sales, particularly in the last year. The increase in PP%E to sales
may be due to investments in anticipation of future sales or due to an unexpected decline
in sales in year 5. The increase in operating working capital to sales can be explored in the next problem.
Chapter 10
Question 3
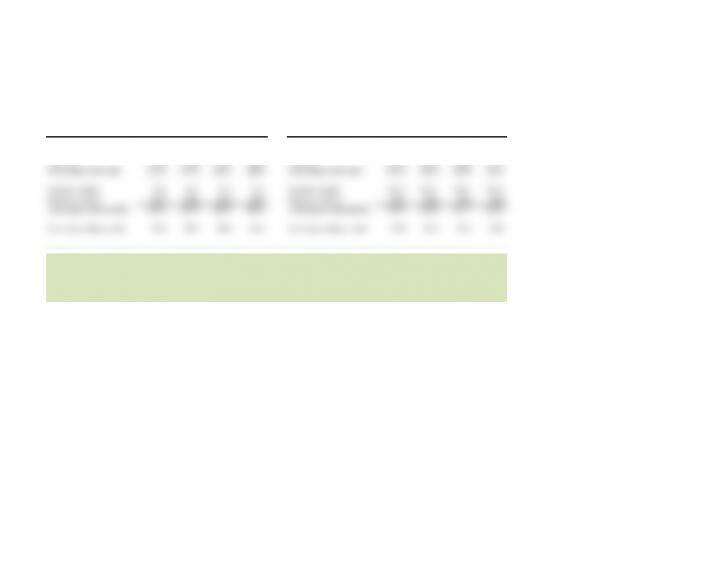
ShipCo: Days in operating working capital (using revenues in denominator) ShipCo: Days in operating working capital (using cost of goods sold in denominator for inventory & accounts payable)
Year 2 Year 3 Year 4 Year 5 Year 2 Year 3 Year 4 Year 5
Operating cash 7.1 7.0 7.0 7.2 Operating cash 7.1 7.0 7.0 7.2
Accounts receivable 52.5 52.8 53.1 53.3 Accounts receivable 52.5 52.8 53.1 53.3
Inventory 115.8 117.8 120.3 128.3 Inventory 176.9 178.5 180.9 191.5
Operating current assets 175.5 177.6 180.3 188.9 Operating current assets 236.5 238.3 240.9 252.1
Accounts payable 77.5 74.7 72.3 73.2 Accounts payable 118.3 113.1 108.7 109.2
Accrued expenses 58.7 55.3 53.1 53.3 Accrued expenses 58.7 55.3 53.1 53.3
Operating current liabilities 136.2 130.0 125.3 126.5 Operating current liabilities 177.0 168.4 161.7 162.5
Operating working capital 39.3 47.7 55.0 62.4 Operating working capital 59.5 69.9 79.2 89.5
DefenseCo appears to be doing a much better job of managing its operating working capital, as evidenced by the range of 10.4 to 11.3 days,
as opposed to a range of 39.3 to 62.4 days for ShipCo (using table on the left).
Upon further inspection, DefenseCo has significantly lower inventory days, which could be due to better inventory management
or due to the different nature of its business (not relying solely on shipbuilding).
DefenseCo also has lower receivables days, an area that would need further inspection.

Chapter 10
Question 4
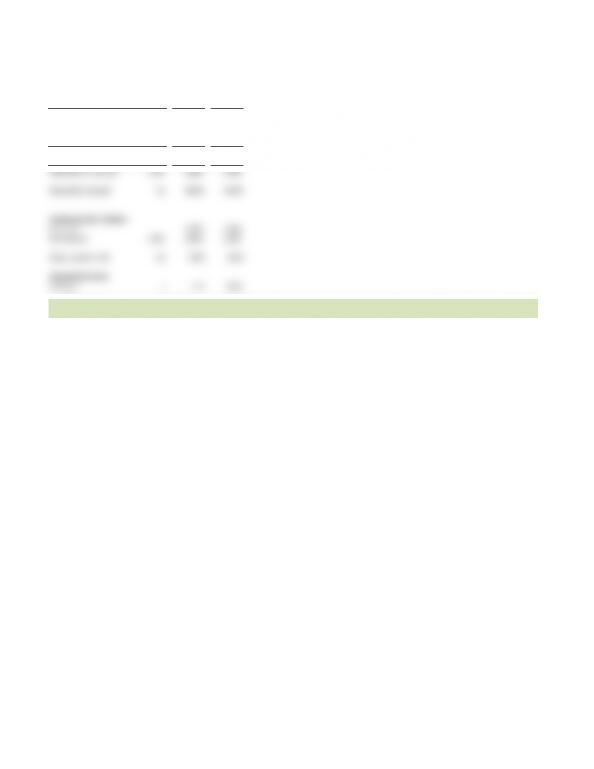
PaperPro ExpertPaper
$ million
NOPLAT 325 750
Invested capital without goodwill 2,500 6,000
Goodwill 950 –
Invested capital with goodwill 3,450 6,000
ROIC without goodwill 13.0% 12.5%
ROIC with goodwill 9.4% 12.5%
Without goodwill included in the ROIC calculations, both firms appear to be creating value. However,
to measure value creation after the acquisition, ROIC should be measured with goodwill.
In essence, we’re charging PaperPro for the acquisition premium paid to target firms.
The inclusion of goodwill causes PaperPro’s ROIC to drop from 13.0 percent to 9.4 percent. Thus, they are
currently destroying value. However, it may take time for PaperPro to work through this acquisition
and reap its benefits.
ExpertPaper is creating value, as its ROIC is above its WACC, so it has the best financial performance in this period.
Chapter 10
Question 5
Reported revenues, $ million
PaperExpo Year 1 Year 2 Year 3
Revenues 800 800 800
PaperPro
PaperPro 1,500 1,600 1,700
PaperExpo 0 200 800
Consolidated revenues 1,500 1,800 2,500
Consolidated growth n/a 20.0% 38.9%
Organic growth, $ million
Prior year 1,700 2,400
Current year 1,500 1,800 2,500
Organic growth rate n/a 5.9% 4.2%
Consolidation data,
% of year –25% 100%
Reported revenue growth is 20.0% and 38.9% for Years 2 and 3, respectively, while organic revenue growth is only 5.9% and 4.2% for these same years.
The difference is due to the distortion caused by the acquistion of PaperExpo.
Chapter 10
Question 6
Since EBITA is less than EBITDA (EBITA = EBITDA – Depreciation), EBITA to interest will be less than EBITDA to interest.
If near-term bankruptcy is an issue, EBITDA can be used to meet interest obligations, and maintenance capital will
consequently fall to zero. Unless the company plans to wind down operations,
depreciation must eventually be reinvested to maintain operations. Therefore, EBITDA can be used to measure
survival only over the short term. Over the long term, EBITA is a better ratio.
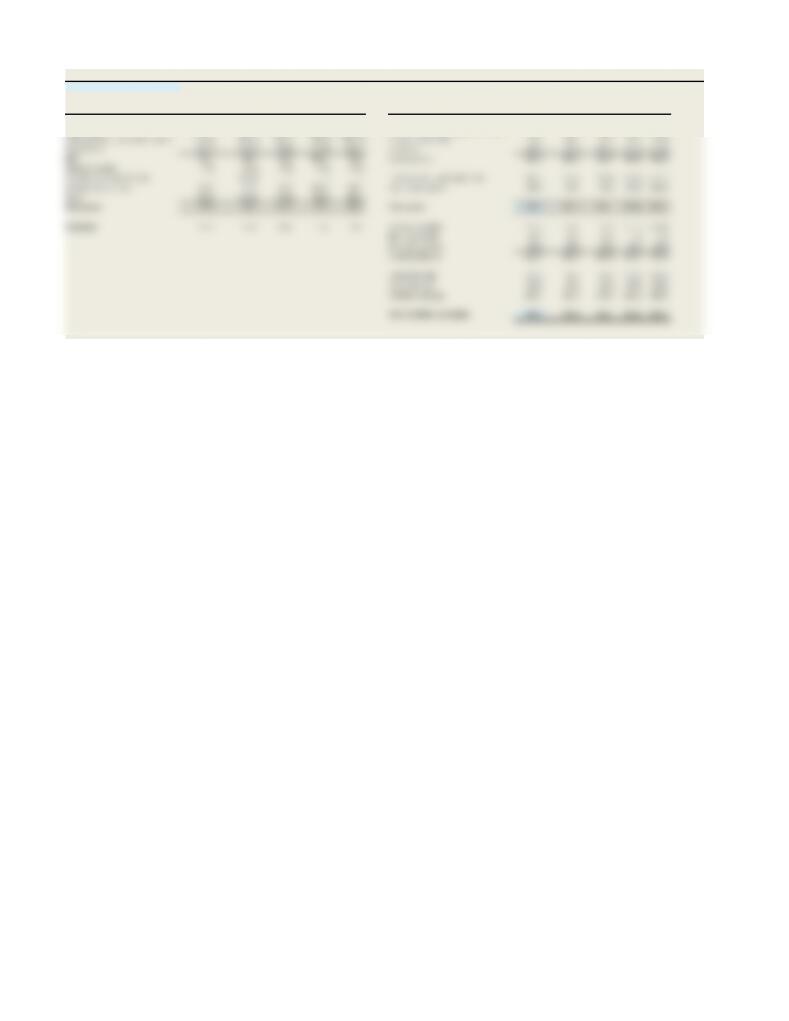
Exhibit 10.13 ShipCo: Income Statement and Balance Sheet
$ million
Income statement Year 1 Year 2 Year 3 Year 4 Year 5 Balance sheet Year 1 Year 2 Year 3 Year 4 Year 5
Revenues 530.0 556.5 601.0 661.1 674.3 Operating cash 10.6 11.1 12.0 13.2 13.5
Cost of sales (344.5) (364.5) (396.7) (439.6) (451.8) Excess cash and marketable securities 102.8 108.9 111.2 118.2 139.8
Selling, general, and administrative (79.5) (86.3) (87.1) (92.6) (107.9) Accounts receivable 79.5 80.7 93.2 99.2 97.8
Depreciation (15.9) (16.7) (18.0) (19.8) (20.2) Inventory 169.6 183.6 204.3 231.4 242.8
EBIT 90.1 89.0 99.2 109.1 94.4 Current assets 362.5 384.3 420.7 462.0 493.8
Interest expense (7.5) (7.5) (7.5) (7.5) (7.5)
Gain/(loss) on sale of assets – (10.0) – – – Property, plant, and equipment 206.7 219.8 240.4 267.8 276.5
Earnings before taxes 82.6 71.5 91.7 101.6 86.9 Equity investments 180.0 180.0 180.0 180.0 180.0
Taxes (24.8) (21.5) (27.5) (30.5) (26.1)
Net income 57.8 50.1 64.2 71.1 60.8 Total assets 749.2 784.2 841.1 909.8 950.3
Dividends 17.3 17.0 18.0 17.8 18.3 Accounts payable 116.6 119.6 126.2 135.5 134.9
Short–term debt 45.0 45.0 45.0 45.0 45.0
Accrued expenses 90.1 89.0 93.2 99.2 97.8
Current liabilities 251.7 253.7 264.4 279.7 277.6
Long–term debt 105.0 105.0 105.0 105.0 105.0
Common stock 100.0 100.0 100.0 100.0 100.0
Retained earnings 292.5 325.5 371.7 425.1 467.6
Total liabilities and equity 749.2 784.2 841.1 909.8 950.3
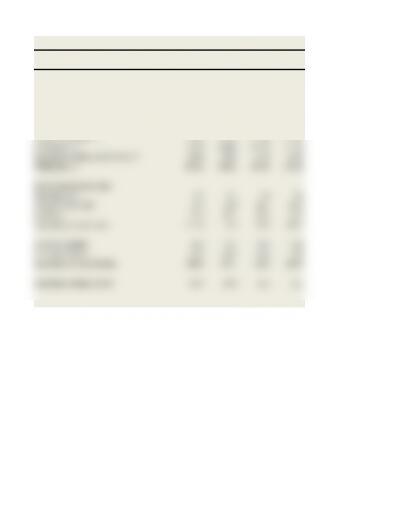
Exhibit 10.14 DefenseCo ROIC Decomposition
Year 2 Year 3 Year 4 Year 5
Operating metrics
ROIC, % 18.5% 18.2% 18.4% 18.3%
After-tax operating margin, % 7.1% 6.9% 7.0% 6.9%
Capital turns, times 2.62 2.65 2.63 2.64
Cost of sales/sales, % 73.0% 73.1% 72.8% 72.9%
SG&A/sales, % 14.4% 14.6% 14.7% 14.7%
Operating working capital/sales, % 3.1% 2.9% 3.1% 3.1%
PP&E/sales, % 35.1% 34.9% 34.9% 34.8%
Asset management, days
Operating cash 7.1 7.1 7.1 7.1
Accounts receivable 42.1 41.8 42.7 42.5
Inventory 92.3 91.6 91.8 92.6
Operating current assets 141.5 140.5 141.6 142.2
Accounts payable 70.2 70.1 70.4 71.1
Accrued expenses 60.0 60.0 59.8 59.8
Operating current liabilities 130.2 130.1 130.2 130.9
Operating working capital 11.3 10.4 11.3 11.3