
Chapter 9
Questions 1–3
Question 1
Ratio Company A Company B Company C
Return on assets 14.3% 13.0% 11.4%
Return on equity 15.8% 14.3% 21.8%
Return on invested capital 15.8% 15.8% 15.8%
Return on invested capital best measures operating performance, and by that measure, all three companies have the same operating performance.
Question 2
Company B’s ROA is lower than that of Company A because B has $50 million in equity investments but no corresponding income.
Companies that use the cost method to account for investments in other firms record income only when dividends are paid.
Therefore, profits will be underreported. This causes return on assets to be distorted downward.
Question 3
Company C’s return on equity outpaces the ROE for Company A because Company C uses leverage and A doesn’t. ROE is simply ROA multiplied by a leverage factor.
Leverage makes good operating results, measured by ROA, look great but can bankrupt companies with poor performance.
Chapter 9
Question 4
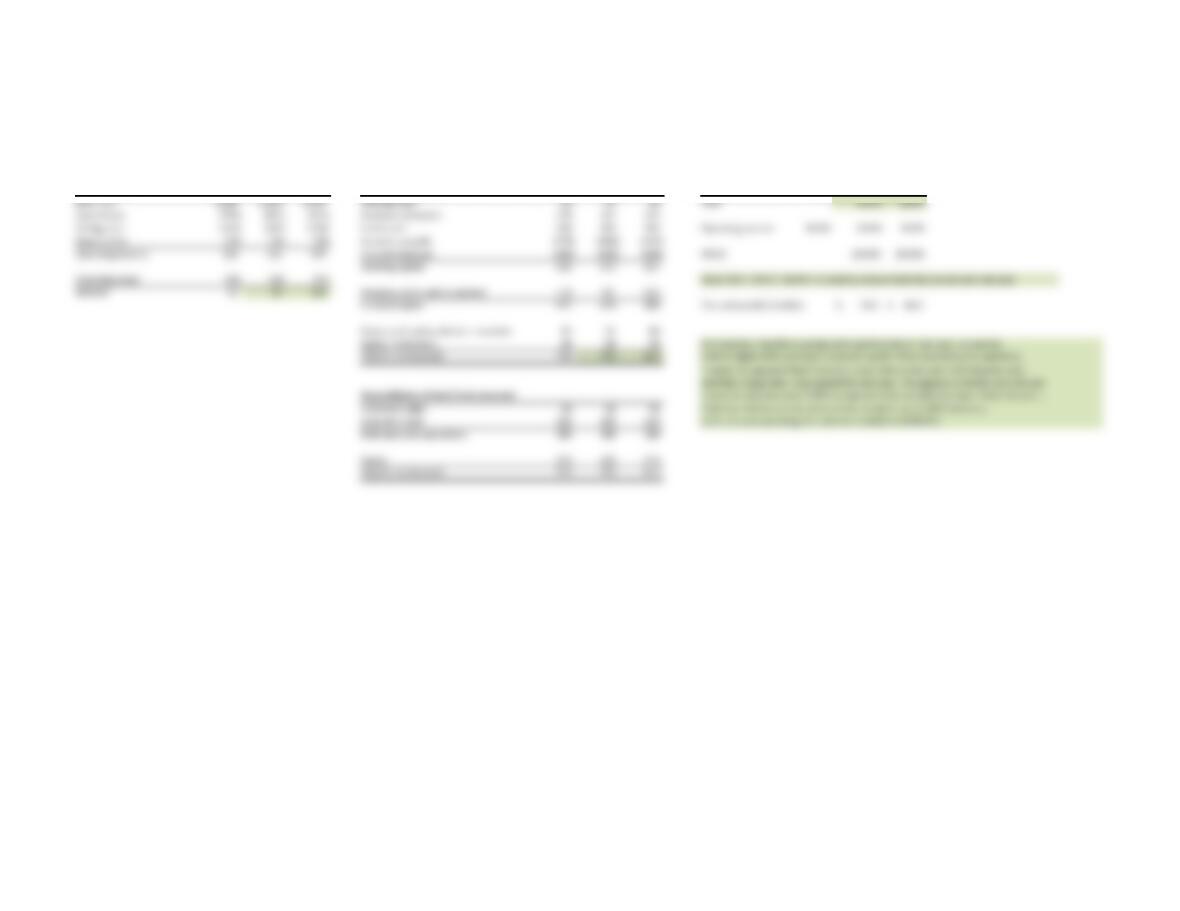
HealthCo: Reorganized financial statements HealthCo: Ratio analysis
$ million
Prior Current Next Prior Current Next Prior Current Next
NOPLAT year year year Total funds invested year year year Ratio year year year
Revenues 1,100 1,210 1,307 Working cash 22 24 26 ROIC 14.1% 16.8%
Cost of sales (770) (871) (915) Accounts receivable 220 242 261
Selling costs (165) (182) (196) Inventories 330 363 392 Operating tax rate 30.0% 30.0% 30.0%
Depreciation (33) (36) (39) Accounts payable (275) (303) (327)
Operating income 132 121 157 Accrued expenses (165) (182) (196) WACC 10.00% 10.00%
Working capital 132 145 157
Operating taxes (40) (36) (47) Since ROIC > WACC, the firm is creating value in both the current and next year.
NOPLAT 92 85 110 Property, plant, and equipment 440 484 523
Invested capital 572 629 680 Economic profit, $ million 24.6$ 44.3$
Excess cash and marketable securities 91 74 83
Equity investments 50 50 50 Commentary: HealthCo is projected to perform better next year, as seen by
Total funds invested 713 753 813 both its higher ROIC and higher economic profit. When examining the operating
income, it is apparent that there was a dip in the current year from the prior year,
and then a large rebound projected for next year. This appears to be the most obvious
Reconciliation of total funds invested reason for why next year’s ROIC is projected to be considerably higher than this year’s.
Short-term debt 90 90 90 (Note that the loss on sale of assets has no effect on the ROIC measure,
Long-term debt 210 210 210 as this is a nonoperating item and not included in NOPLAT.)
Debt and debt equivalents 300 300 300
Equity 413 453 513
Total funds invested 713 753 813
Chapter 9
Question 5
HealthCo: Cash flow available to investors
$ million
Current Next
year year
Revenues 1,210 1,307
Cost of sales (871) (915)
Selling costs (182) (196)
Depreciation (36) (39)
Operating income 121 157
Operating taxes (36) (47)
NOPLAT 85 110
Depreciation 36 39
Gross cash flow 121 149
Increase in working capital (13) (12)
Capital expenditures (80) (78)
Free cash flow 28 59

Chapter 9
Question 6
Commentary
Excess cash is not “invested” capital and is not necessary for core operations.
Including cash in the computation of ROIC will incorrectly depress the ROIC, as seen below.
Excess cash has returns less than what we would expect to come from the firm’s core operations.
Therefore, it should be analyzed and valued separately.
ROIC with and without excess cash, %Current Next
year year
ROIC excluding excess cash 14.1% 16.8%
ROIC including excess cash 12.4% 15.0%
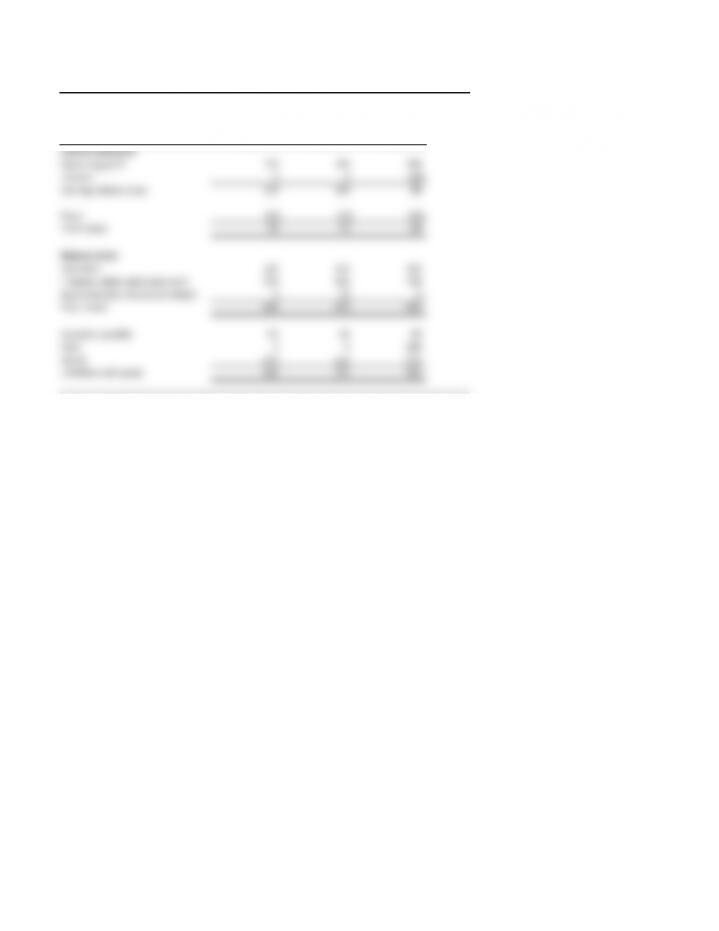
EXHIBIT 9.18 Ratio Analysis: Consolidated Financial Statements
$ million
Company A Company B Company C
Income statement
Operating profit 100 100 100
Interest 0 0 (20)
Earnings before taxes 100 100 80
Taxes (25) (25) (20)
Net income 75 75 60
Balance sheet
Inventory 125 125 125
Property, plant, and equipment 400 400 400
Equity investments (cost method) 0 50 0
Total assets 525 575 525
Accounts payable 50 50 50
Debt 0 0 200
Equity 475 525 275
Liabilities and equity 525 575 525
Exhibit Data:
Tax rate 25%
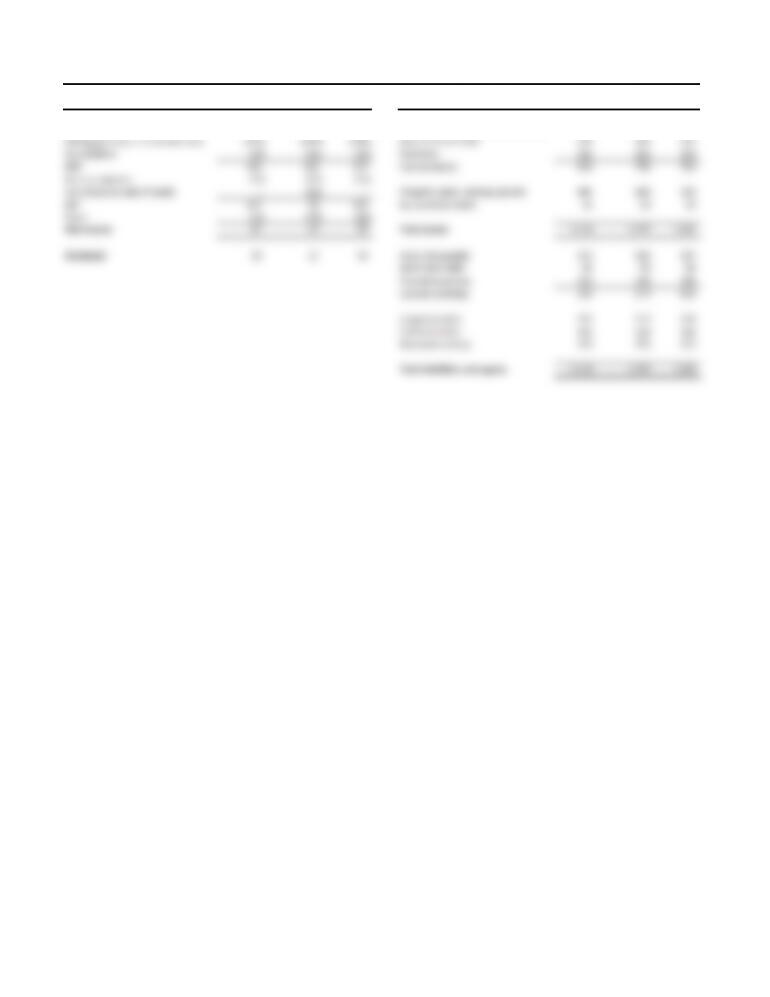
Exhibit 9.19 HealthCo: Income Statement and Balance Sheet
$ million
Income statement Last year Current year Next year Balance sheet Last year Current year Next year
Revenues 1,100 1,210 1,307 Operating cash 22 24 26
Cost of sales (770) (871) (915) Excess cash and marketable securities 91 74 83
Selling, general, and administrative (165) (182) (196) Accounts receivable 220 242 261
Depreciation (33) (36) (39) Inventory 330 363 392
EBIT 132 121 157 Current assets 663 703 763
Interest expense (15) (15) (15)
Gain/(loss) on sale of assets – (10) – Property, plant, and equipment 440 484 523
EBT 117 96 142 Equity investments 50 50 50
Taxes (35) (29) (43)
Net income 82 67 99 Total assets 1,153 1,237 1,336
Dividends 33 27 40 Accounts payable 275 303 327
Short–term debt 90 90 90
Accrued expenses 165 182 196
Current liabilities 530 574 613
Long-term debt 210 210 210
Common stock 100 100 100
Retained earnings 313 353 413
Total liabilities and equity 1,153 1,237 1,336