Chapter 8
Question 1
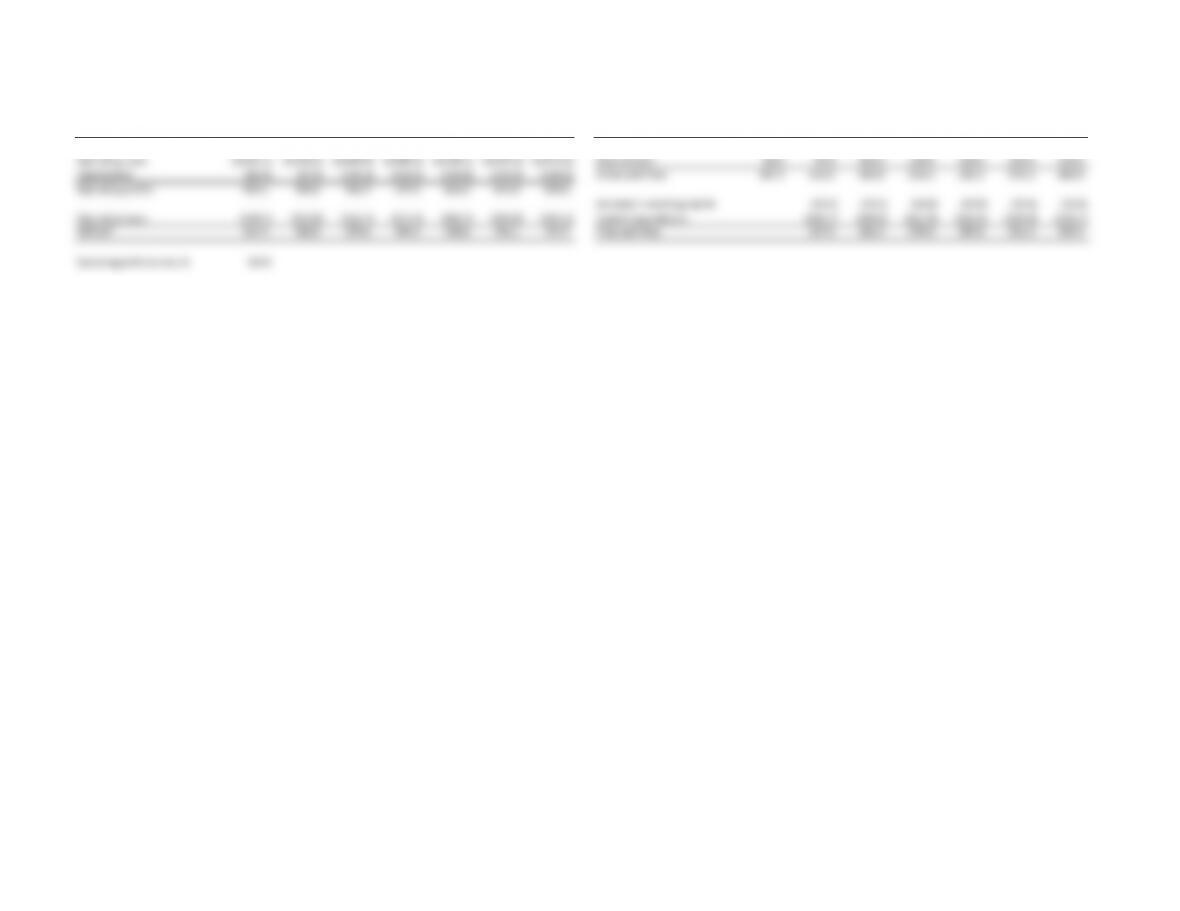
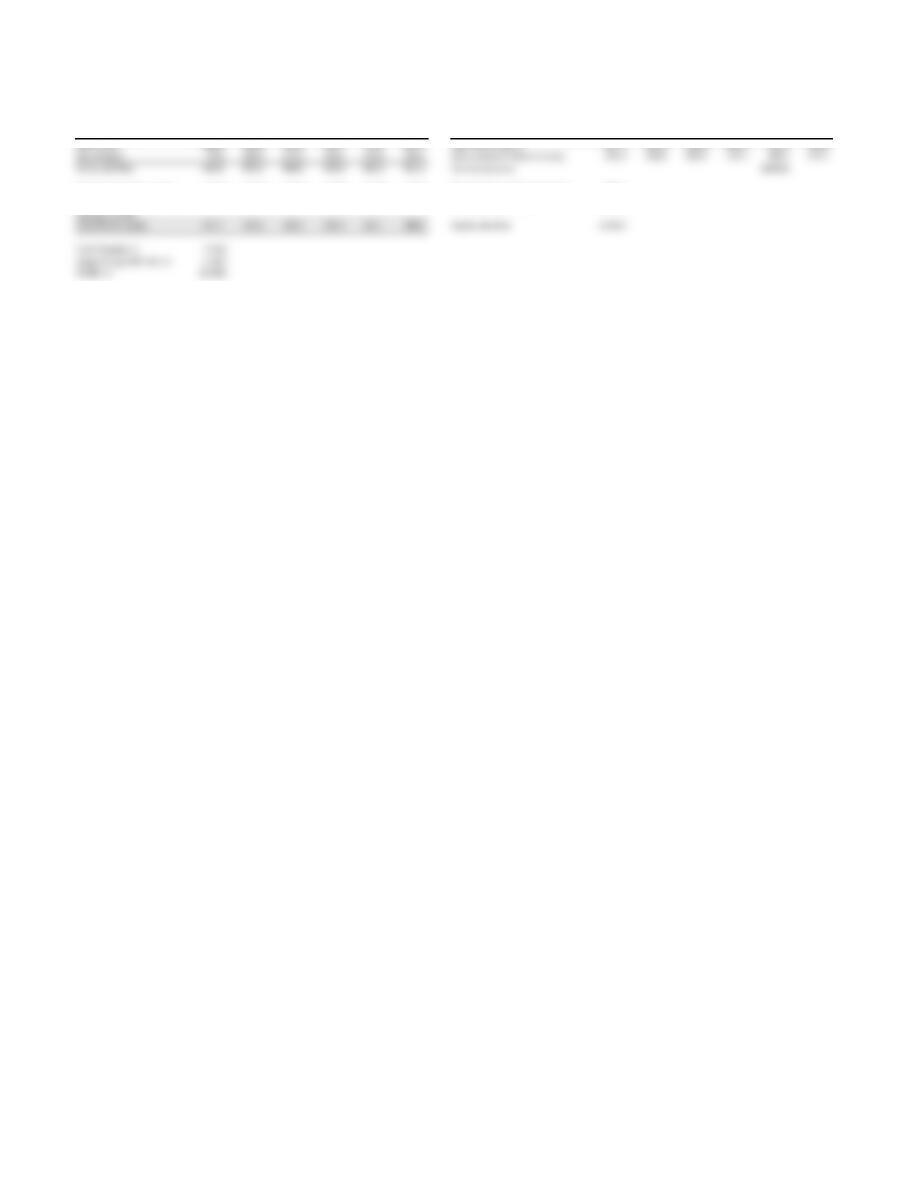
NOPLAT, $ million Today Year 1 Year 2 Year 3 Year 4 Year 5 Year 6 Free cash flow, $ million Today Year 1 Year 2 Year 3 Year 4 Year 5 Year 6
Revenues 3,777.1 4,041.5 4,304.2 4,583.9 4,859.0 5,126.2 5,382.5 NOPLAT 314.4 356.5 379.6 404.3 428.6 452.1 474.7
Operating costs (3,245.1) (3,435.2) (3,658.5) (3,896.3) (4,130.1) (4,357.3) (4,575.1) Depreciation 82.9 97.0 103.3 110.0 116.6 123.0 129.2
Depreciation (82.9) (97.0) (103.3) (110.0) (116.6) (123.0) (129.2) Gross cash flow 397.3 453.5 482.9 514.3 545.2 575.2 603.9
Operating profits 449.1 509.2 542.3 577.6 612.2 645.9 678.2
Increase in working capital (13.2) (13.1) (14.0) (13.8) (13.4) (12.8)
Operating taxes (134.7) (152.8) (162.7) (173.3) (183.7) (193.8) (203.5) Capital expenditures (202.7) (208.4) (221.9) (226.6) (229.9) (231.7)
NOPLAT 314.4 356.5 379.6 404.3 428.6 452.1 474.7 Free cash flow 237.5 261.4 278.4 304.8 331.9 359.4
Operating profit tax rate, % 30.0%
Chapter 8
Question 2
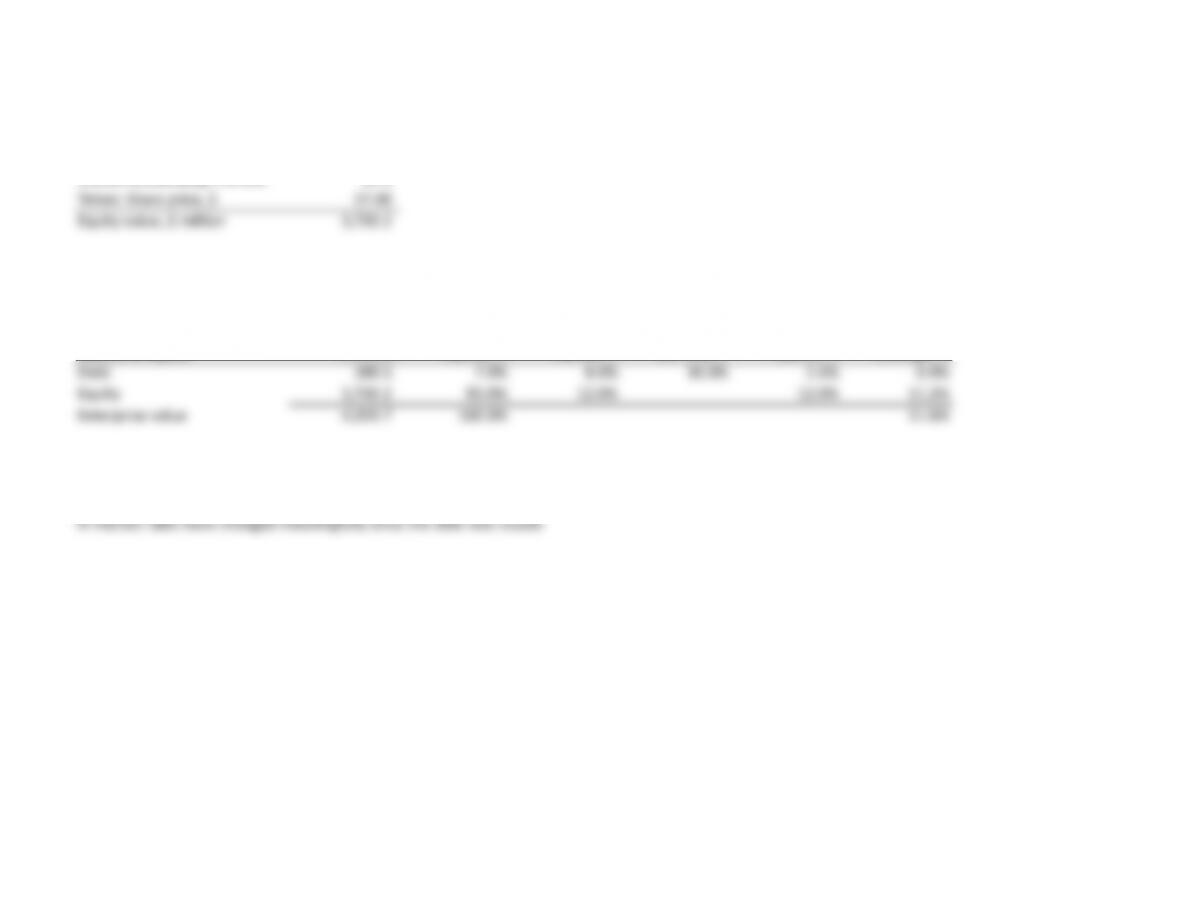
Equity value
Shares outstanding, millions 65.6
Times: Share price, $ 57.00
Equity value, $ million 3,739.2
Weighted average cost of capital
Proportion After-tax Contribution
Market value, of total Cost of Marginal cost of to weighted
Source of capital $ million capital, %capital, %tax rate, %capital, %average, %
Debt 280.5 7.0% 8.0% 30.0% 5.6% 0.4%
Equity 3,739.2 93.0% 12.0% 12.0% 11.2%
Enterprise value 4,019.7 100.0% 11.6%
The market value of debt will not equal book value if the company is distressed (i.e., the probability of default is meaningful) or
if interest rates have changed meaningfully since the debt was issued.
Chapter 8
Questions 3 & 4
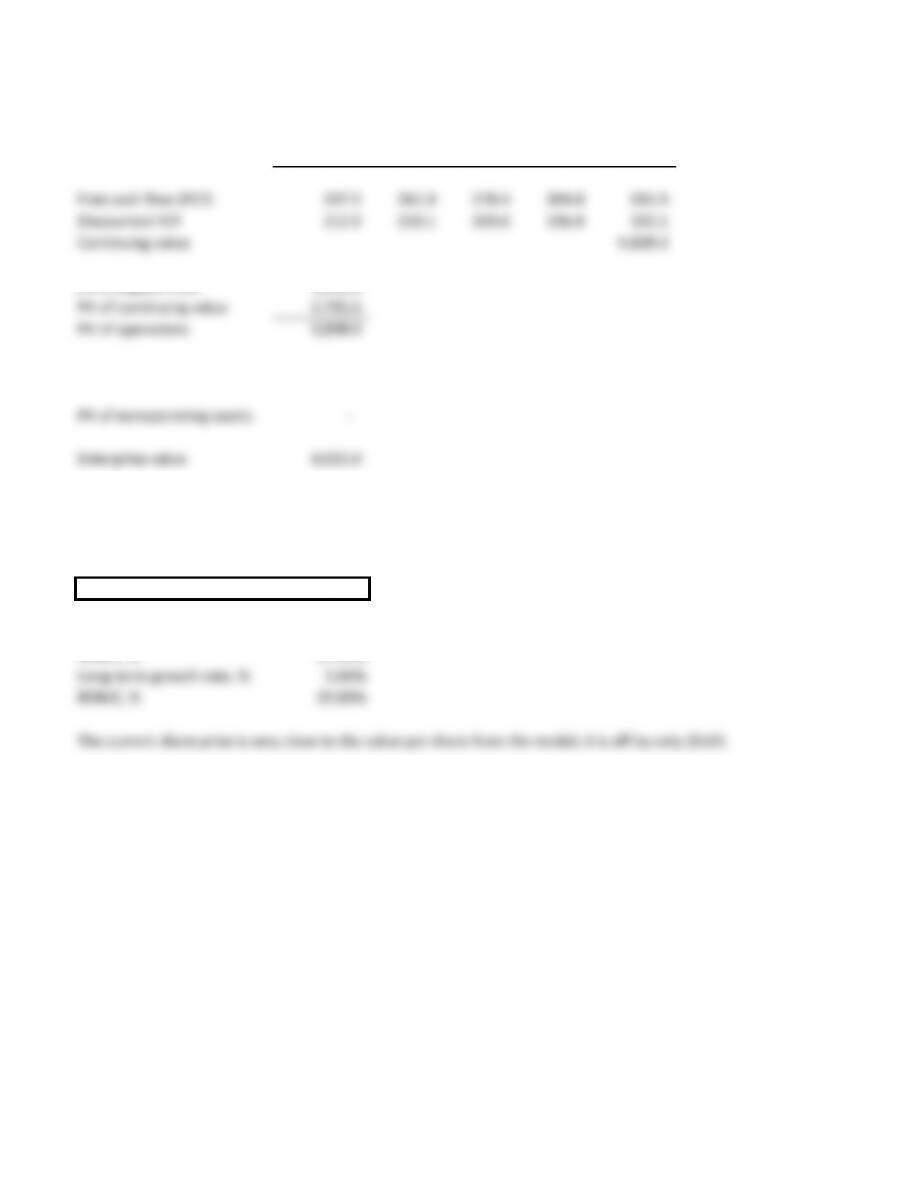
$ million Year
1 2 3 4 5
Free cash flow (FCF) 237.5 261.4 278.4 304.8 331.9
Discounted FCF 212.9 210.1 200.6 196.8 192.1
Continuing value 4,829.3
PV of explicit FCFs 1,012.5
PV of continuing value 2,795.6
PV of operations 3,808.0
Midyear adjustment 4,022.0
PV of nonoperating assets –
Enterprise value 4,022.0
Debt 280.5
Equity value 3,741.5
Value per share, $57.03
WACC, % 11.55%
Long-term growth rate, % 5.00%
RONIC, % 15.00%
The current share price is very close to the value per share from the model; it is off by only $0.03.
Chapter 8
Questions 5 & 6
Question 5
The three components needed to calculate economic profit are NOPLAT, invested capital, and WACC.
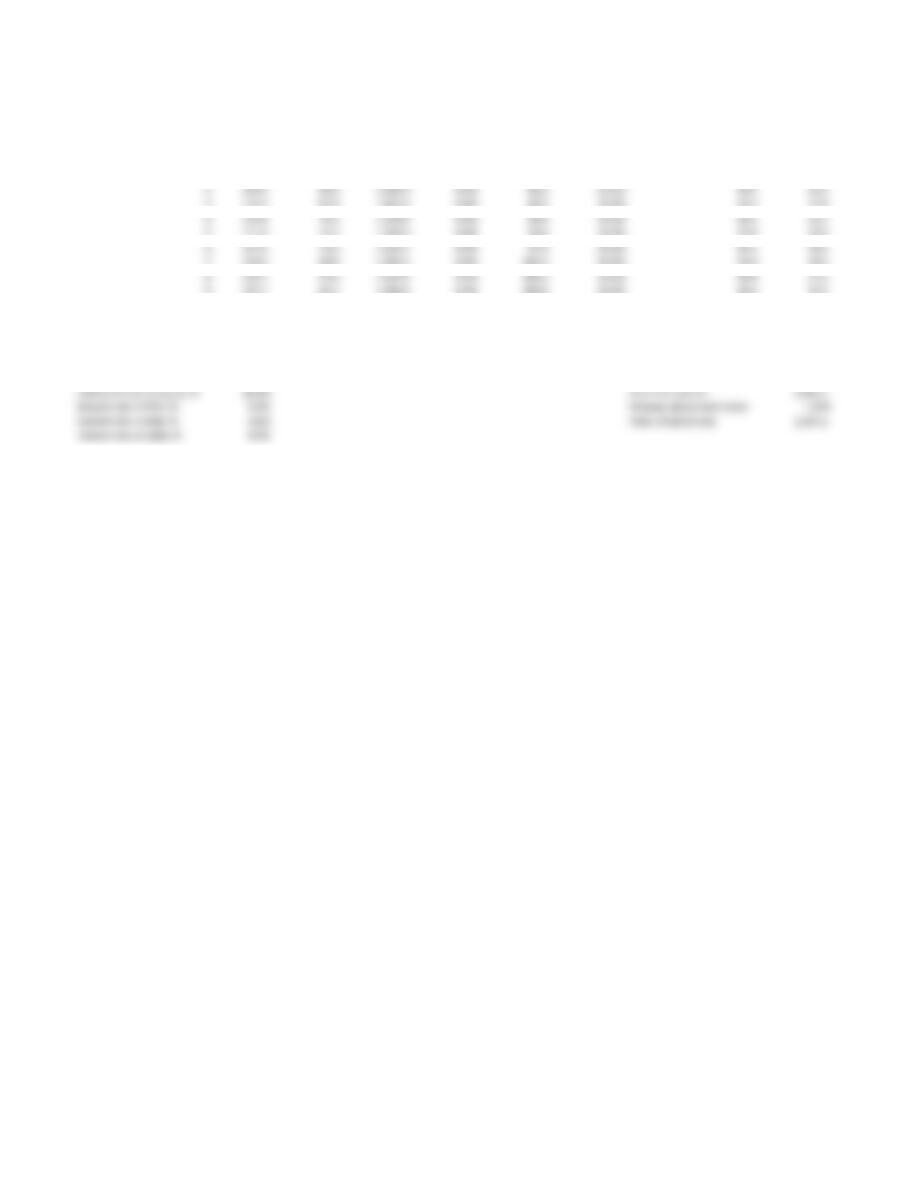
Economic profit Economic-profit valuation
$ million $ million
Year 1 Year 2 Year 3 Year 4 Year 5 Year 6 PV (economic profit) 1 2 3 4 5 6
Operating profit 509.2 542.3 577.6 612.2 645.9 678.2 Economic profit (EP) 160.1 169.5 180.5 190.2 199.5 208.2
Operating taxes (152.8) (162.7) (173.3) (183.7) (193.8) (203.5) Discounted EP 143.5 136.2 130.0 122.8 115.5 108.0
NOPLAT 356.5 379.6 404.3 428.6 452.1 474.7 Continuing value of EP 2,522.5
Invested capital beg yr 1,699.7 1,818.7 1,936.9 2,062.8 2,186.5 2,306.8 Enterprise value
Times: Cost of capital, % 11.6% 11.6% 11.6% 11.6% 11.6% 11.6% PV of economic profit 648.1
Capital charge 196.4 210.1 223.8 238.3 252.6 266.5 PV of continuing value 1,460.2
Invested capital today 1,699.7
Economic profit 160.1 169.5 180.5 190.2 199.5 208.2 PV of operations 3,808.0
Midyear adjustment 4,022.0
WACC, % 11.55% PV of nonoperating assets –
Long-term growth rate, % 5.00%
RONIC, % 15.00% Enterprise value 4,022.0
Debt 280.5
Equity value 3,741.5
Value per share, $57.03
Question 6
Comparing enterprise value in Question 6 with that of Question 4 shows that the two values are identical, as they should be.
Chapter 8
Question 7
Cash flow to equity Direct equity valuation
$ million Year 1 Year 2 Year 3 Year 4 Year 5 Year 6 $ million 1 2 3 4 5 6
Net income 346.6 369.8 394.5 418.7 442.3 464.9 Cash flow to equity 227.7 251.6 268.6 295.0 322.1 349.6
Depreciation 97.0 103.3 110.0 116.6 123.0 129.2 Discounted cash flow to equity 203.3 200.6 191.2 187.5 182.7 177.1
Gross cash flow 443.6 473.1 504.5 535.4 565.3 594.1 Continuing value 4,993.8
Increase in working capital (13.2) (13.1) (14.0) (13.8) (13.4) (12.8) PV of explicit cash flow to equity 965.2
Capital expenditures (202.7) (208.4) (221.9) (226.6) (229.9) (231.7) PV of continuing value 2,833.6
Increase in debt – – – – – –
Cash flow to equity 227.7 251.6 268.6 295.0 322.1 349.6 Equity valuation 3,798.9
Cost of equity, % 12.0%
Long-term growth rate, % 5.00%
RONIC, % 15.00%
Chapter 8
Question 7
$ million
Discounted Prior-year Interest Interest Marginal Interest Discounted
Forecast year FCF FCF debt rate, %payment tax rate, %tax shield (ITS) ITS
1 100.0 90.9 1,000.0 8.0% 80.0 35.0% 28.0 25.5
2 105.0 86.8 1,040.0 8.0% 83.2 35.0% 29.1 24.1
3 110.3 82.8 1,081.6 8.0% 86.5 35.0% 30.3 22.8
4 115.8 79.1 1,124.9 8.0% 90.0 35.0% 31.5 21.5
5 121.6 75.5 1,169.9 8.0% 93.6 35.0% 32.8 20.3
6 127.6 72.0 1,216.7 8.0% 97.3 35.0% 34.1 19.2
7 134.0 68.8 1,265.3 8.0% 101.2 35.0% 35.4 18.2
8 140.7 65.6 1,315.9 8.0% 105.3 35.0% 36.8 17.2
9 147.7 62.7 1,368.6 8.0% 109.5 35.0% 38.3 16.3
10 155.1 59.8 1,423.3 8.0% 113.9 35.0% 39.9 15.4
Continuing value 3,257.8 1,256.0 1,480.2 8.0% 118.4 35.0% 690.8 266.3
Sum of discounted FCFs 2,000.0 Sum of discounted ITSs 466.7
Marginal tax rate, % 35.0%
Unlevered cost of equity, % 10.0% PV of FCF and ITS 2,466.7
Growth rate in FCFs, % 5.0% Midyear adjustment factor 1.049
Growth rate in debt, % 4.0% Value of operations 2,587.1
Interest rate on debt, % 8.0%
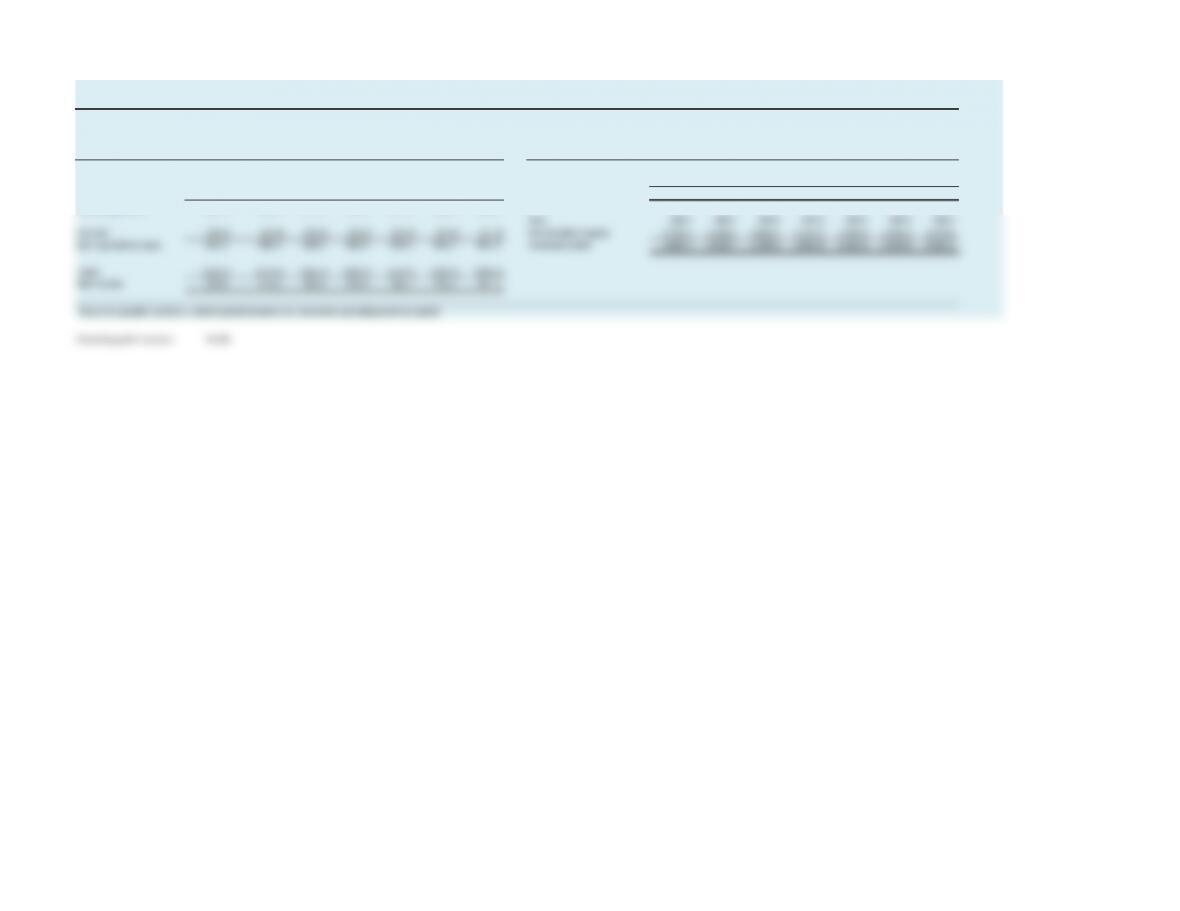
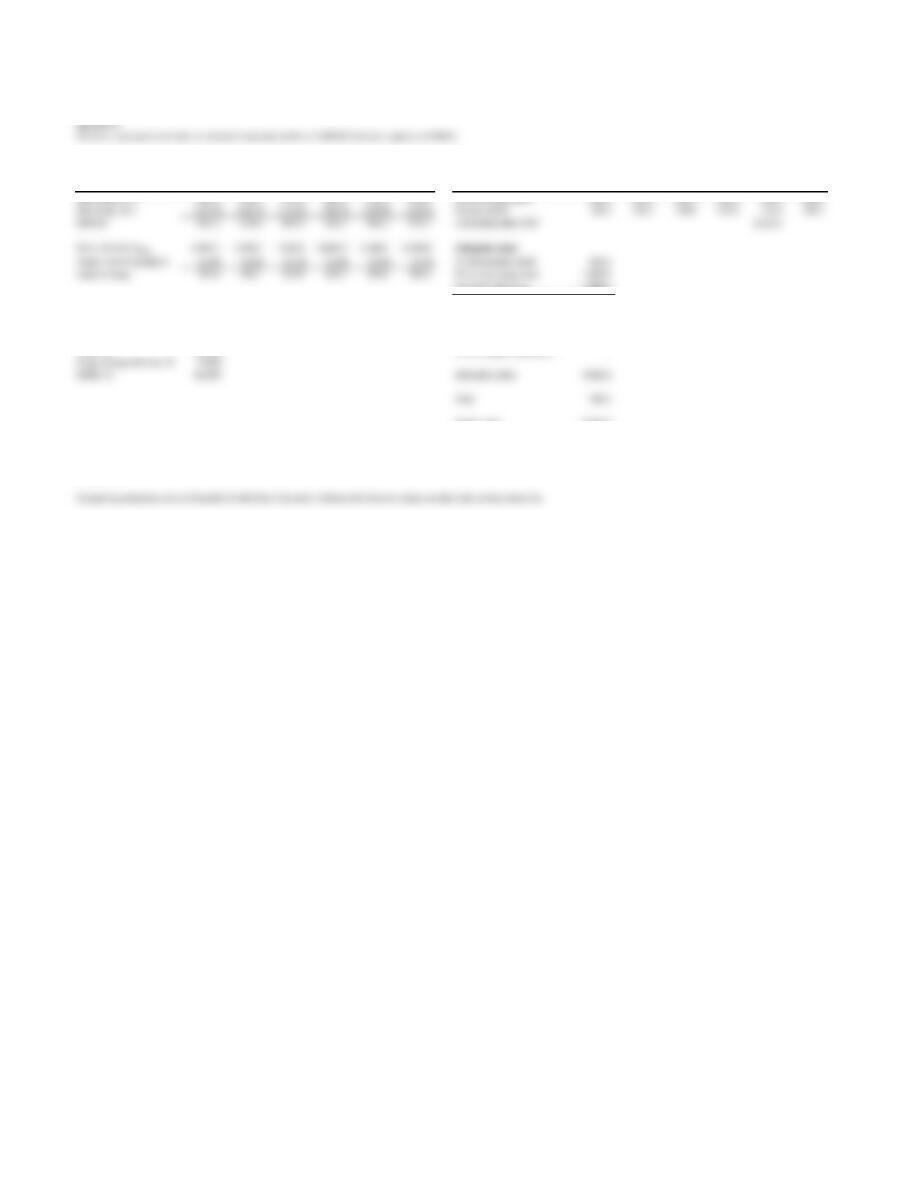
EXHIBIT 8.18 BrandCo: Income Statement and Reorganized Balance Sheet
$ million
Income statement Today Year 1 Year 2 Year 3 Year 4 Year 5 Year 6 Reorganized balance sheet Today Year 1 Year 2 Year 3 Year 4 Year 5 Year 6
Revenues 3,777.1 4,041.5 4,304.2 4,583.9 4,859.0 5,126.2 5,382.5
Operating working capital1188.9 202.1 215.2 229.2 242.9 256.3 269.1
Operating costs (3,245.1) (3,435.2) (3,658.5) (3,896.3) (4,130.1) (4,357.3) (4,575.1) Property and equipment 1,510.8 1,616.6 1,721.7 1,833.6 1,943.6 2,050.5 2,153.0
Depreciation (82.9) (97.0) (103.3) (110.0) (116.6) (123.0) (129.2) Invested capital 1,699.7 1,818.7 1,936.9 2,062.8 2,186.5 2,306.8 2,422.1
Operating profits 449.1 509.2 542.3 577.6 612.2 645.9 678.2
Debt 280.5 280.5 280.5 280.5 280.5 280.5 280.5
Interest (14.0) (14.0) (14.0) (14.0) (14.0) (14.0) (14.0) Shareholders’ equity 1,419.2 1,538.2 1,656.4 1,782.3 1,906.0 2,026.3 2,141.6
Earnings before taxes 435.1 495.2 528.3 563.5 598.2 631.9 664.2 Invested capital 1,699.7 1,818.7 1,936.9 2,062.8 2,186.5 2,306.8 2,422.1
Taxes (130.5) (148.6) (158.5) (169.1) (179.5) (189.6) (199.2)
Net income 304.6 346.6 369.8 394.5 418.7 442.3 464.9
1Accounts payable has been netted against inventory to determine operating working capital.
Operating-profit tax rate 30.0%
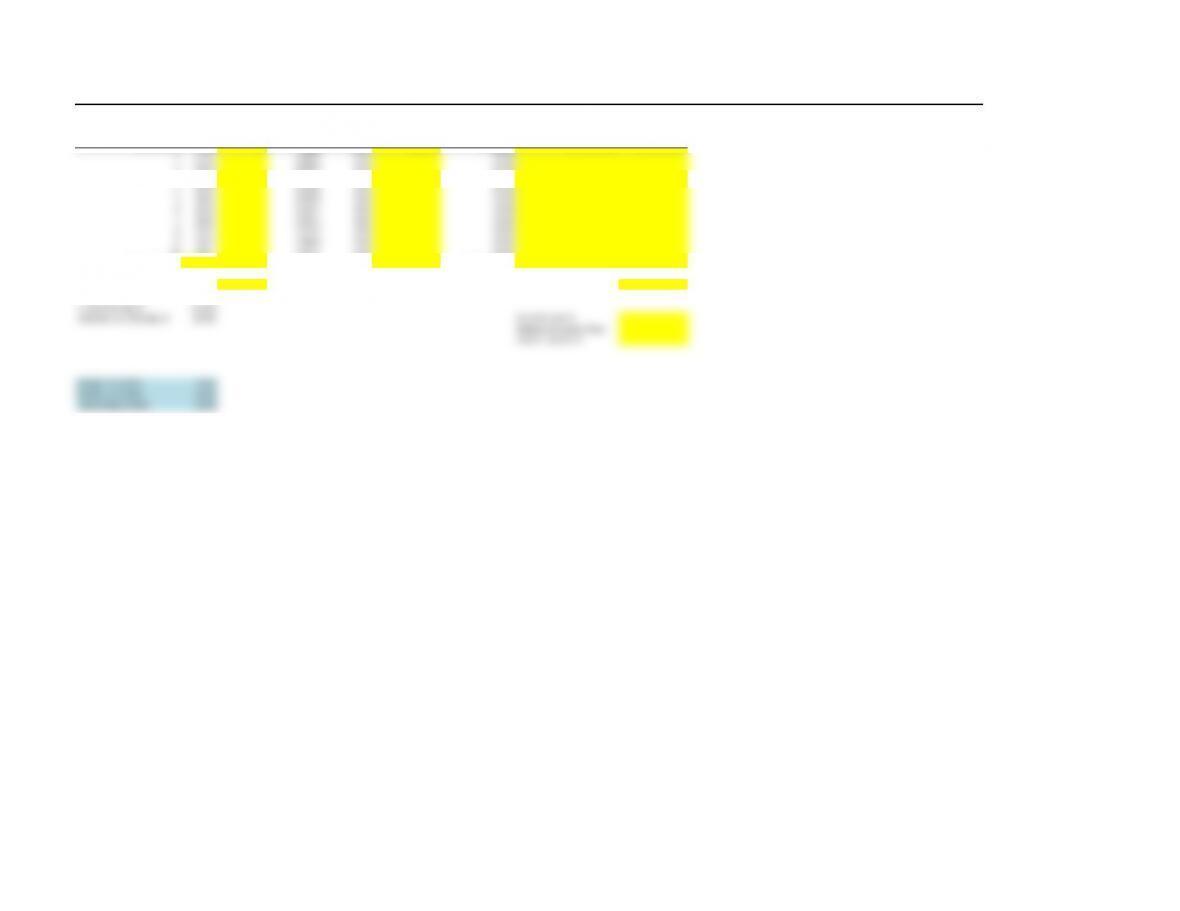
EXHIBIT 8.18 VidCo: Key Financial Figures
$ million
Discounted Prior-year Interest Interest Marginal Interest
Forecast year FCF FCF debt rate, %payment tax rate, %tax shield (ITS) Discounted ITS
1 100.0 1,000.0 8.0% 35.0%
2 105.0 1,040.0 8.0% 35.0%
3 110.3 1,081.6 8.0% 35.0%
4 115.8 1,124.9 8.0% 35.0%
5 121.6 1,169.9 8.0% 35.0%
6 127.6 1,216.7 8.0% 35.0%
7 134.0 1,265.3 8.0% 35.0%
8 140.7 1,315.9 8.0% 35.0%
9 147.7 1,368.6 8.0% 35.0%
10 155.1 1,423.3 8.0% 35.0%
Continuing value 1,480.2 8.0% Continuing value
Sum of discounted FCFs Sum of discounted ITSs
Marginal tax rate, % 35.00%
Unlevered cost of equity, % 10.00% PV of FCF and ITS
Midyear adjustment factor
Value of operations
Growth rate in FCFs 5.00%
Growth rate in Debt 4.00%
Interest Rate on Debt 8.00%