Unlock document.
This document is partially blurred.
Unlock all pages and 1 million more documents.
Get Access
Chapter 17
Question 1
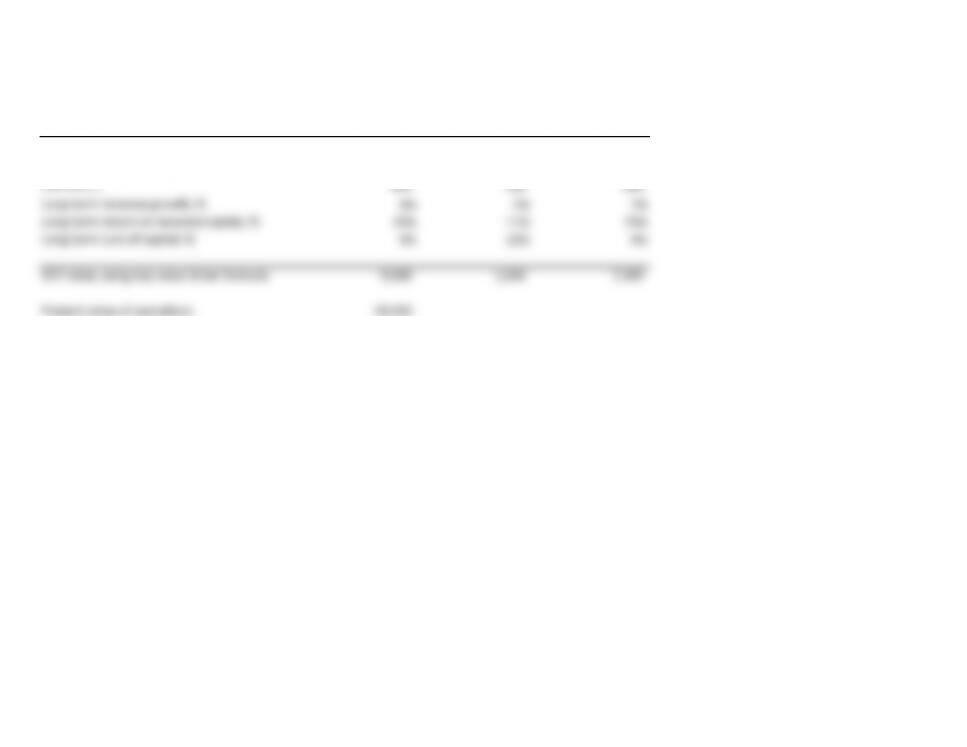
$ million Branded cereals Generic cereals Healthy breakfast
Market data
Revenuet+1 2,000 1,500 500
NOPLATt+1 600 150 200
Long-term revenue growth, % 4% 5% 7%
Long-term return on invested capital, % 20% 11% 25%
Long-term cost of capital, % 9% 10% 9%
DCF value, using key value driver formula 9,600 1,636 7,200
Present value of operations 18,436
This sum-of-the-parts analysis allows one to see that despite being 25 percent of the size of the branded-cereal division, the healthy-breakfast
division's value is 75 percent of the branded-cereal division's value. This is due to both high ROIC and high growth for the healthy-breakfast division.
Interestingly, the generic-cereal division's value is less than 10 percent of the overall firm value, despite contributing 38 percent of firm revenues.
Note that this is due to the relatively low ROIC for this division.
Chapter 17
Question 2
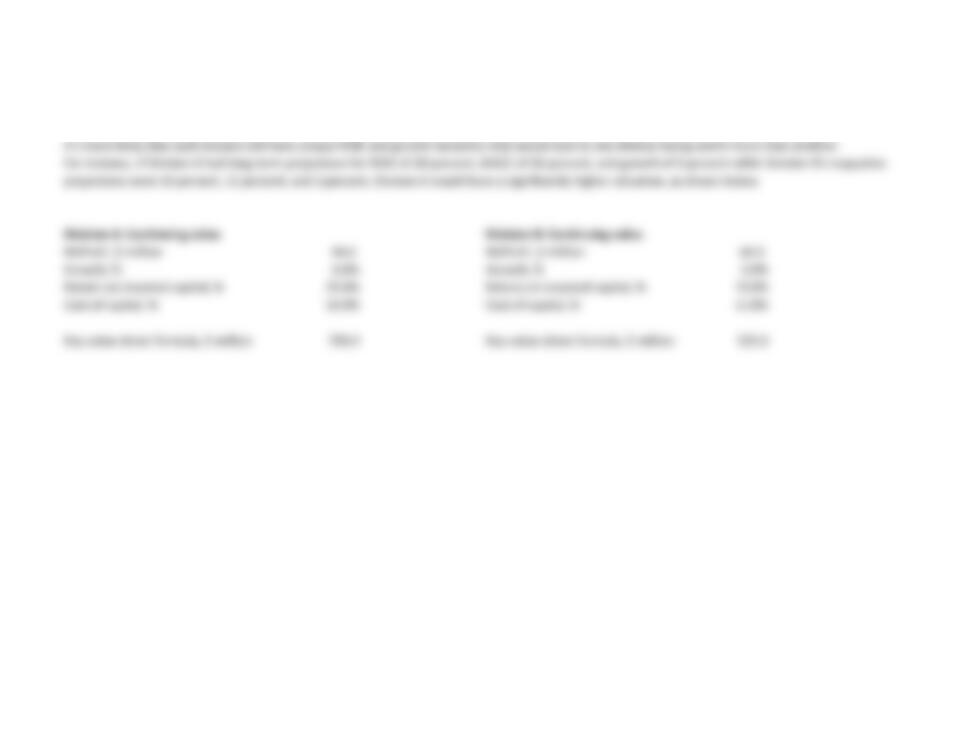
This is not an appropriate technique to use unless the ROIC and growth projections for the three divisions are all the same. This is quite unlikely.
It's more likely that each division will have unique ROIC and growth dynamics that would lead to one division being worth more than another.
For instance, if Division A had long-term projections for ROIC of 20 percent, WACC of 10 percent, and growth of 6 percent while Division B's respective
projections were 10 percent, 11 percent, and 3 percent, Division A would have a significantly higher valuation, as shown below.
Division A: Continuing value Division B: Continuing value
NOPLAT, $ million 40.0 NOPLAT, $ million 60.0
Growth, % 6.0% Growth, % 3.0%
Return on invested capital, % 20.0% Return on invested capital, % 10.0%
Cost of capital, % 10.0% Cost of capital, % 11.0%
Key value driver formula, $ million 700.0 Key value driver formula, $ million 525.0
Chapter 17
Question 3
This is not an appropriate technique to use unless the ROIC and growth projections for the three divisions are all the same. This is quite unlikely.
Funds should be allocated based on the ROIC and growth projections. For instance, if one of the divisions has an ROIC significantly above its WACC,
then this division should receive a greater balance of the funds (assuming that these funds can be put to use at the relatively high ROIC level).
Chapter 17
Question 4
Corporate overhead costs should be allocated to individual divisions if the costs are not related to the operations of that division. For instance, top-
management salaries are part of the costs of the overall firm, while divisional-management salaries are part of the operating costs of that particular division.
Top-management salaries should not be allocated to individual divisions, but should remain at the corporate cost center. An example of a corporate cost
that should be allocated is the human resources costs, as these are needed to service the employees within a division. The human resources costs
could be allocated based on the percentage of employees working in each division.
Chapter 17
Questions 5 and 6
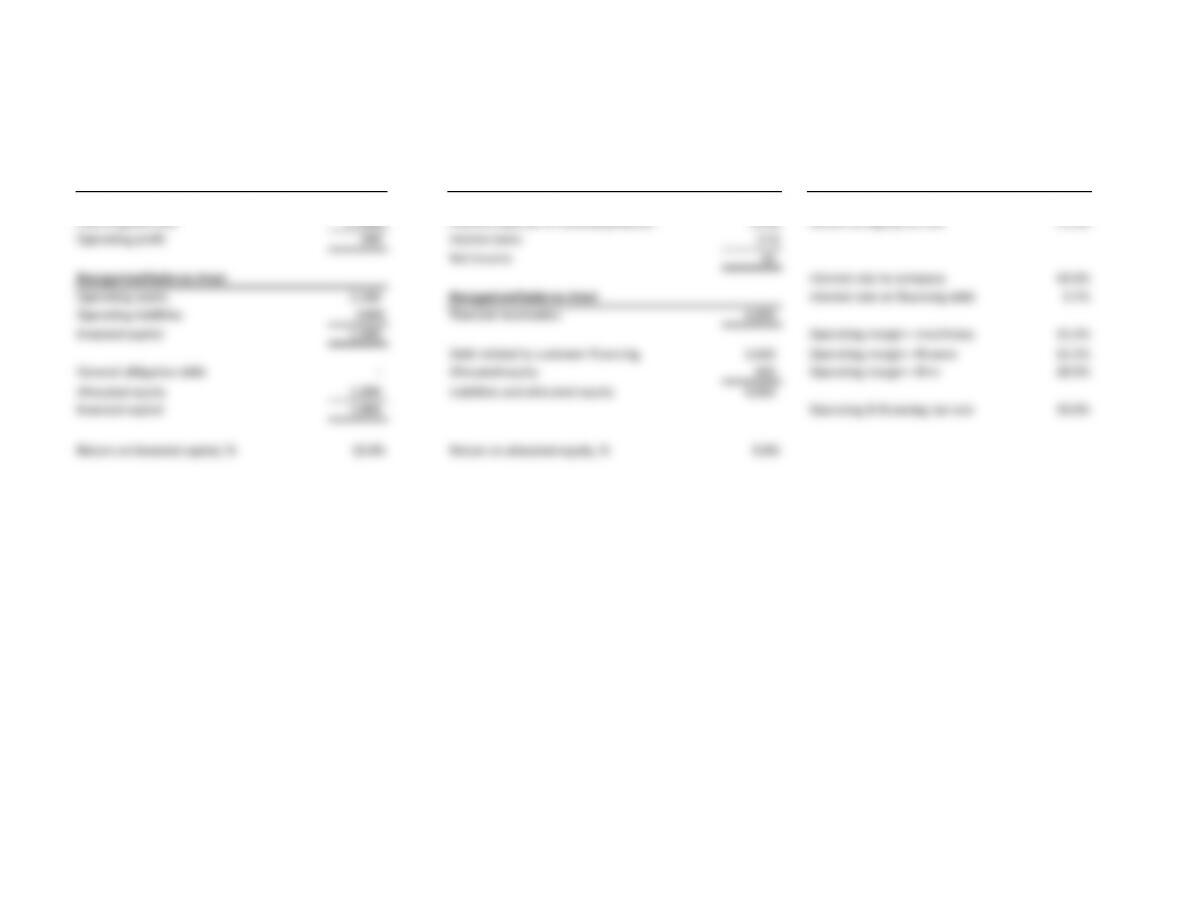
Manufacturing subsidiary
Customer financing subsidiary
$ million $ million
Operating profit Net income
Key statistics, %
Sales of machinery 1,500 Revenues of financial products 400 Return on invested capital for firm 6.6%
Cost of goods sold (1,000) Interest expense of financial products (350) Return on equity for firm 15.0%
Operating profit 500 Income taxes (15)
Net income 35
Reorganized balance sheet Interest rate to company 10.0%
Operating assets 2,200 Reorganized balance sheet Interest rate on financing debt 9.7%
Operating liabilities (400) Financial receivables 4,000
Invested capital 1,800 Operating margin—machinery 33.3%
Debt related to customer financing 3,600 Operating margin—finance 12.5%
General obligation debt - Allocated equity 400 Operating margin—firm 28.9%
Allocated equity 1,800 Liabilities and allocated equity 4,000
Invested capital 1,800 Operating & financing tax rate 30.0%
Return on invested capital, % 19.4% Return on allocated equity, % 8.8%
Question 6
ATVCo's financing subsidiary should be evaluated as a stand-alone entity. Since the subsidiary is owned by a company with other
assets (the manufacturing business), ATVCo could use the manufacturing business as collateral for the finance subsidiary's debt.
In the extreme, a lender could lend 100 percent of financial receivables as long as additional collateral is pledged, causing
allocated equity to equal zero. A pure-play bank could never raise 100 percent debt. In this case, ATVCo's equity is understated,
and ROE is too high.
Chapter 17
Question 7
Two best practices are (1) to eliminate outliers and use medians of "close" peers and (2) to use NOPLAT instead of using EBITA.
The former is considered a best practice because outliers or "strong" peers can skew the results. The latter is considered a best
practice because EBITA multiples can be distorted by tax differences across companies.
Chapter 17
Question 8
One needs to be careful in jumping to the conclusion in the statement. First, oftentimes the valuation done using the sum-of-the-parts methodology
is done incorrectly. It's quite common for analysts to value divisions based on top-peer multiples rather than multiples for close peers. Second, the academic
evidence on whether or not a conglomerate firm trades at a discount relative to the sum of the parts is mixed.
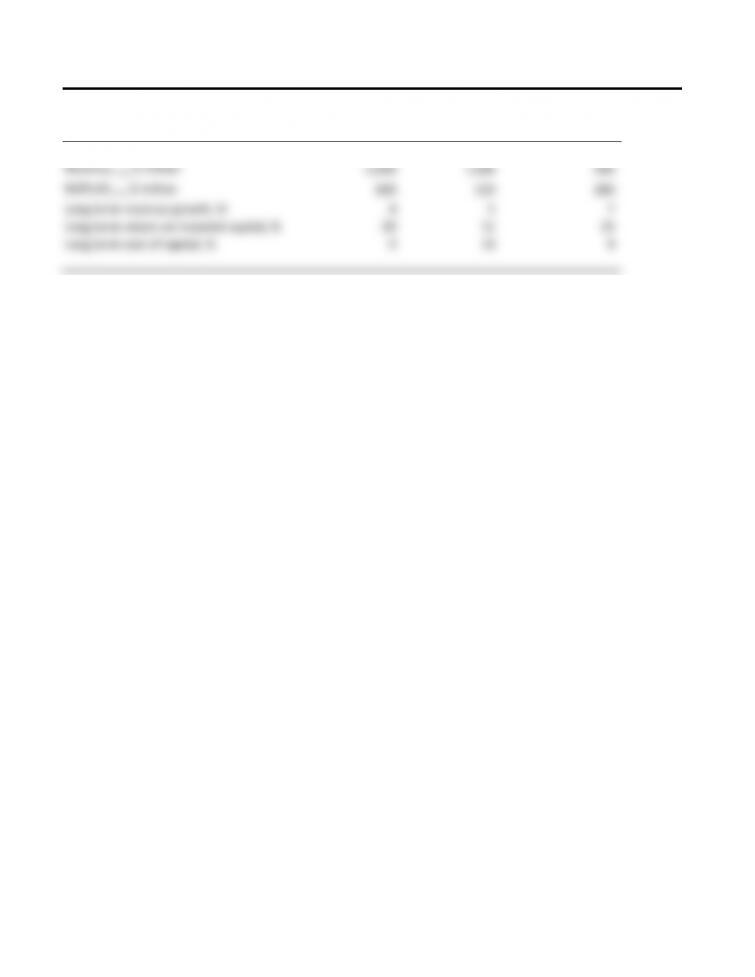
EXHIBIT 17.10 BreakfastCo: Selected Financial Division Data
Branded cereals Generic cereals Healthy breakfast
Market data
Revenuet+1, $ million 2,000 1,500 500
NOPLATt+1, $ million 600 150 200
Long term revenue growth, % 4 5 7
Long term return on invested capital, % 20 11 25
Long term cost of capital, % 9 10 9
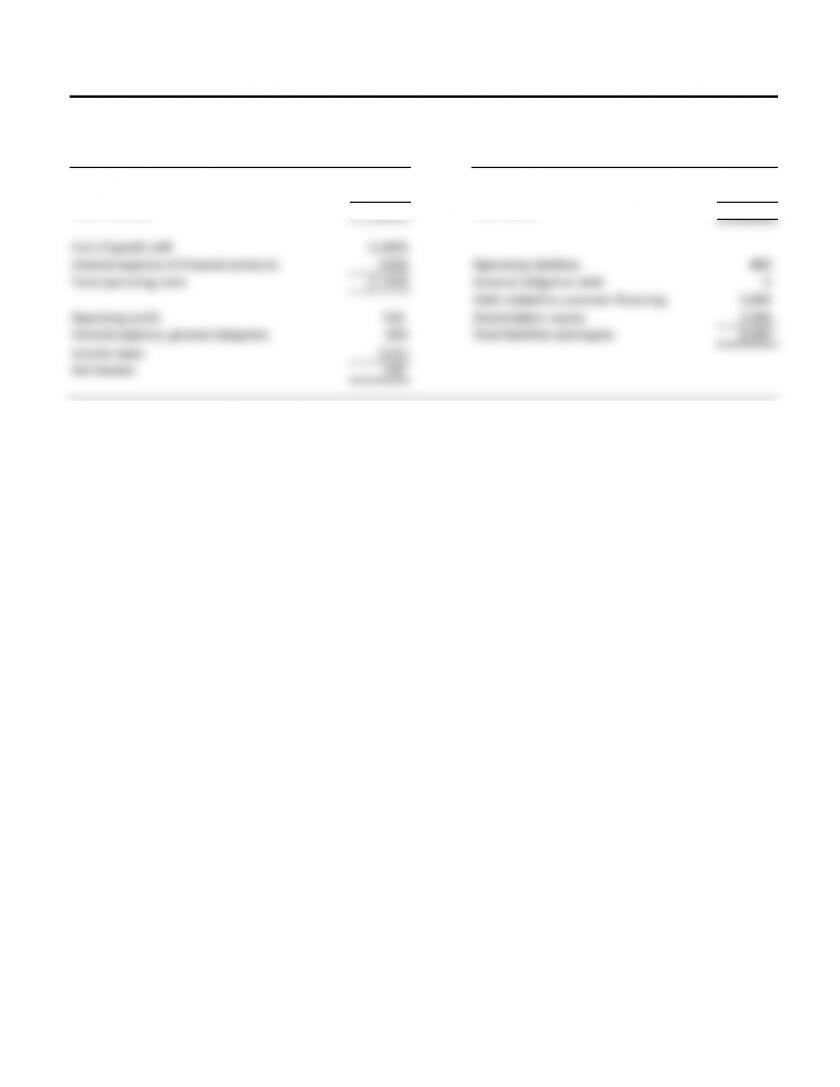
EXHIBIT 17.11 ATVCo: Income Statement and Balance Sheet
$ million
Income statement Balance sheet
Sales of machinery 1,500 Operating assets 2,200
Revenues of financial products 400 Financial receivables 4,000
Total revenues 1,900 Total assets 6,200
Cost of goods sold (1,000)
Interest expense of financial products (350) Operating liabilities 400
Total operating costs (1,350) General obligation debt 0
Debt related to customer financing 3,600
Operating profit 550 Stockholders' equity 2,200
Interest expense, general obligation (80) Total liabilities and equity 6,200
Income taxes (141)
Net income 329


