
Core Concepts of Accounting Information Systems, 13th Edition, by Simkin, Rose, and Norman
SM 5.1
Chapter 5
DOCUMENTING ACCOUNTING INFORMATION SYSTEMS
Discussion Questions
5-1. The chapter provides ten reasons why documenting AISs is important: (1) depicting
how the system works, (2) training users, (3) designing new systems, (4) controlling systems
existing system, and (3) to provide design specifications to outside vendors who might be
proposing new systems.
control weaknesses that are not apparent from prototypes or not obvious when observing a
system in use.
5-2. Document flowcharts mostly depict the physical flow of paper documents through a
system. Document and system flowcharts are similar in that they use similar symbols, although
Accountants can use data flow diagrams (DFDs) to depict the physical flows of data through an
AIS (like document flowcharts), or the logical flow of data through an AIS (like system
Program flowcharts tend to depict the most detailed level of system flowcharts because they
outline the logic sequence for a particular application program. Thus, they are more used by
5-3. A document flowchart is a pictorial representation of the physical data flow through
the various departments of a business. A document flowchart is used in designing or evaluating
an accounting information system.
Core Concepts of Accounting Information Systems, 13th Edition, by Simkin, Rose, and Norman
SM 5.2
1. A systems analyst uses it when evaluating a system to see if each department is receiving
others.
2. A system designer uses it when managers wish to improve or replace an existing system.
4. An auditor uses it to help define, follow, and evaluate an audit trail.
5. An internal data security expert uses it to identify weaknesses in the internal controls or
data processing of an accounting system.
5-5. Data flow diagrams use a square symbol to show the source or destination of data, a
circle to indicate a process, an open rectangle symbol to indicate a store of data, and arrows to
depict a data flow or data stream.
5-6. Developers create data flow diagrams in a hierarchy called the top-down approach to
systems development. In this approach, developers create these diagrams in levels, beginning
revisions are common, and little is considered “final” until the lowest diagram levels have been
specified and approved.
5-7. It is usually easier to follow logic with a chart or figure than with a written narrative.
the use of arrows to show connections or data flows.
5-8. Decision tables outline the set of conditions that a given processing task might
encounter and indicate the appropriate action to take for each condition. Decision tables can
because a computer program fails to account for a specific set of conditions. Finally, those
accountants who audit AISs rely heavily upon internal documentation, and decision tables can
Core Concepts of Accounting Information Systems, 13th Edition, by Simkin, Rose, and Norman
SM 5.3
5-9. Just as word processors enable users to create, store, modify, and print word
documents, CASE tools enable IT and accounting personnel to create, store, modify, and print
flowcharts. Most also include generators for developing data dictionaries.
not use such capable and time-saving tools.
5-10. End user computing refers to the computer activities of non-computer employees,
especially the development of large spreadsheets and databases. Although such activities are
descriptions, tutorials, and reference materials that other users need in order to run the
applications effectively. At one company known to the authors, important spreadsheets must be
Problems
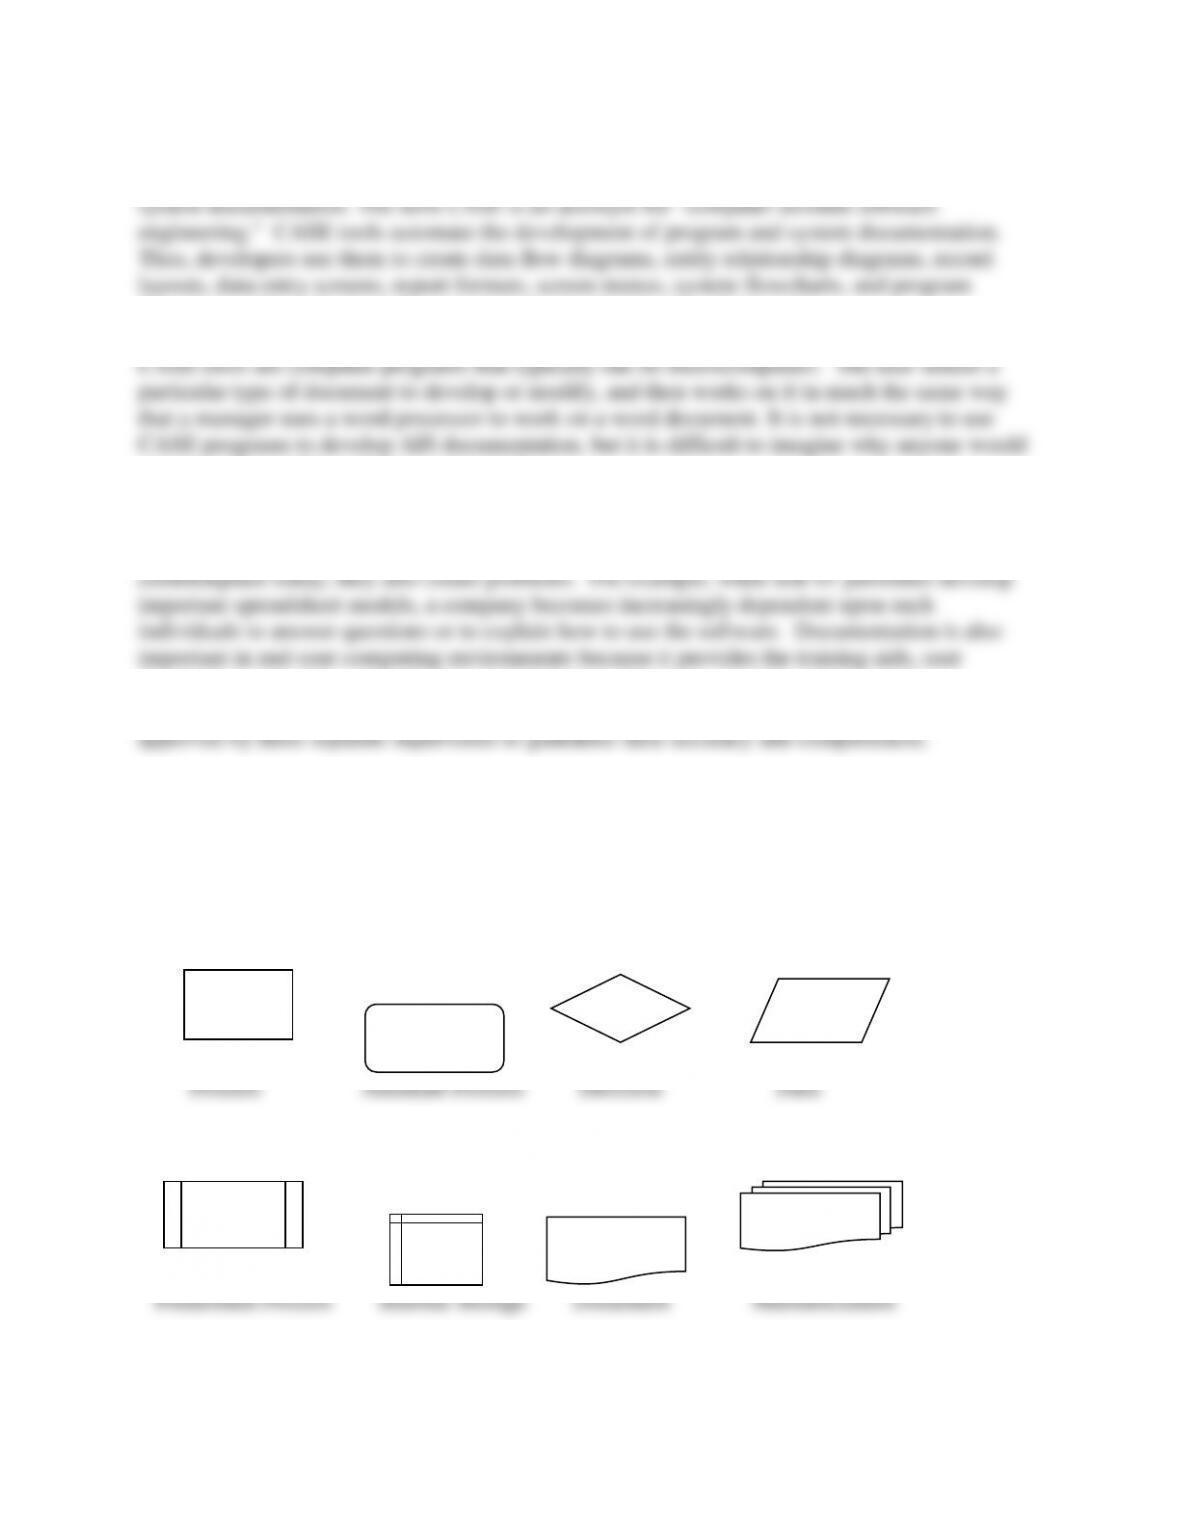
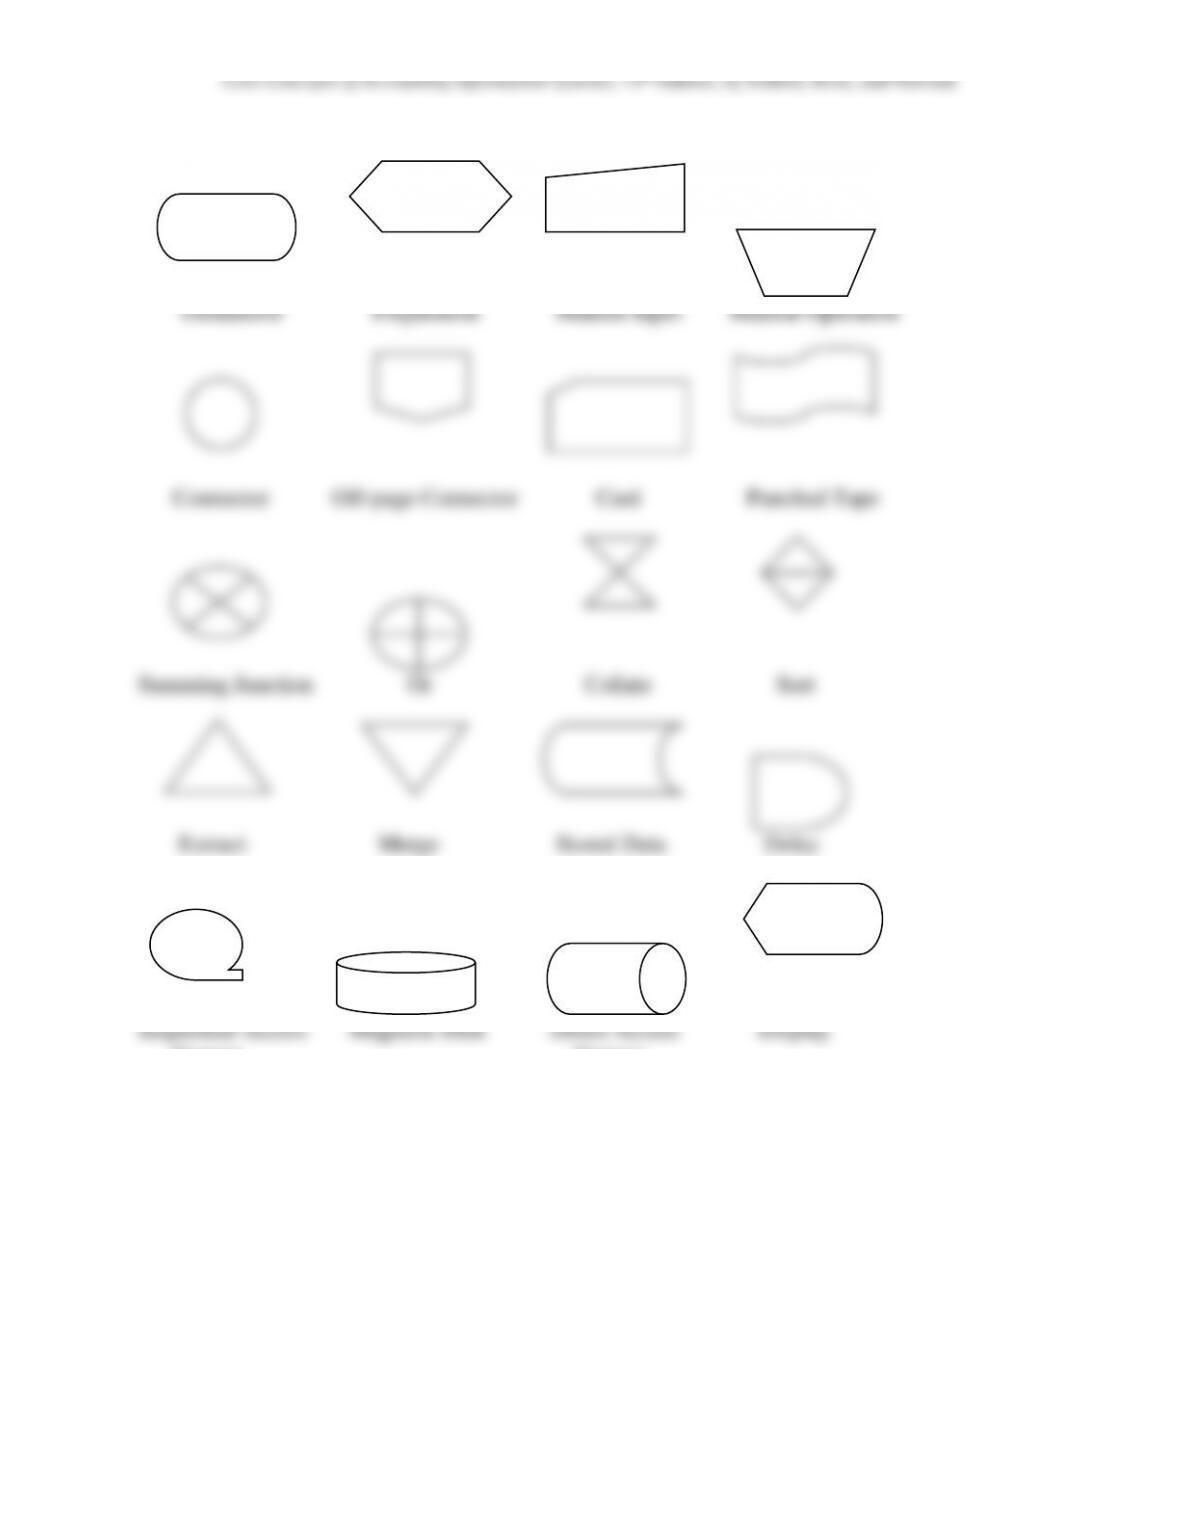
5-11. This problem asks students to familiarize themselves with Excel’s flowcharting
symbols. The list includes the following symbols:
Process
Alternate Process
Decision
Data
Predefined Process
Internal Storage
Document
Multidocument
Terminator
Preparation
Manual Input
Manual Operation
Connector
Off-page Connector
Card
Punched Tape
Summing Junction
Or
Collate
Sort
Extract
Merge
Stored Data
Delay
Sequential Access
Magnetic Disk
Direct Access
Display
Storage
Storage
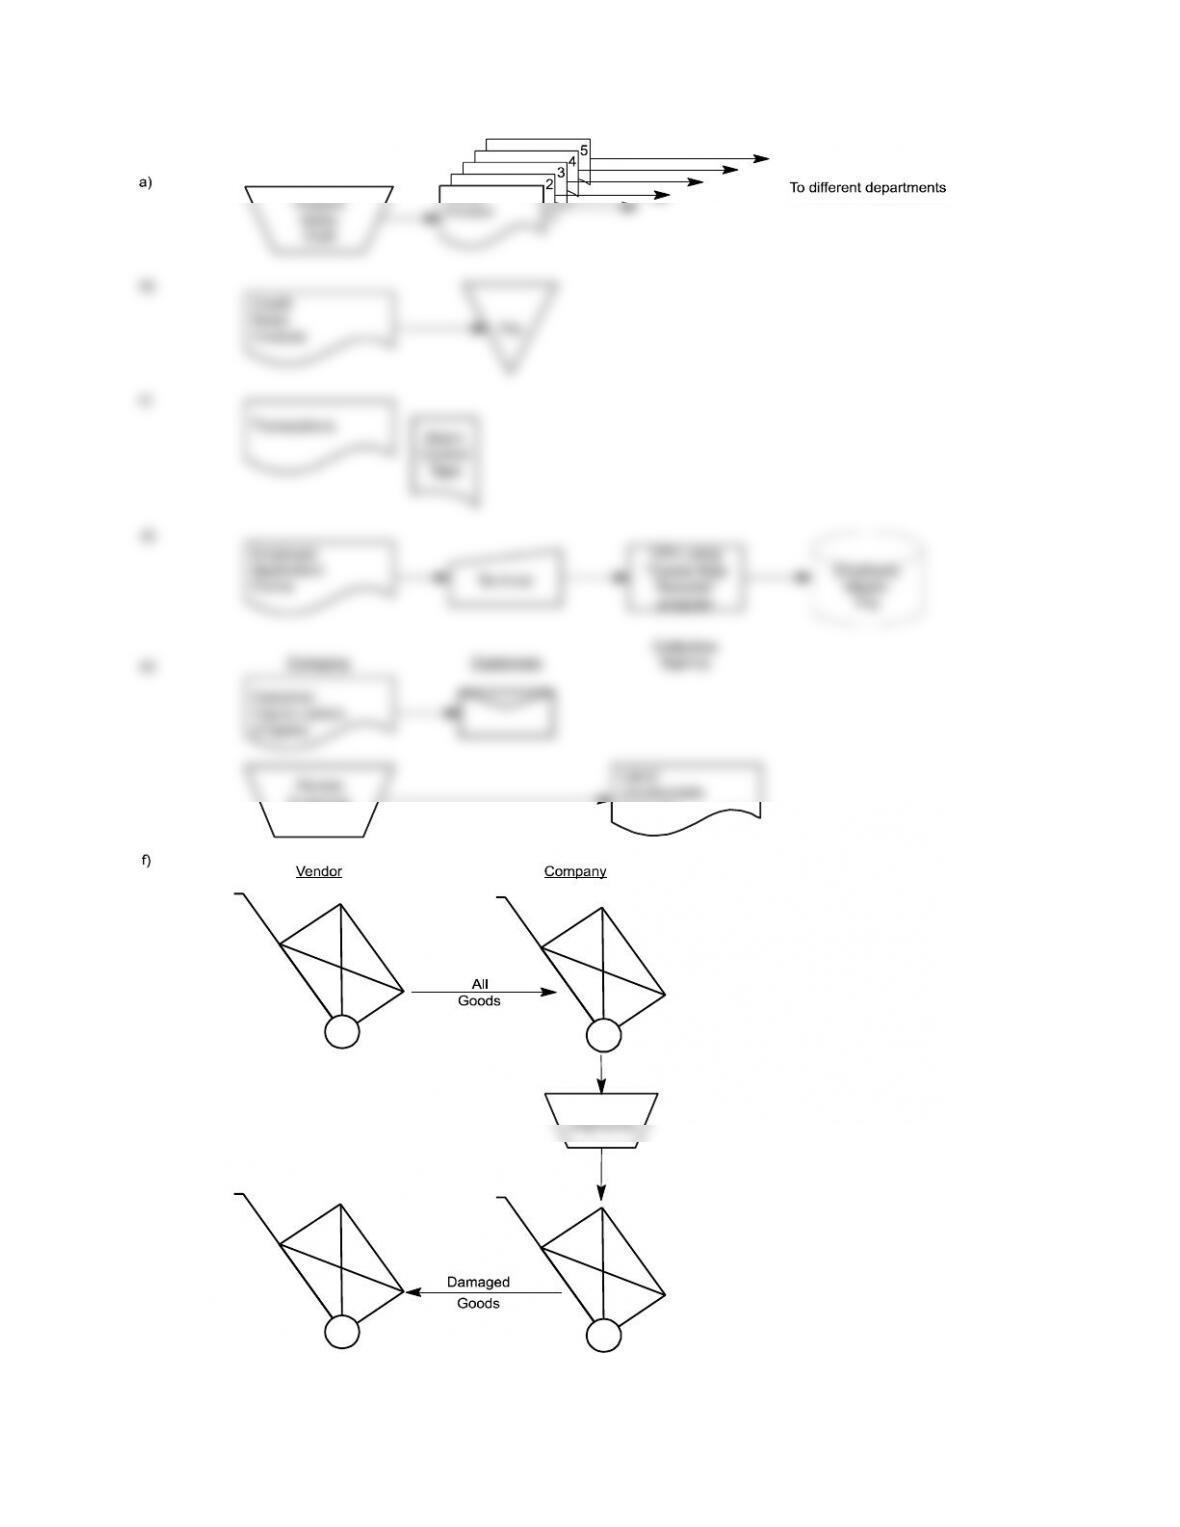
5-12. Draw a document flowchart for each of the following situations.
Core Concepts of Accounting Information Systems, 13th Edition, by Simkin, Rose, and Norman
SM 5.5
Prepare
Sales
Draft
Credit
Sales
Invoices File
Inspect
shipments
Sales 1
Invoice
SM 5.6
Key entry
Employee
time card
data
Employee
time card
data
Source
Document
Source
Document
Source
Document
Source
Document
Source
Document
Source
Document
File
File
Ledger
Copy
Dept. 1 Dept. 2
to CPU
to CPU
g)
h)
k)
Employee
time card
data
Key entry
SM 5.7
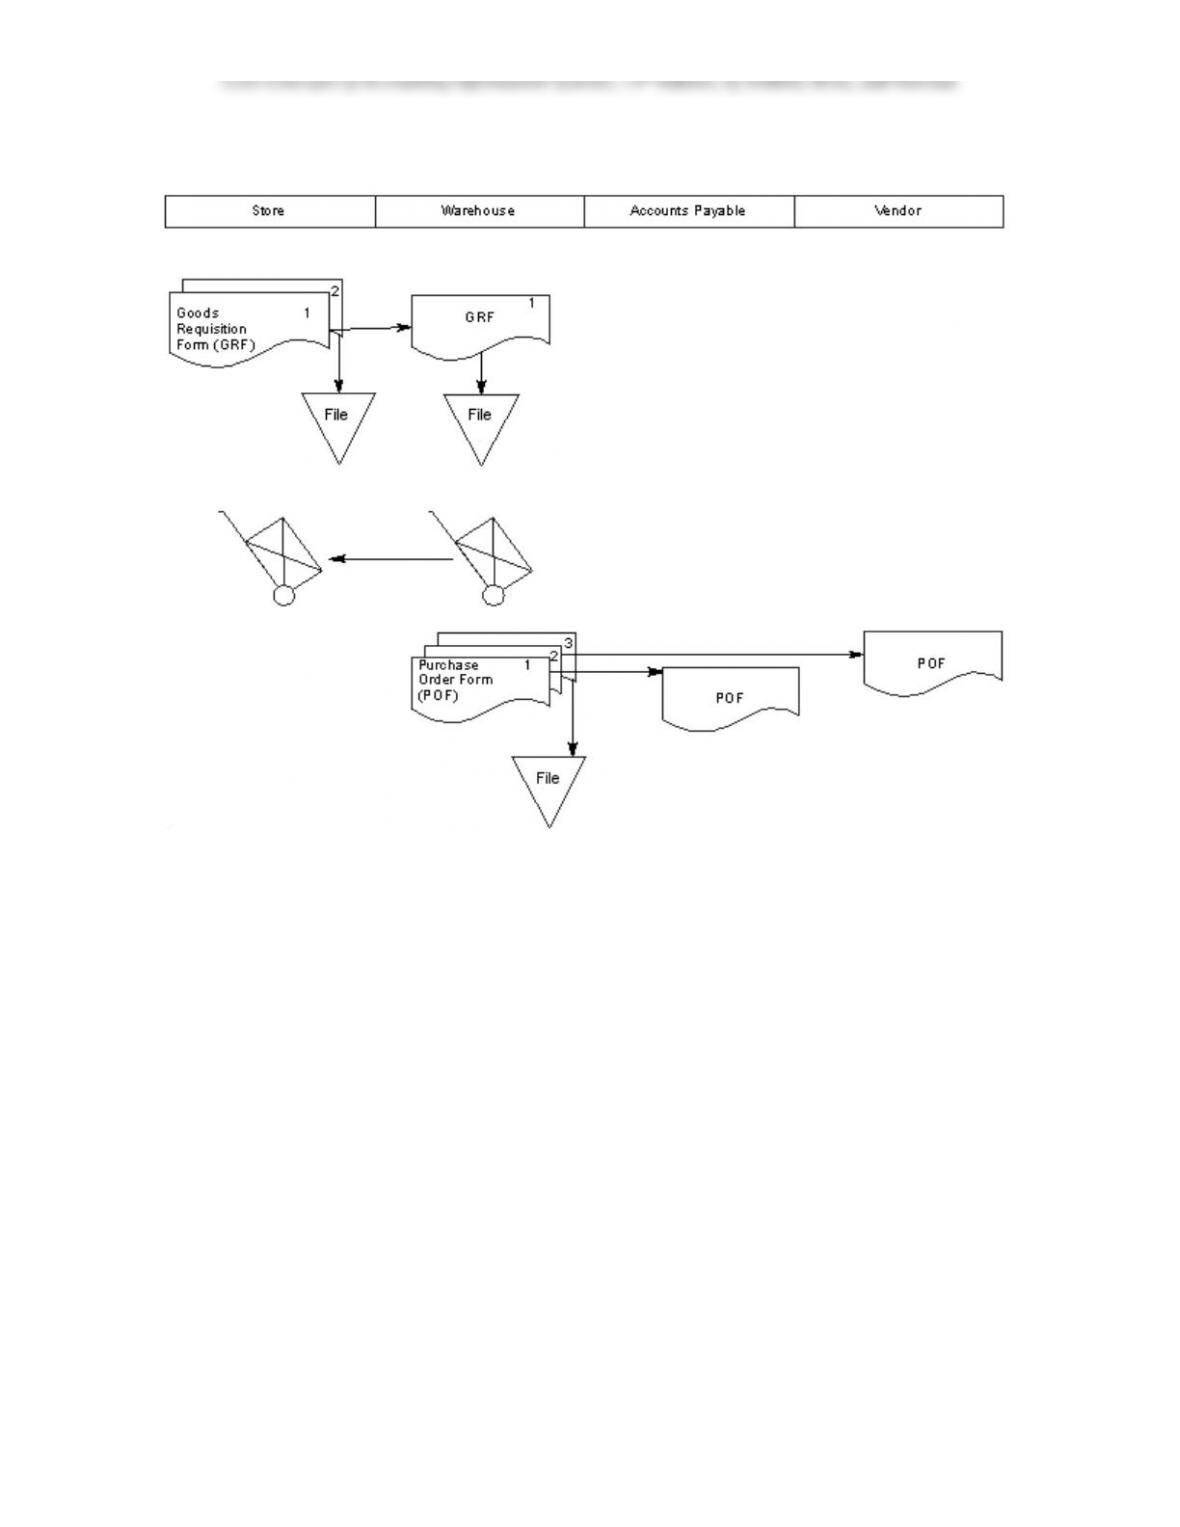
5-13. Mark Goodwin Convenience Stores
SM 5.8
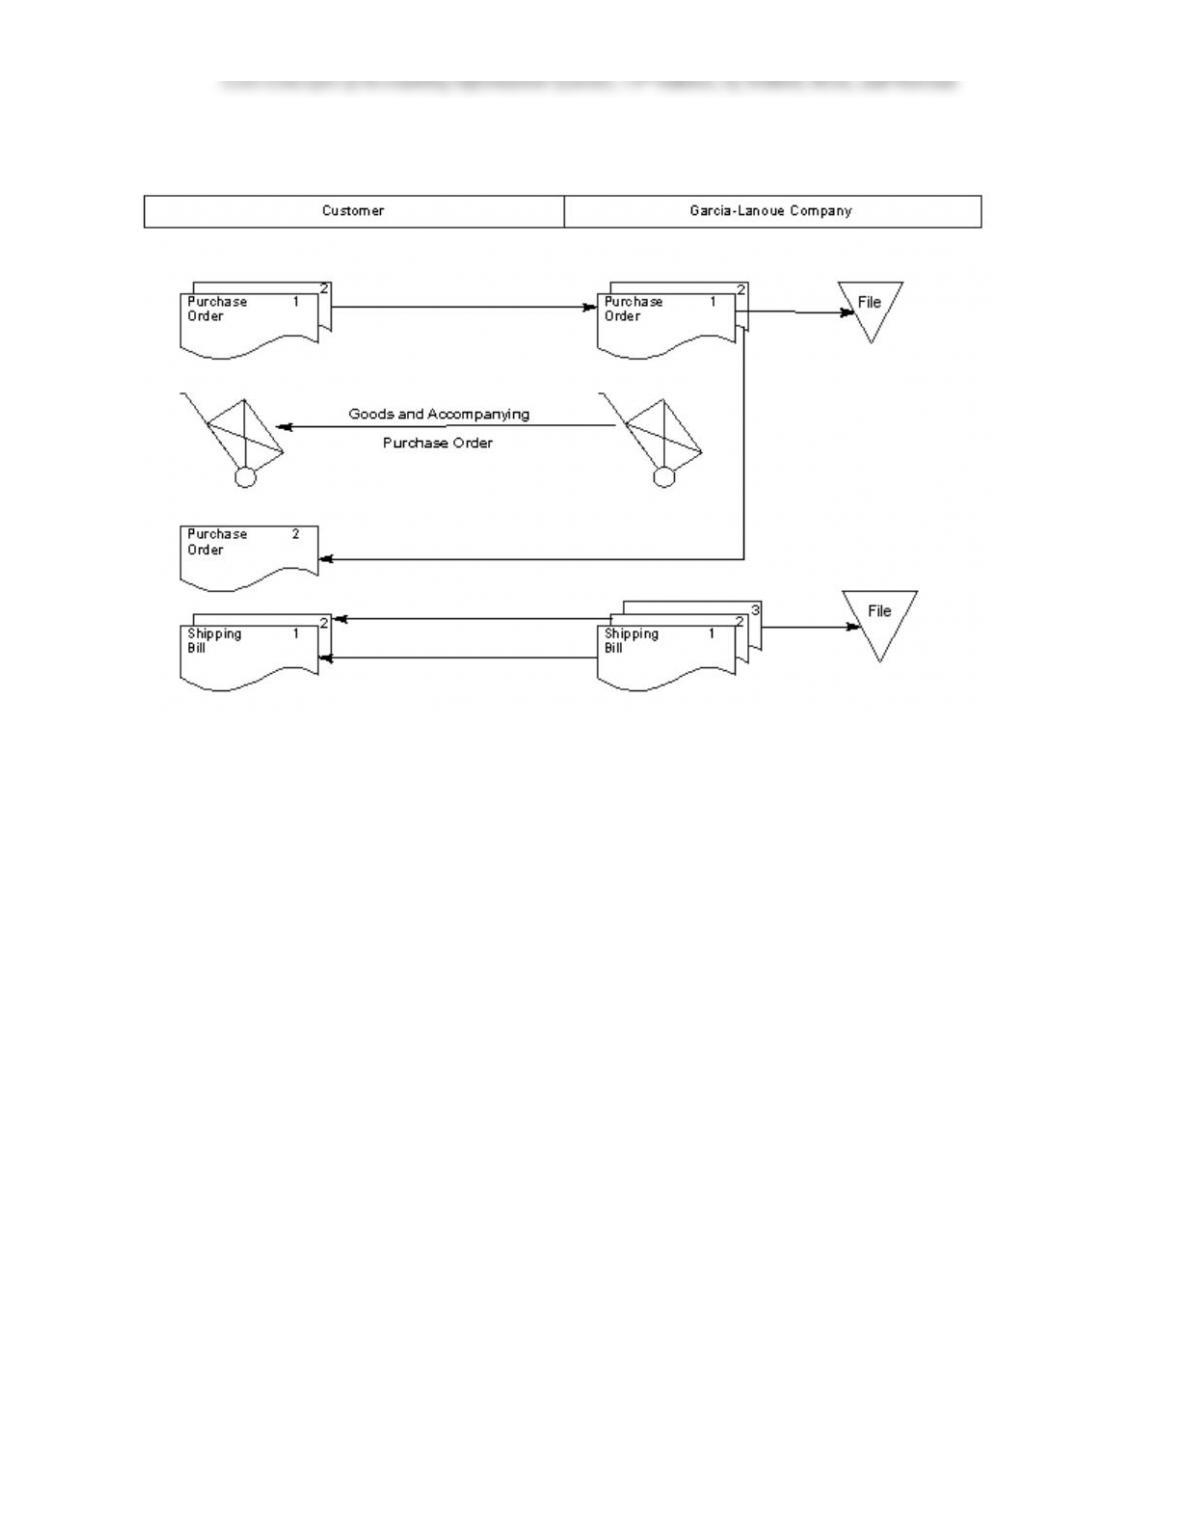
5-14 Garcia-Lanoue Company
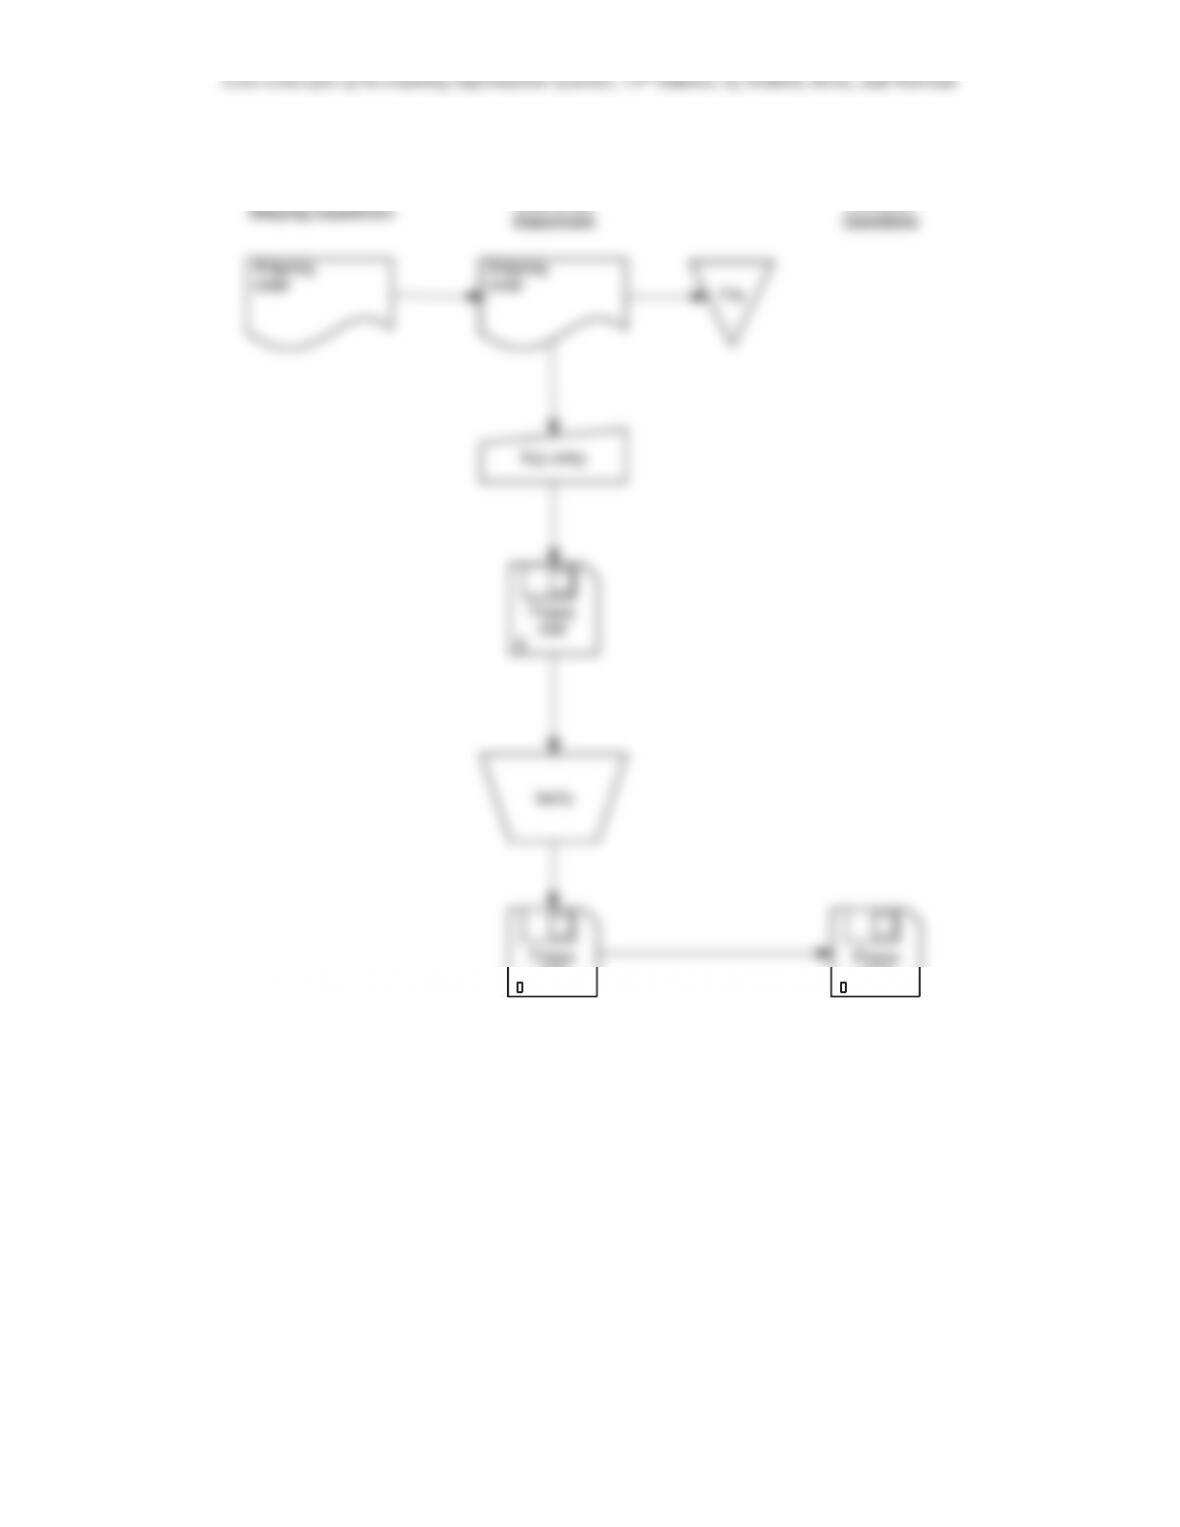
5-15. Ron Mitchell Manufacturing Company
Shipping
order
Shipping
order File
Key entry
Shipping Department Data Entry
Department
Computer
Operations
Floppy
disk
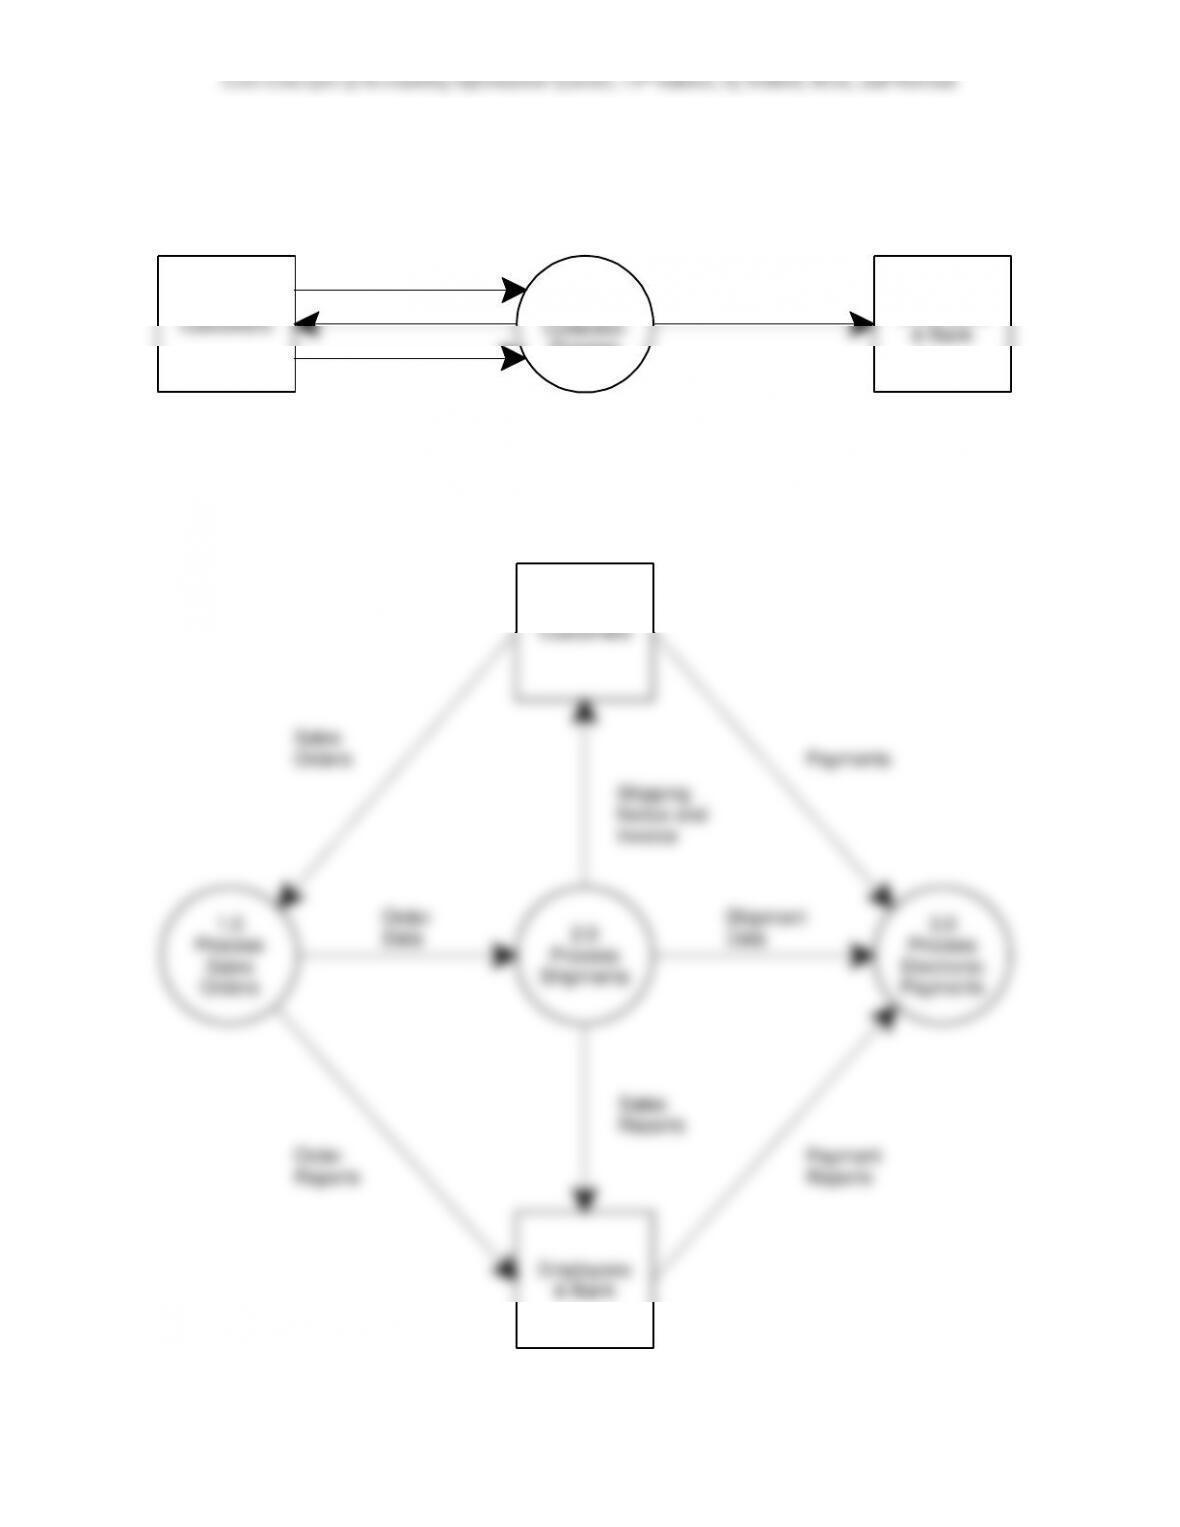
5-16. Amanda M Company
Context Diagram:
Customers Employees
& Bank
Sales /
Collection
Process
Level 0 Diagram:
Customers
Payments
Sales
Orders