
3.32 Obtain the World Health Organization (WHO) report on “Urine diversion: Hygienic risks
and microbial guidelines for reuse.” Read Chapter 4, (Pathogenic microorganisms in urine) of
the WHO report. Answer the following questions. (a) Is the urine in a healthy individual’s
bladder sterile or nonsterile? (b) What concentration of dermal bacteria are picked up during
urination (bacteria/mL)? (c) What percent of urinary track infections are caused by E. coli?
Solution:
3.33 Ammonia, NH3, is a common constituent of many natural waters and wastewaters. In
treating water containing ammonia at a water–treatment plant, the ammonia reacts with the
disinfectant hypochlorous acid, HOCl, in solution to form monochloroamine, NH2Cl as follows:
NH3 + HOCl NH2Cl + H2O
The rate law for this reaction is
[ ]
[ ][ ]
3
3
NH HOCl NH
dk
dt = −
(a) What is the reaction order with respect to NH3?
(b) What order is this reaction overall?
(c) If the HOCl concentration is held constant and equals 10-4 M, and the rate constant equals 5.1
× 106 L/mole–s, calculate the time required to reduce the concentration of NH3 to one-half its
original value.
Solution:
3.34 Nitrogen dioxide (NO2) concentrations are measured in an air–quality study and decrease
from 5 ppmv to 2 ppmv in 4 min with a particular light intensity. (a) What is the first–order rate
constant for this reaction? (b) What is the half-life of NO2 during this study? (c) What would the
rate constant need to be changed to in order to decrease the time required to lower the NO2
concentration from 5 ppmv to 2 ppmv in 1.5 min?
Solution:
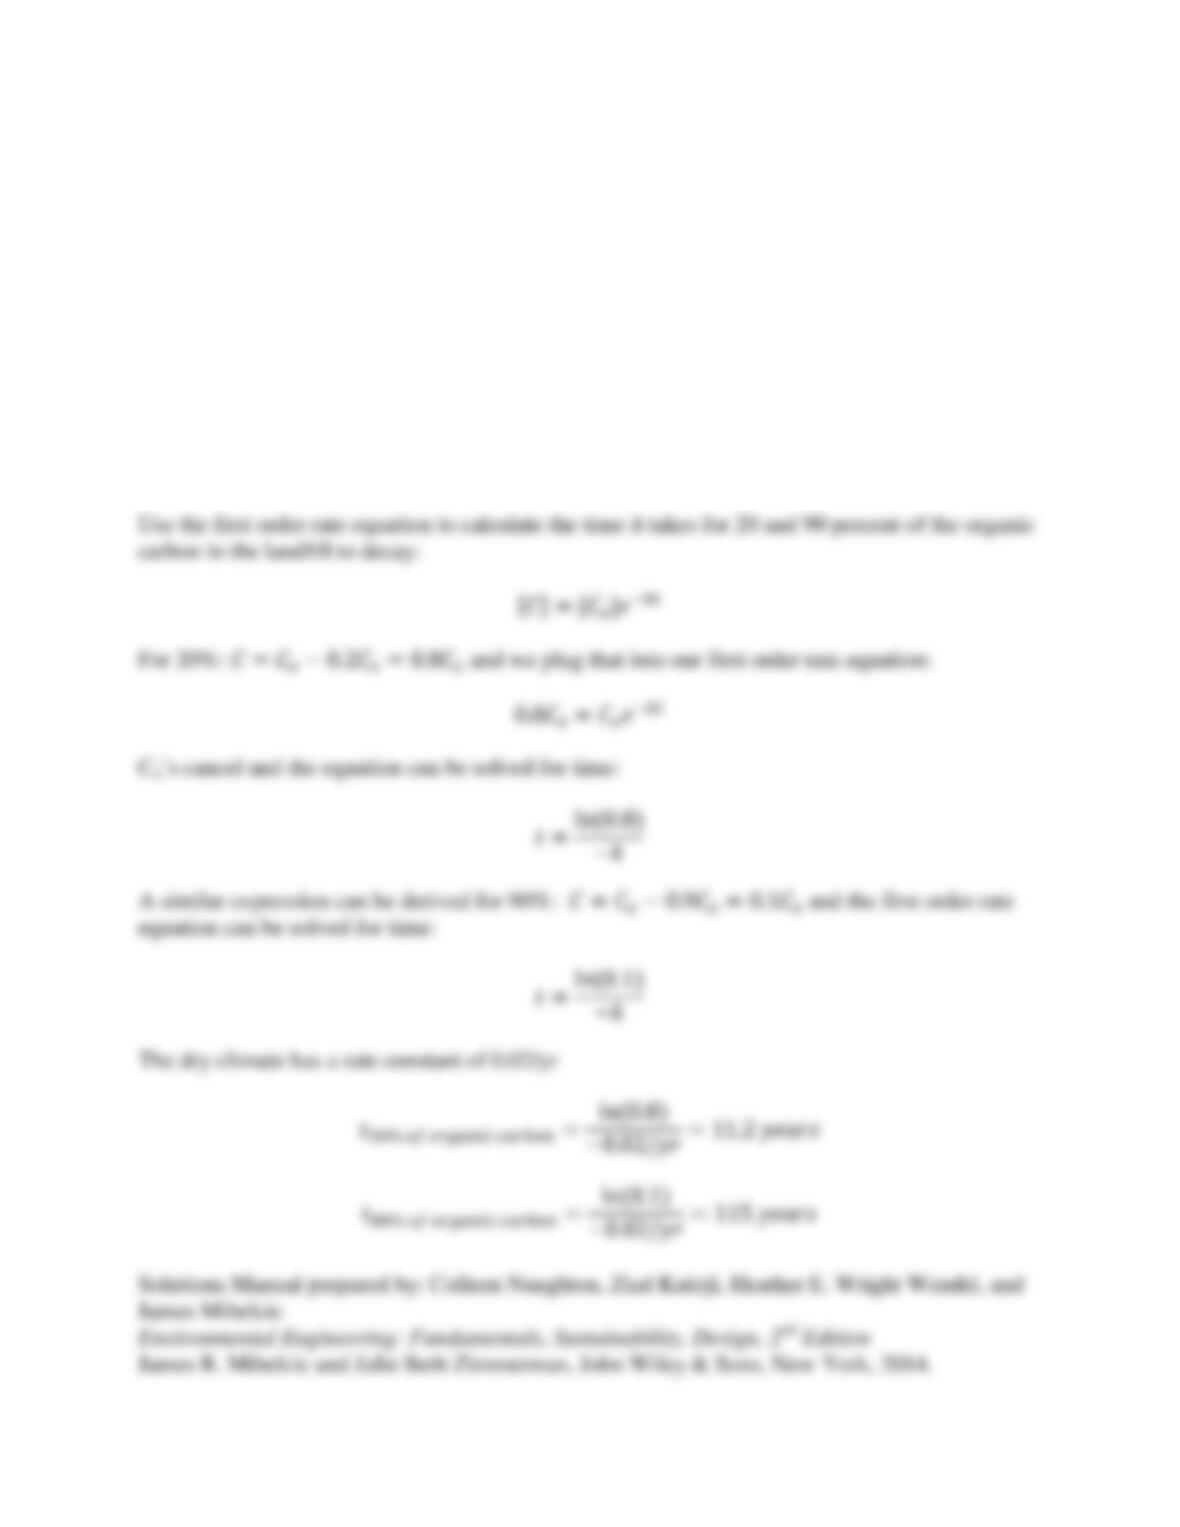
3.35 Assume that municipal solid waste is 30% organic carbon by wet weight. The organic
carbon in the solid waste decays by first order kinetics after placed in a landfill with reported rate
constants for a dry climate (0.02/yr), moderate climate (0.038/yr), and wet climate (0.057/yr).
Dry climate is defined as precipitation plus recirculated leachate being less than 20 inches/year;
moderate climate as precipitation plus recirculated leachate ranges from 20 to 40 inches/year;
and, a wet climate having precipitation plus recirculated leachate greater than 40 inches/year.
Estimate the time it takes for 20 and 90 percent of the organic carbon contained in a municipal
solid waste landfill to decay in the three different climates. In practice, this will be the period
when greenhouse gases should be captured from the landfill).
Solution:

3.36 On March 11, 2011, a massive earthquake and tsunami triggered a major disaster at Japan’s
Fukushima nuclear plant. A plume extending to the northwest of the site deposited significant
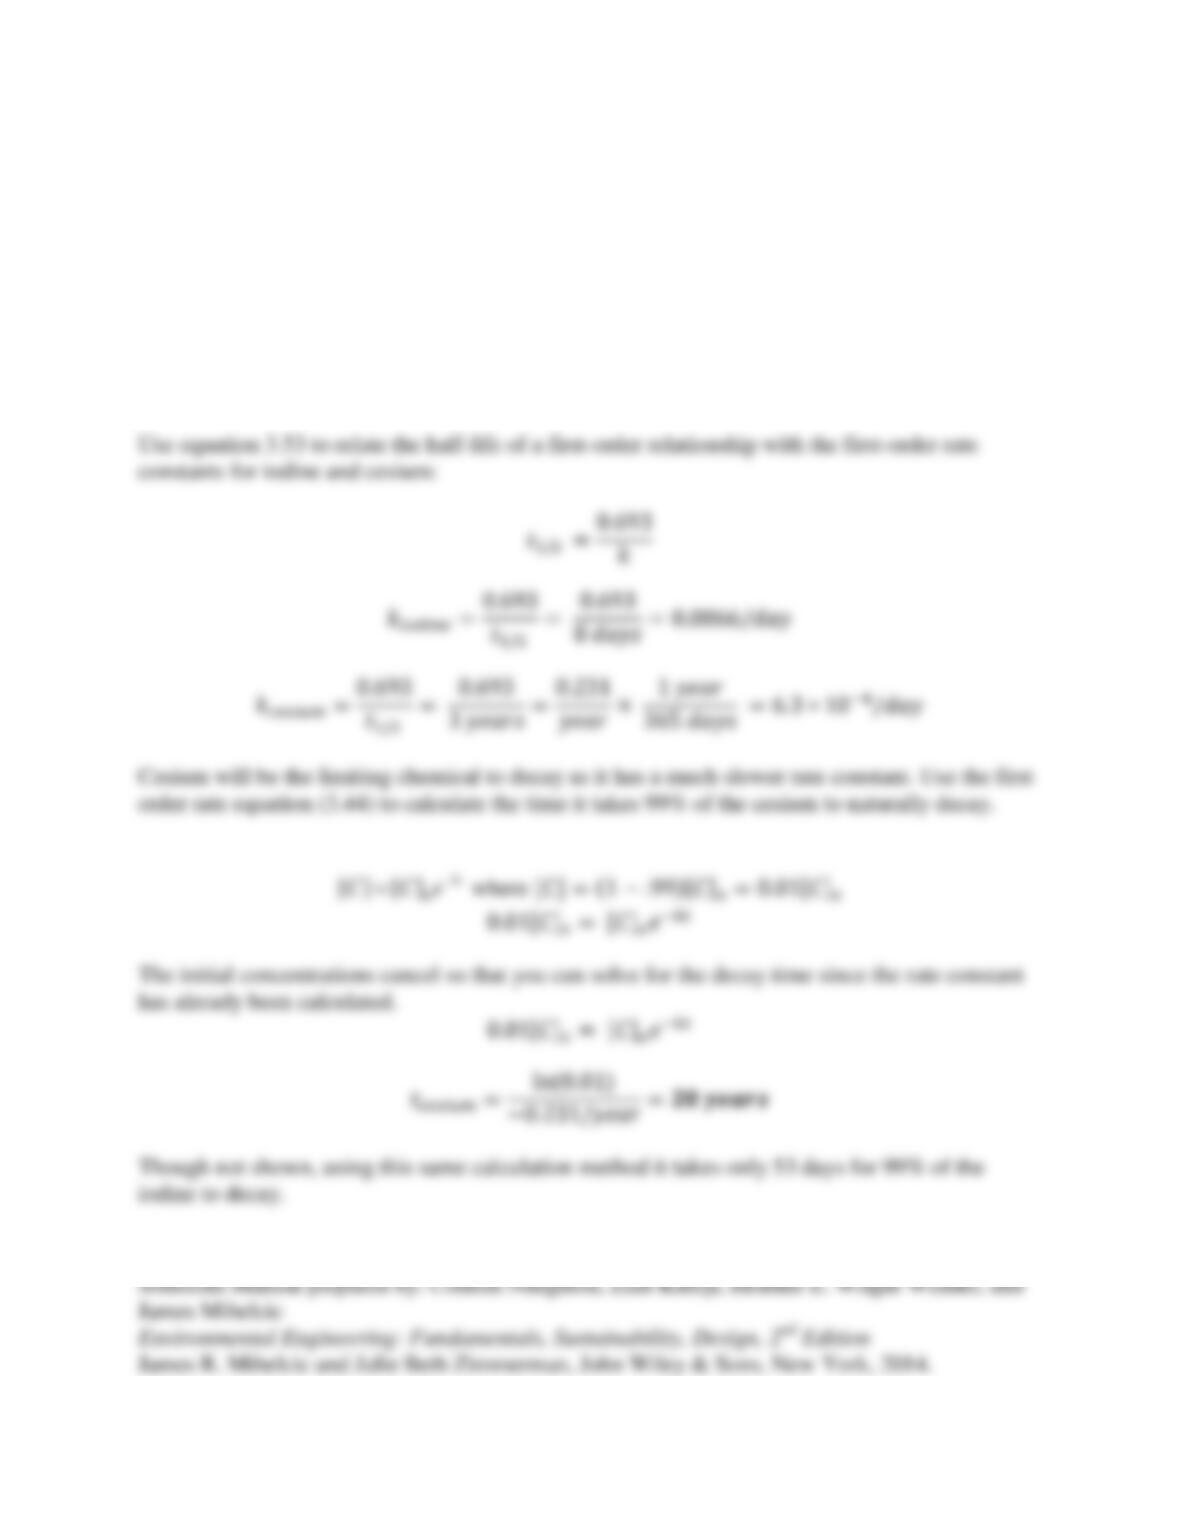
amounts of iodine-131, cesium-134, and cesium-137 up to 30 miles away. Iodine-131 has an 8-
day half–life and cesium-137 has a 3-year half–life. Determine how long it will take 99% of the
iodine-131 and 99% of the cesium-137 to naturally decay (you can learn about “U.S. Nuclear
Power Safety One Year after Fukushima” by reading the report written by D. Lochbaum and E.
Lyman, located on the web site of the Union of Concerned Scientists,
http://www.ucsusa.org/publications/publications-nuclear-power.html)
Solution:
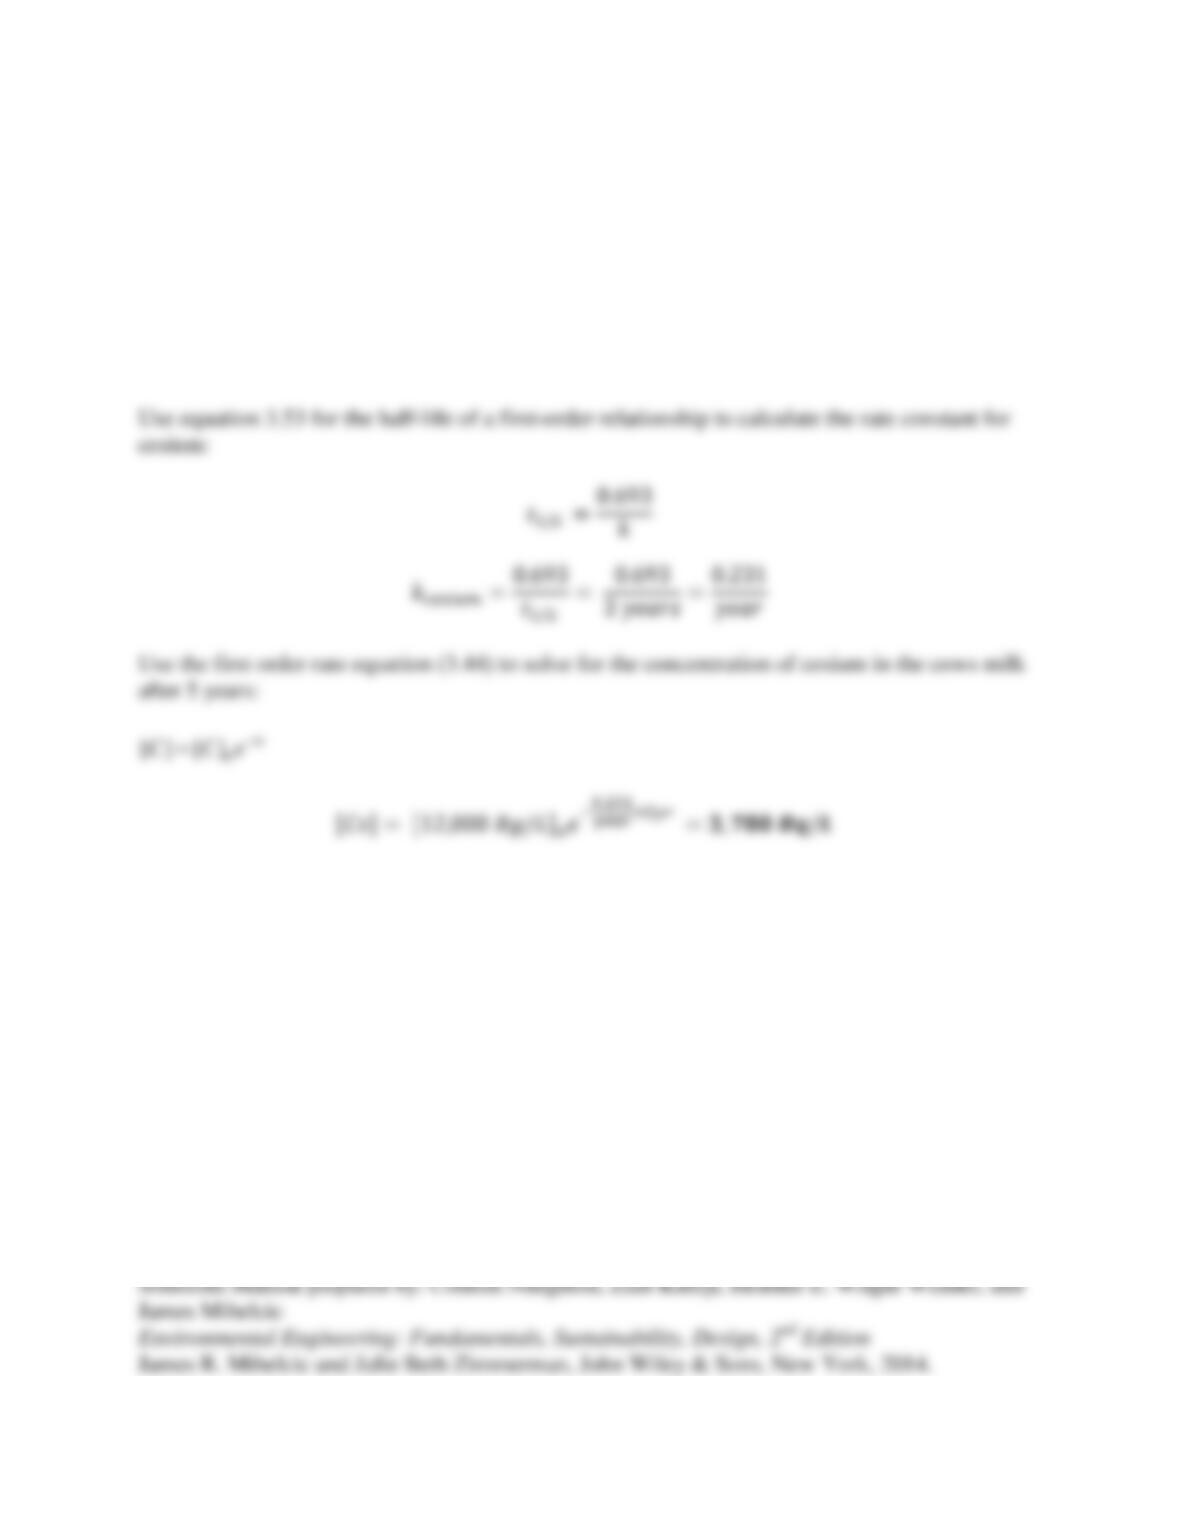
3.37 After the Chernobyl nuclear accident, the concentration of 137Cs in milk was proportional
to the concentration of 137Cs in the grass that cows consumed. The concentration in the grass
was, in turn, proportional to the concentration in the soil. Assume that the only reaction by which
137Cs was lost from the soil was through radioactive decay and the half-life for this isotope is 3
years. Calculate the concentration of 137Cs in cow’s milk after 5 years (units of Bq/L) if the
concentration in milk shortly after the accident was 12,000 Bequerels (Bq) per liter (a Bequerel
is a measure of radioactivity; 1 bequerel equals 1 radioactive disintegration per second).
Solution:
3.38 In the next chapter, Figure 4.14 shows the annual mean growth rate (units of ppm
CO2/year) measured at Mauna Loa (Hawaii). The annual mean rate of growth of CO2 in a given
year is the difference in concentration between the end of December and the start of January of
that year. The National Oceanic and Atmospheric Administration (NOAA) reports that the
annual growth rate is similar to the global growth rate of CO2 in the atmosphere (Dr. Pieter Tans,
NOAA/ESRL, http://www.esrl.noaa.gov/gmd/ccgg/trends/, and Dr. Ralph Keeling, Scripps
Institution of Oceangraphy, scrippsco2.ucsd.edu/).
Yr
1959
1960
1961
1962
1963
1964
1965
1966
1967
1968
1969
ppm/yr
0.94
0.54
0.95
0.64
0.71
0.28
1.02
1.24
0.74
1.03
1.31
Yr
1970
1971
1972
1973
1974
1975
1976
1977
1978
1979
1980
ppm/yr
1.06
0.85
1.69
1.22
0.78
1.13
0.84
2.1
1.3
1.75
1.73
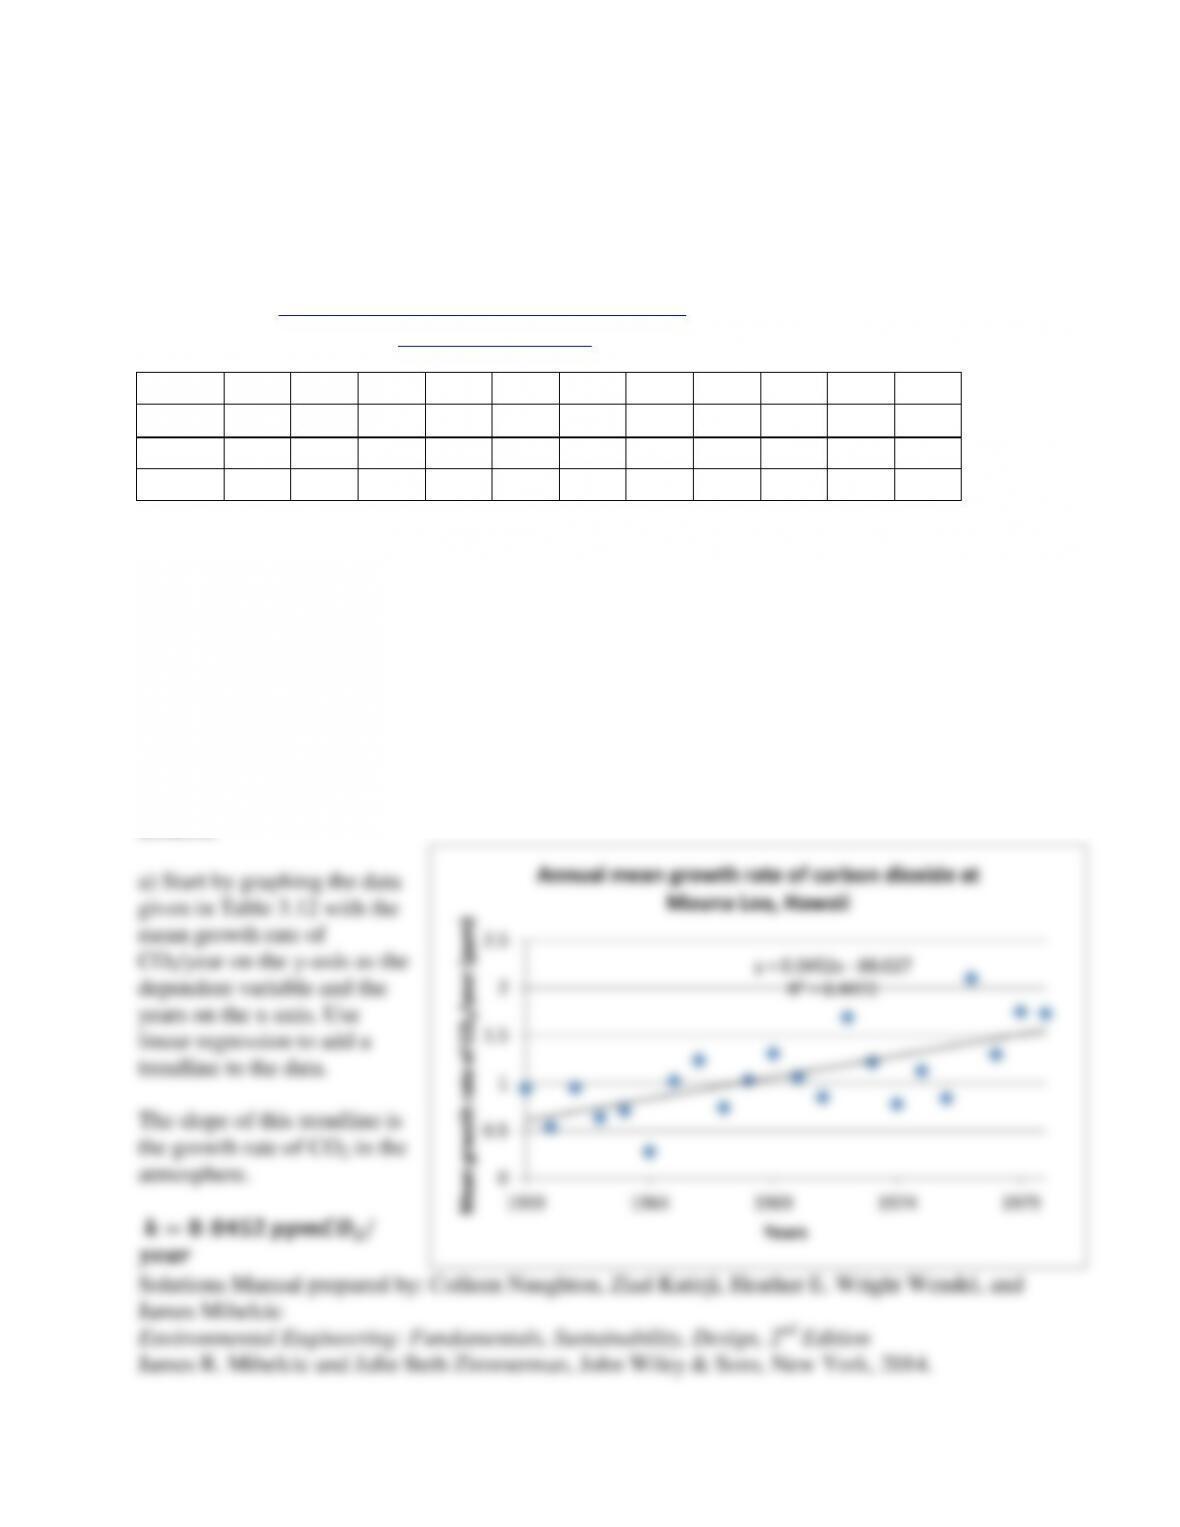
(a) What is the average growth rate of CO2 in the atmosphere over this 20-year period (ppm
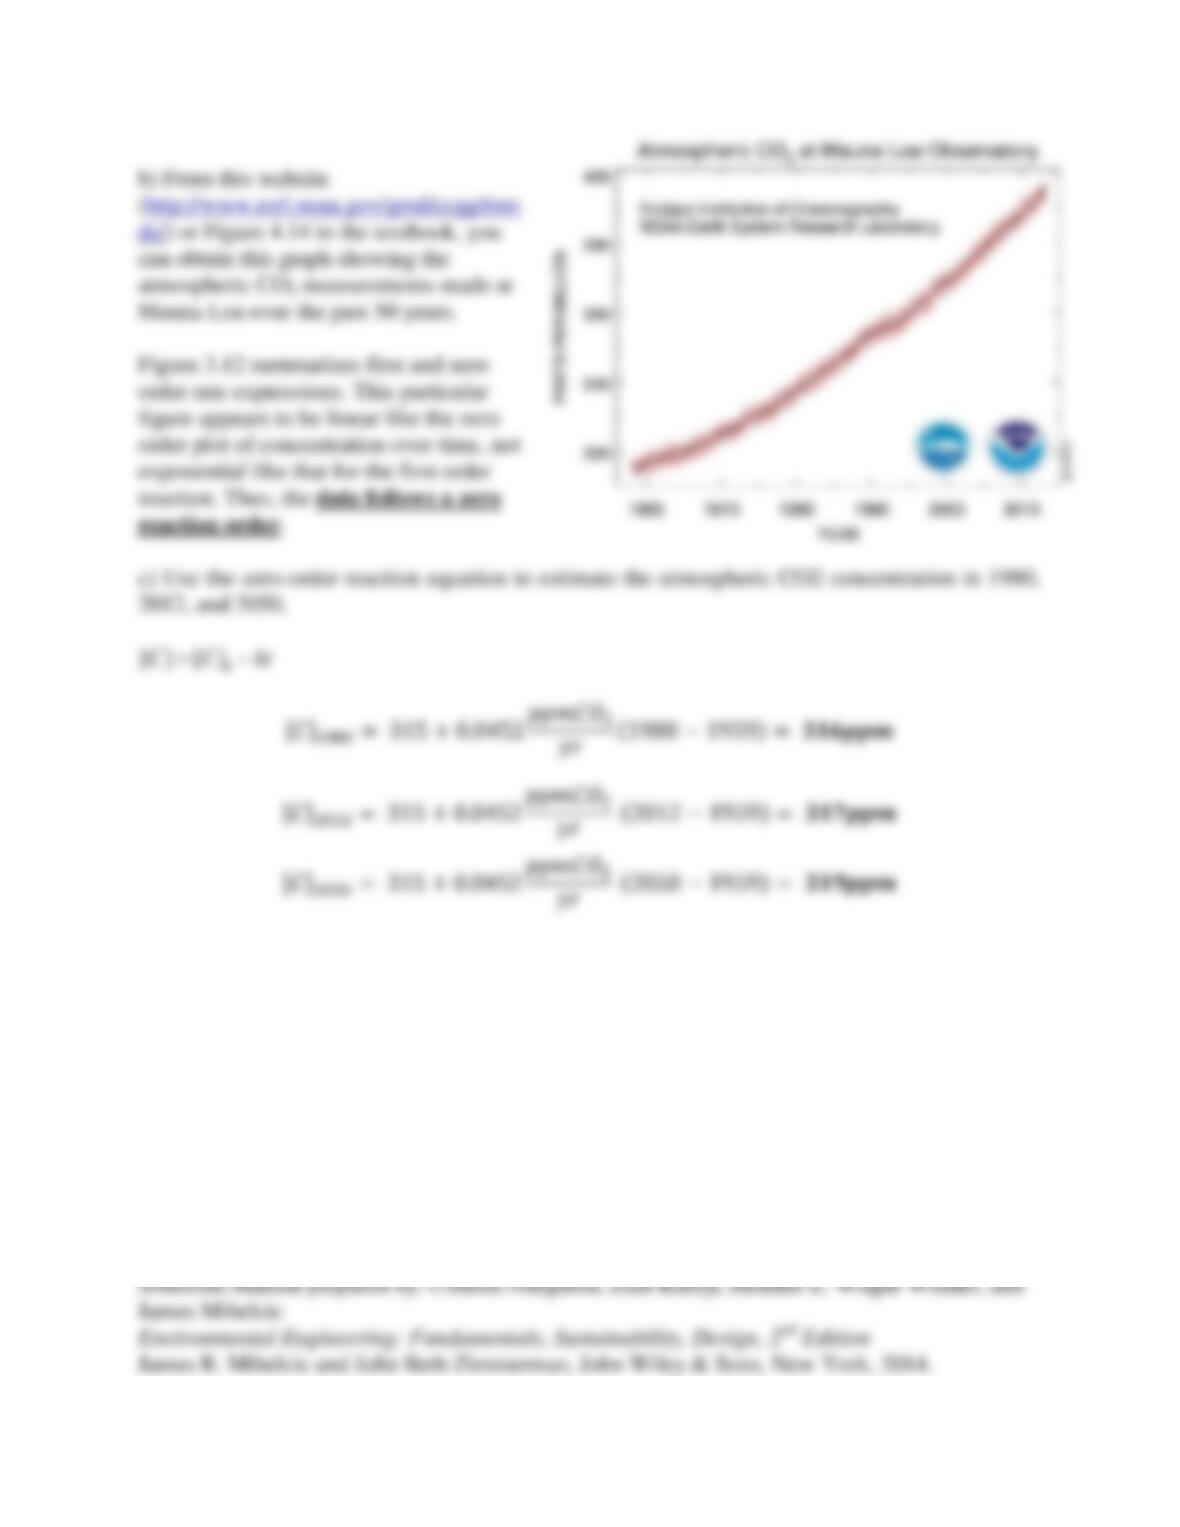
CO2/year)? (b) Review the shape of the figure showing the atmospheric CO2 measurements
made at Mauna Loa over the past 50 years (Figure 4.14 of the next chapter or the web site
referred to above). Does the data follow a first order or zero order reactor order? Explain your
answer. (c)_ Assume that the 1959 monthly mean concentration of CO2 measured at Mauna Loa
was 315 ppm. Using the average growth rate you determined in part (a) over the 20-year period
and the appropriate reactor order, what atmospheric CO2 concentration would you estimate for
the year 1980, 2012, and 2050?
Solution
given in Table 3.12 with the
mean growth rate of
CO2/year on the y-axis as the
dependent variable and the
years on the x-axis. Use
linear regression to add a
trendline to the data.
The slope of this trendline is
the growth rate of CO2 in the
atmosphere.
𝒌=𝟎.𝟎𝟒𝟓𝟐 𝒑𝒑𝒎𝑪𝑶𝟐/
𝒚𝒆𝒂𝒓
y = 0.0452x – 88.027
R² = 0.4472
0
0.5
1
1.5
2
2.5
1959 1964 1969 1974 1979
Mean grwoth rate of CO2/year (ppm)
Years
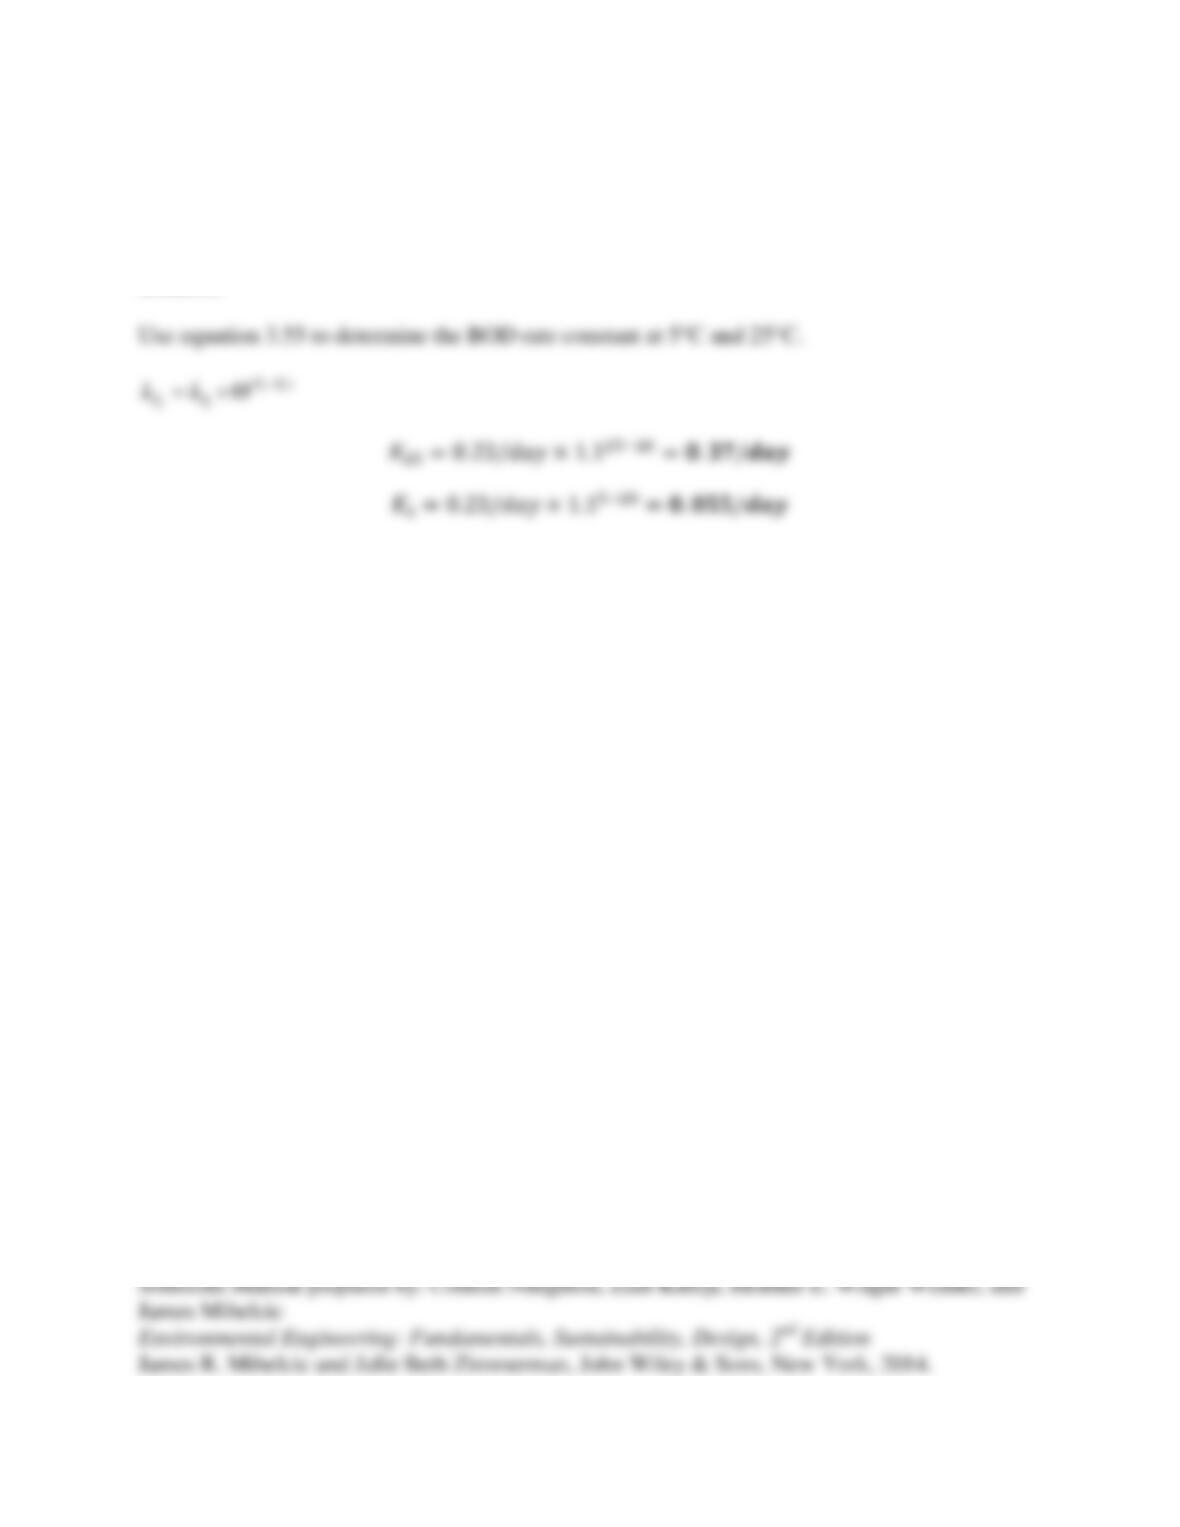
3.39 If the rate constant for the degradation of biochemical oxygen demand (BOD) at 20°C is
0.23/day, what is the value of the BOD rate constant at 5°C and 25°C? Assume that
Θ
equals
1.1.
Solution:
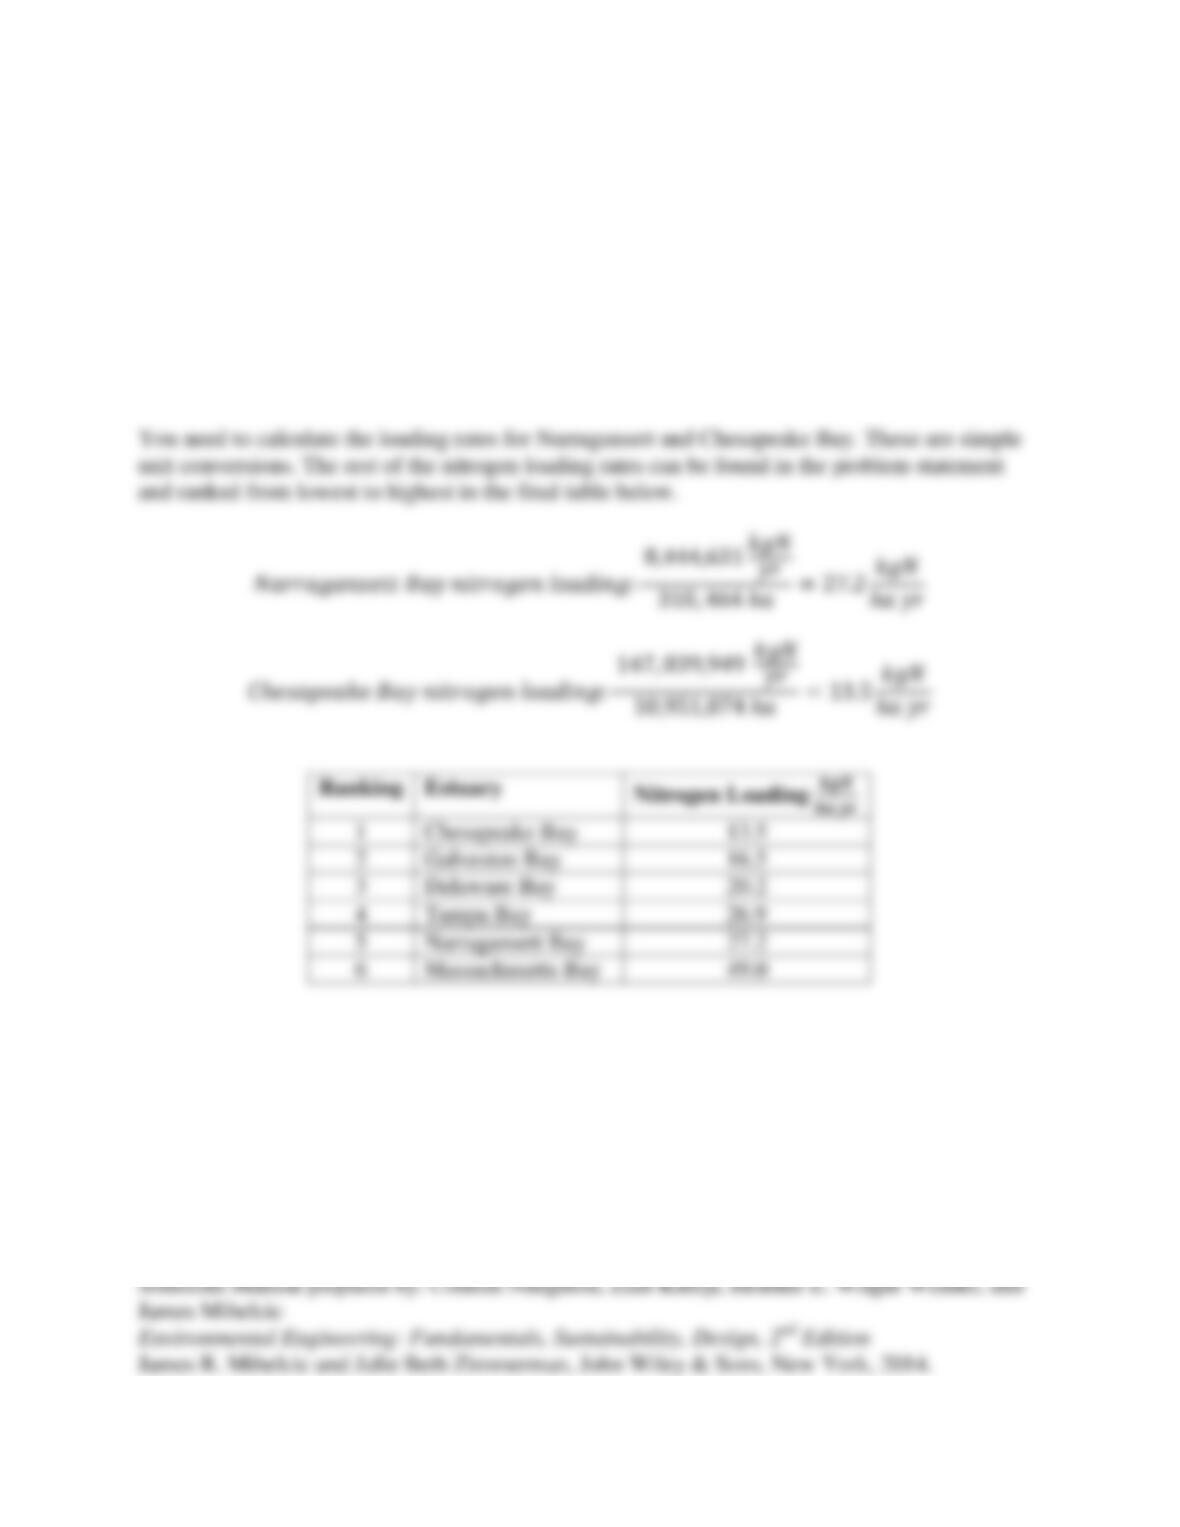
3.40 Excess nitrogen inputs to estuaries have been scientifically linked to poor water quality and
degradation of ecosystem habitat. The nitrogen loading to Narragansett Bay was estimated to be
8,444,631 kg N/year and to Chesapeake Bay is 147,839,494 kg N/year. The watershed area for
Narragansett Bay is 310,464 ha and for Chesapeake Bay is 10,951,074 ha. The nitrogen loading
rates are estimated for Galveston Bay to be 16.5 kg N per ha per year, 26.9 kg N per ha per year
for Tampa Bay, 49.0 kg N per ha per year for Massachusetts Bay, and 20.2 kg N per ha per year
for Delaware Bay. (a) Rank the loading rates from lowest to highest for these six estuaries.
Solution:
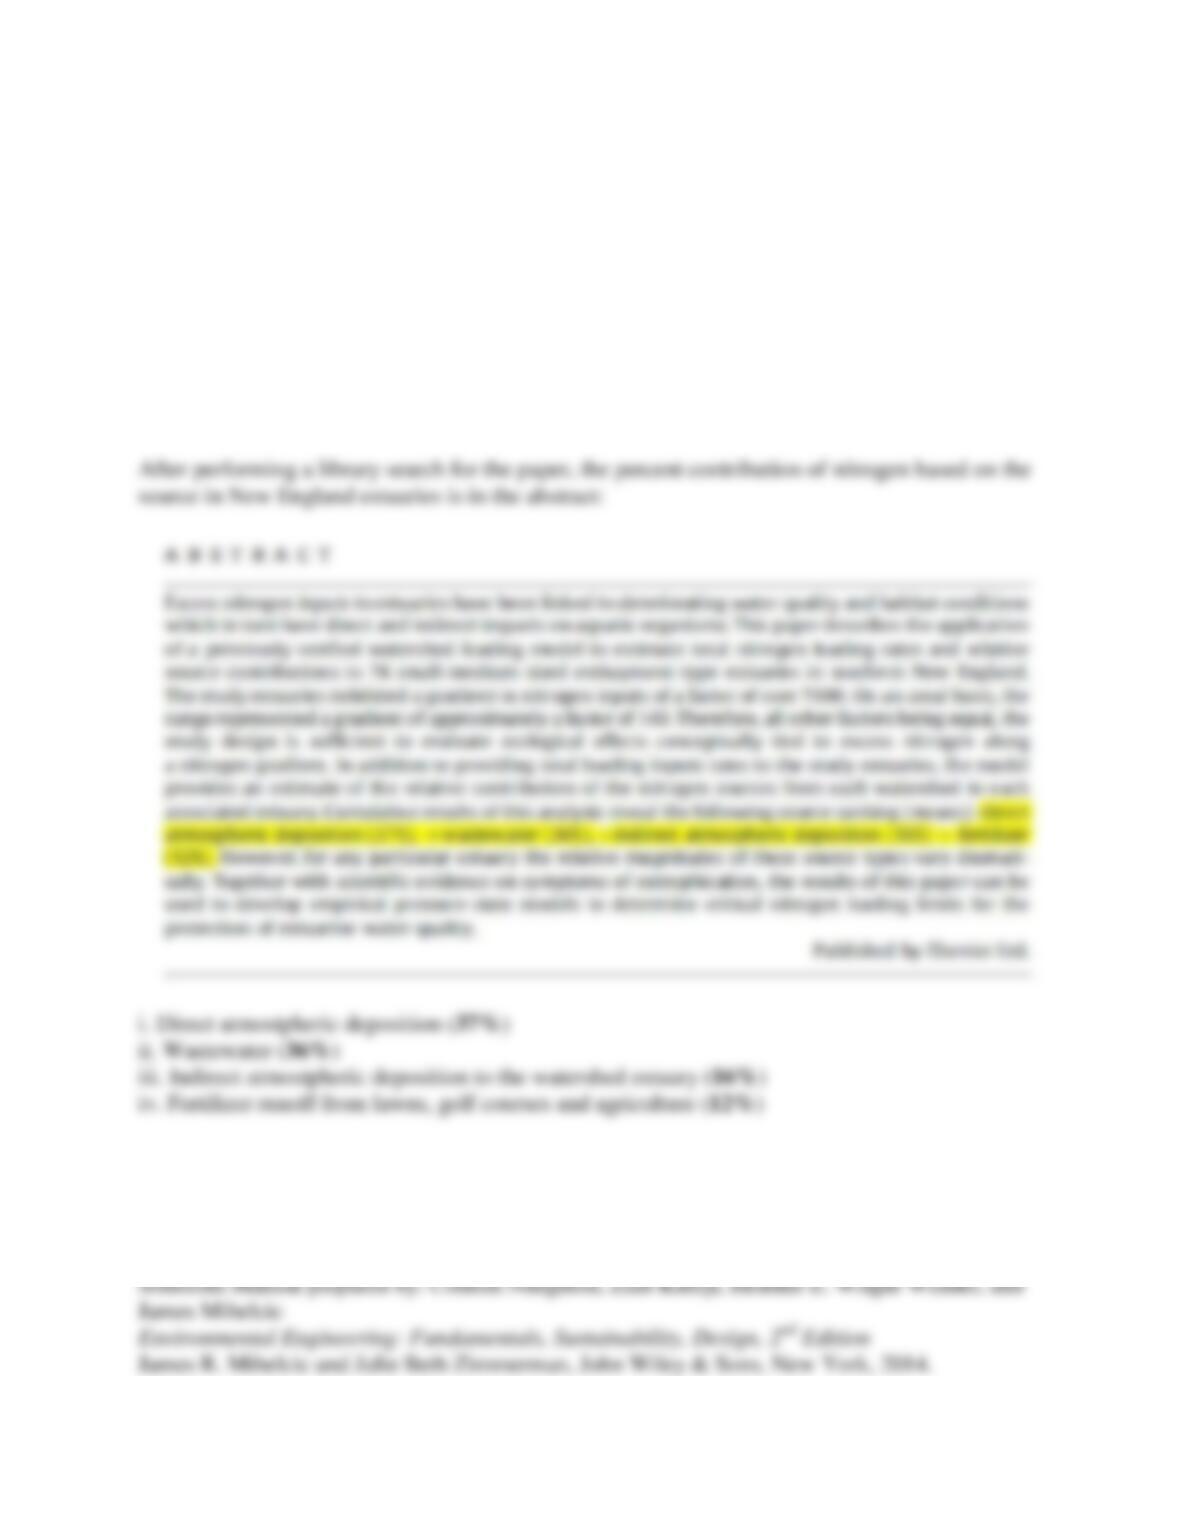
3.41 Excess nitrogen inputs to estuaries have been scientifically linked to poor water quality and
degradation of ecosystem habitat. Perform a library search for the paper title “Nitrogen inputs to
seventy-four southern New England estuaries: Application of a watershed nitrogen model (J.S.
Latimer and M.A. Charpentier, Estuarine, Coastal and Shelf Science, 89:125-136, 2010).
Based on this article, what is the percent contribution of the following four sources of nitrogen to
the watershed of the New England estuaries? i) Direct atmospheric deposition to the estuaries,
ii) wastewater, iii) indirect atmospheric deposition to the watershed of the estuary, iv) fertilizer
runoff from lawns, golf courses, and agriculture.
Solution:
Chapter 4. Physical Processes
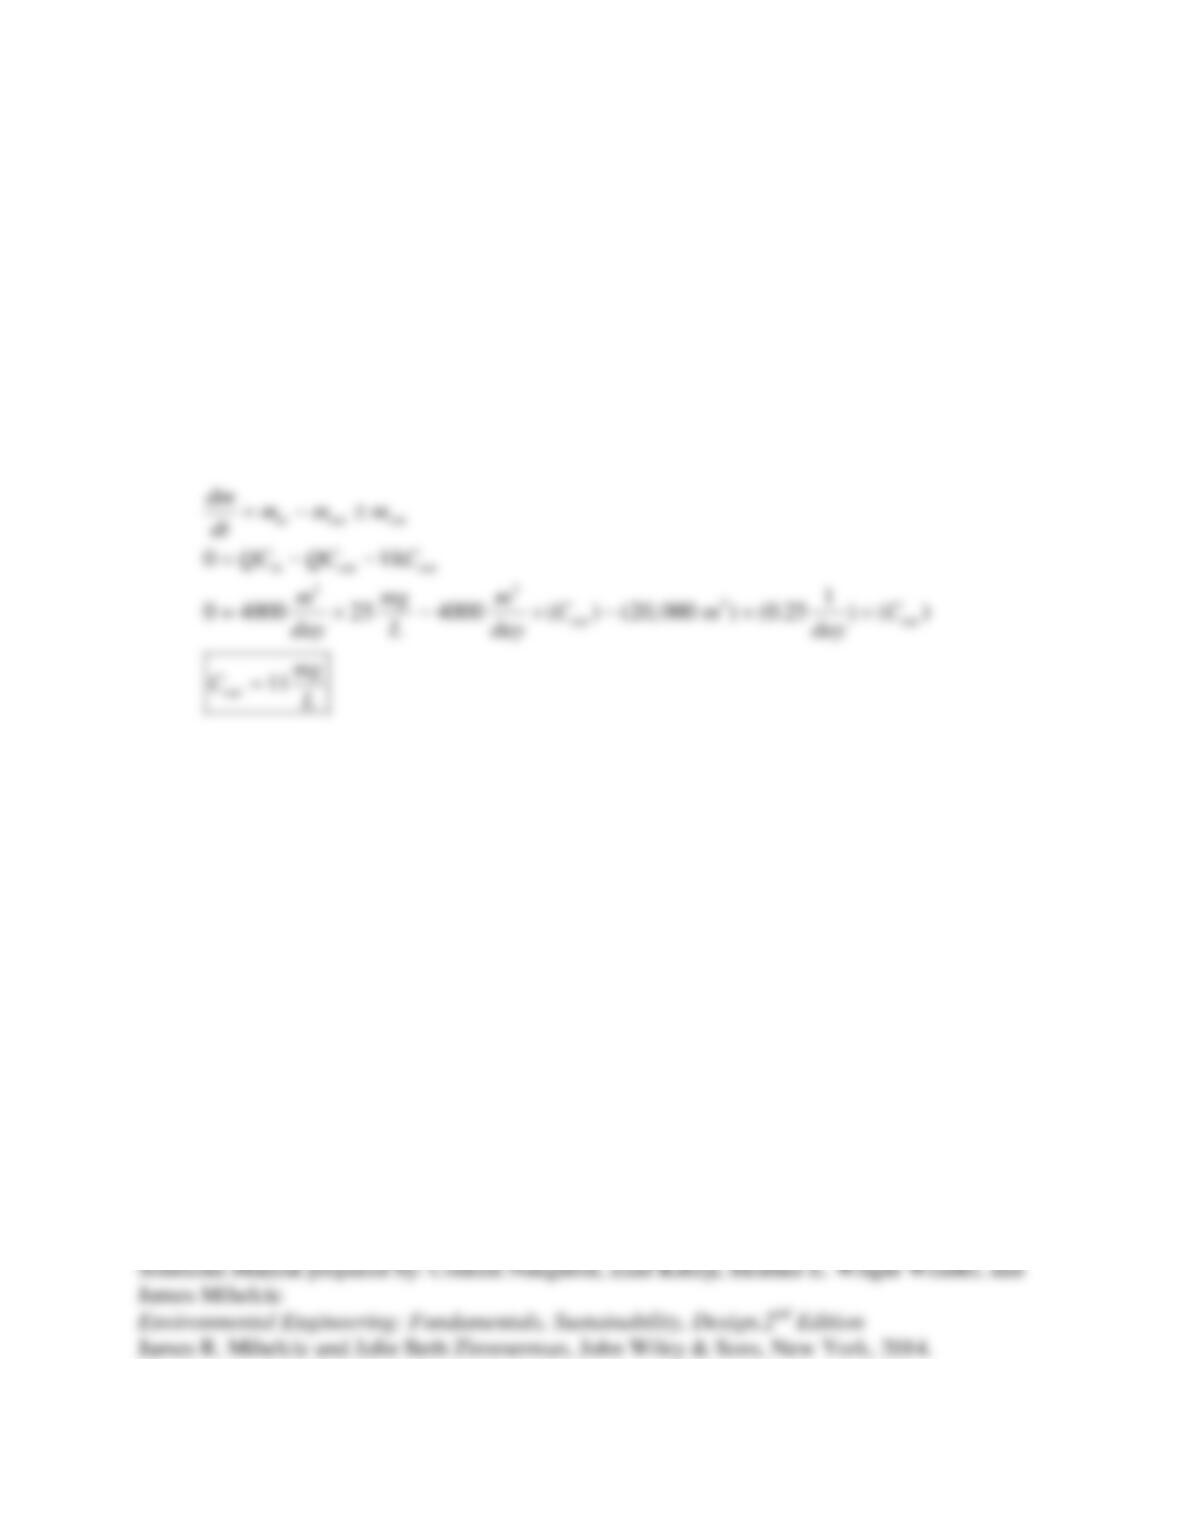
4.1 A waste stabilization pond is used to treat a dilute municipal wastewater before the liquid is
discharged into a river. The inflow to the pond has a flow rate of Q = 4,000 m3/day and a BOD
concentration of Cin = 25 mg/L. The volume of the pond is 20,000 m3. The purpose of the pond
is to allow time for the decay of BOD to occur before discharge into the environment. BOD de-
cays in the pond with a first-order rate constant equal to 0.25/day. What is the BOD
concentration at the outflow of the pond, in units of mg/L?
Solution:
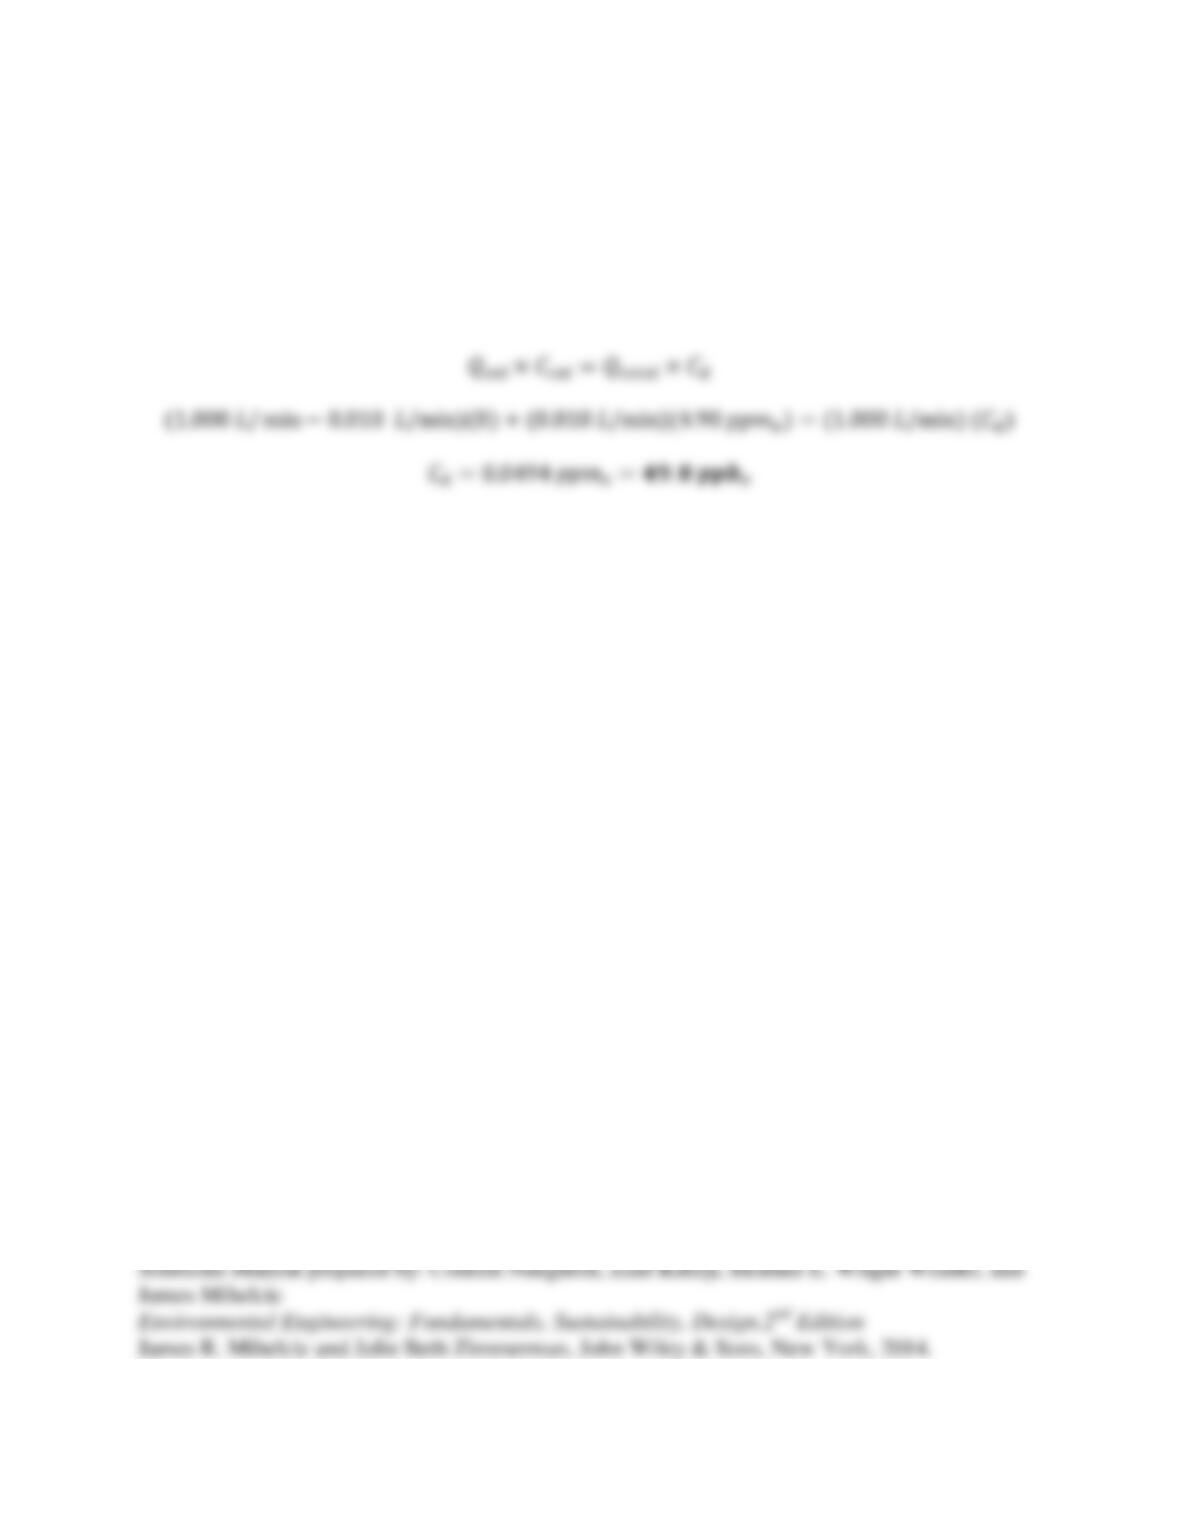
4.2 A mixture of two gas flows is used to calibrate an air pollution measurement instrument. The
calibration system is shown in Figure 4-23. If the calibration gas concentration Ccal is 4.90 ppmv,
the calibration gas flow rate Qcal is 0.010 L/min, and the total gas flow rate Qtotal is 1.000 L/ min,
what is the concentration of calibration gas after mixing (Cd)? Assume that the concentration
upstream of the mixing point is zero.
Solution:
4.3 Consider a house into which radon is emitted through cracks in the basement. The total
volume of the house is 650 m3 (assume that the volume is well mixed throughout). The radon
source emits 250 pCi/s (A picoCurie [pCi] is a unit proportional to the amount of radon gas and
indicates the amount of radioactivity of the gas). Air inflow and outflow can be modeled as a
flow of clean air into the house of 722 m3/h and an equal air flow out. Radon can be considered
to be conservative in this problem. (a) What is the retention time of the house? (b) What is the
steady-state concentration of radon in the house (units of pCi/L)?
Solution:
a)
3
3
650 0.90
722
Vm h
m
Q
h
θ
= = =
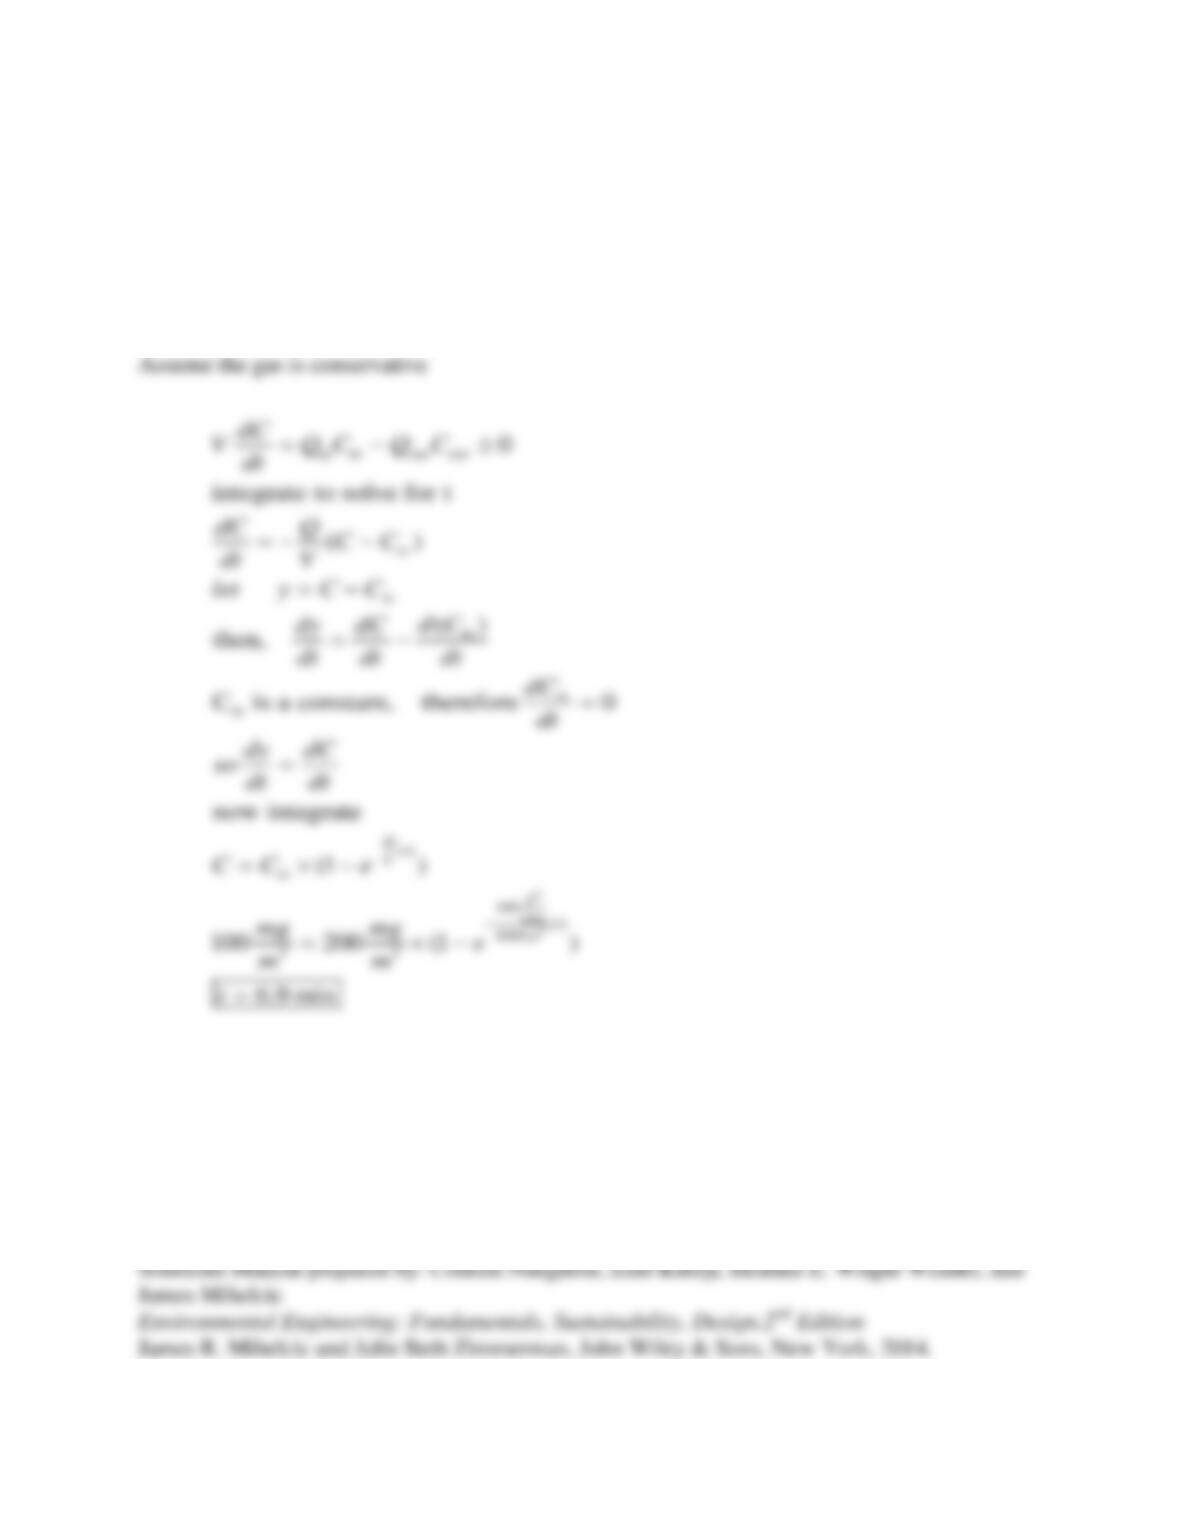
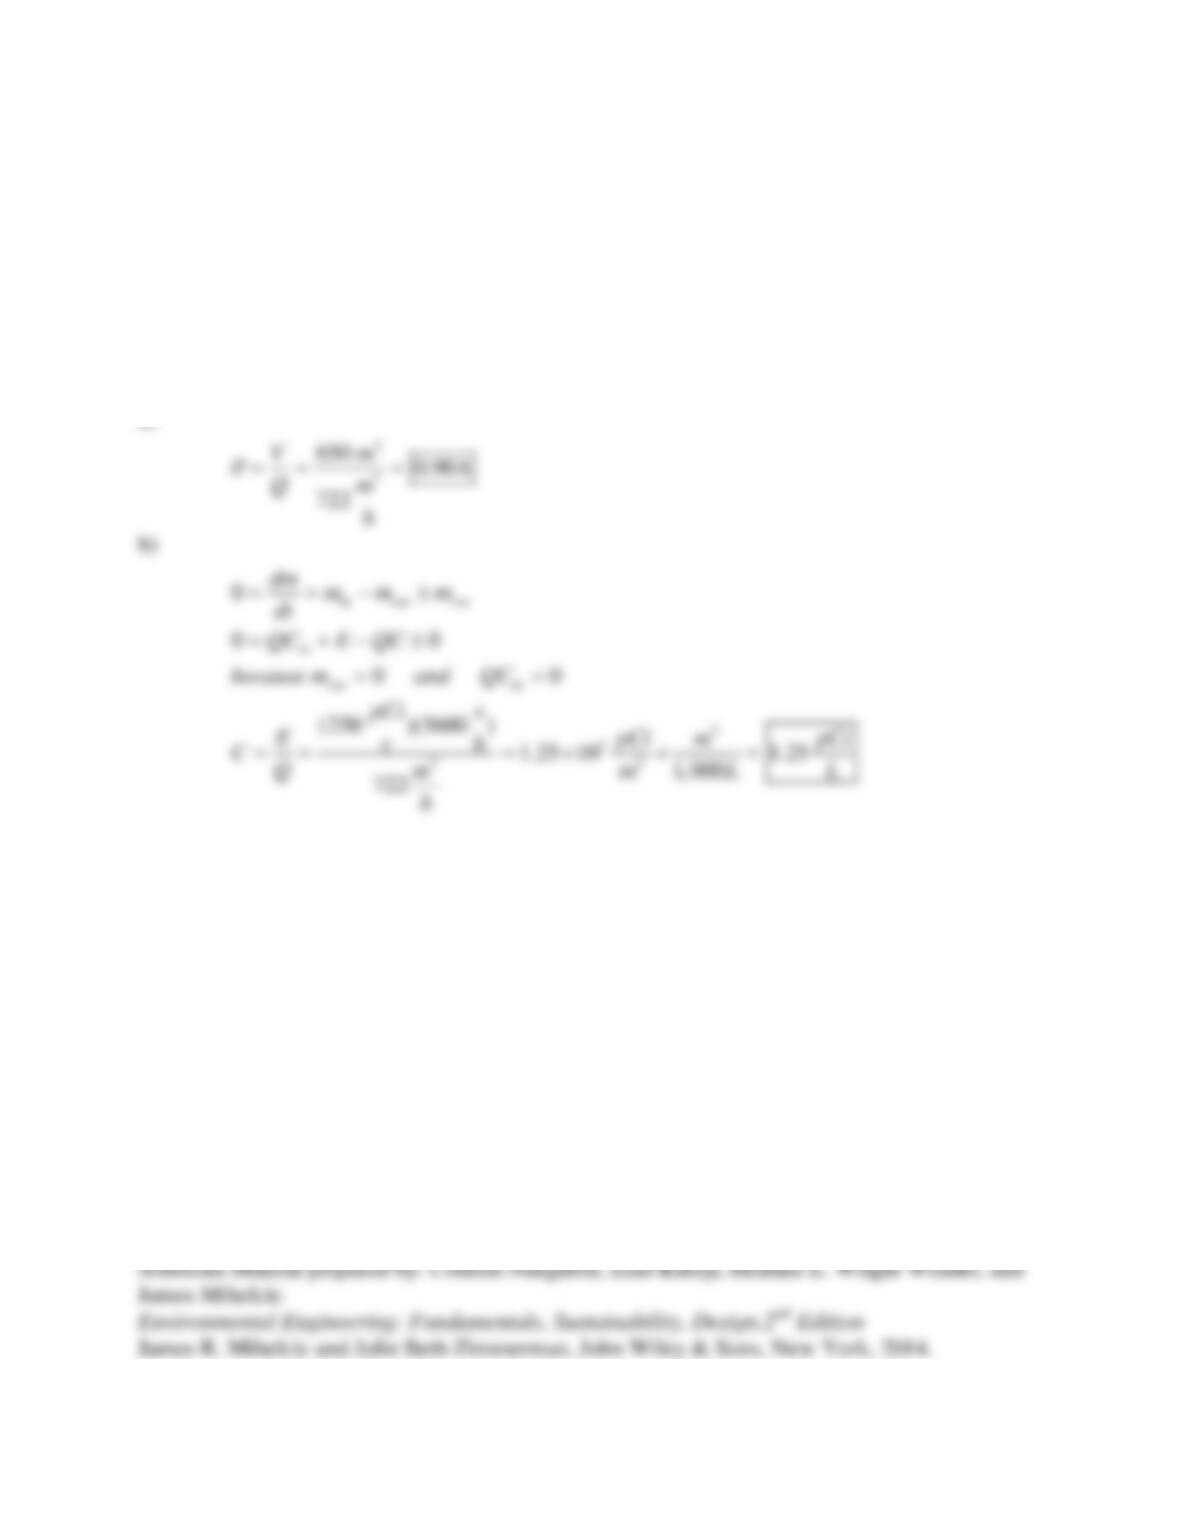
4.4 You are in an old spy movie, and have been locked into a small room (volume 1,000 ft3).
You suddenly realize that a poison gas has just started entering the room through a ventilation
duct. You are safe as long as the concentration is less than 100 mg/m3. If the ventilation air flow
rate in the room is 100 ft3/min and the incoming gas concentration is 200 mg/m3, how long do
you have to escape?
Solution:
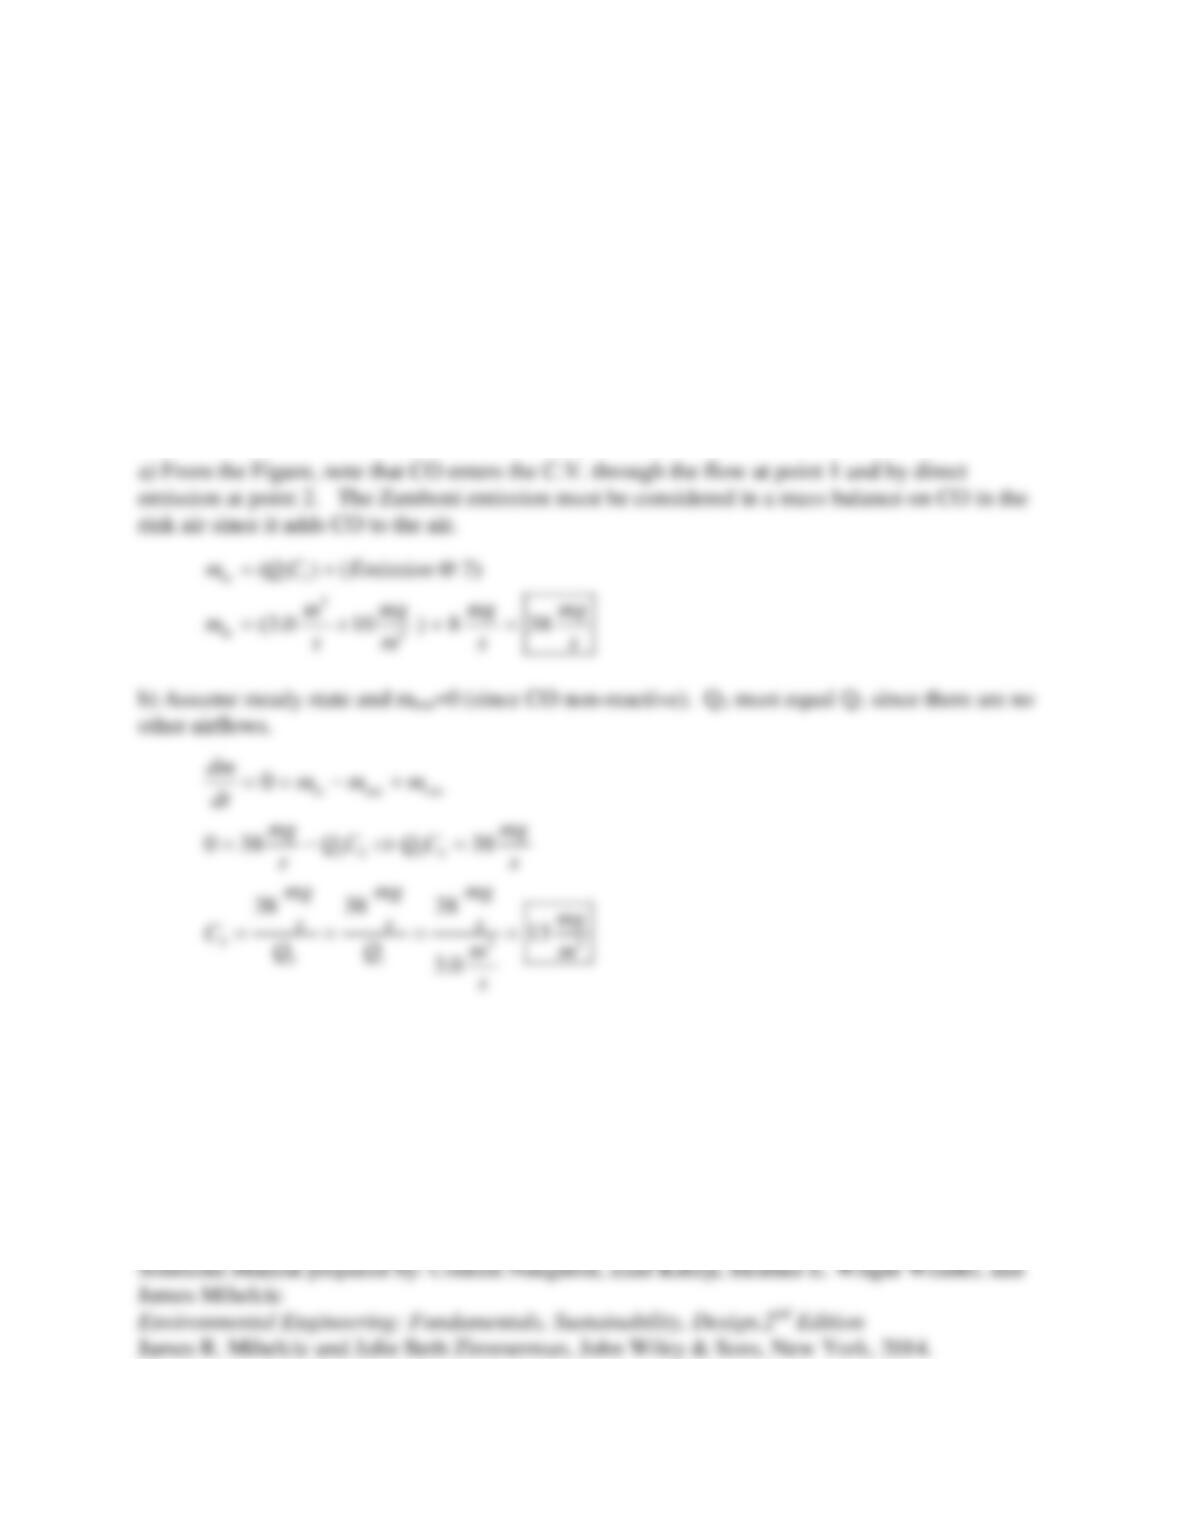
4.5 In the simplified depiction of an ice rink with an ice resurfacing machine operating (shown in
Figure 4-24), points 1 and 3 represent the ventilation air intake and exhaust for the entire ice
rink, and point 2 is the resurfacing machine’s exhaust. Conditions at each point are (C indicates
the concentration of carbon monoxide, CO): point 1: Q1=3.0 m3/s, C1=10 mg/m3; point 2:
emission rate = 8 mg/s of nonreactive CO; point 3: Q3, C3 unknown. The ice rink volume (V) is
5.0 x 10⁴ m3. (a) Define a control volume as the interior of the ice rink. What is the mass flux of
CO into the control volume, in units of mg/s? (b) Assume that the resurfacing machine has been
operating for a very long time, and that the air within the ice rink is well mixed. What is the
concentration of CO within the ice rink, in units of mg/m3?
Solution:
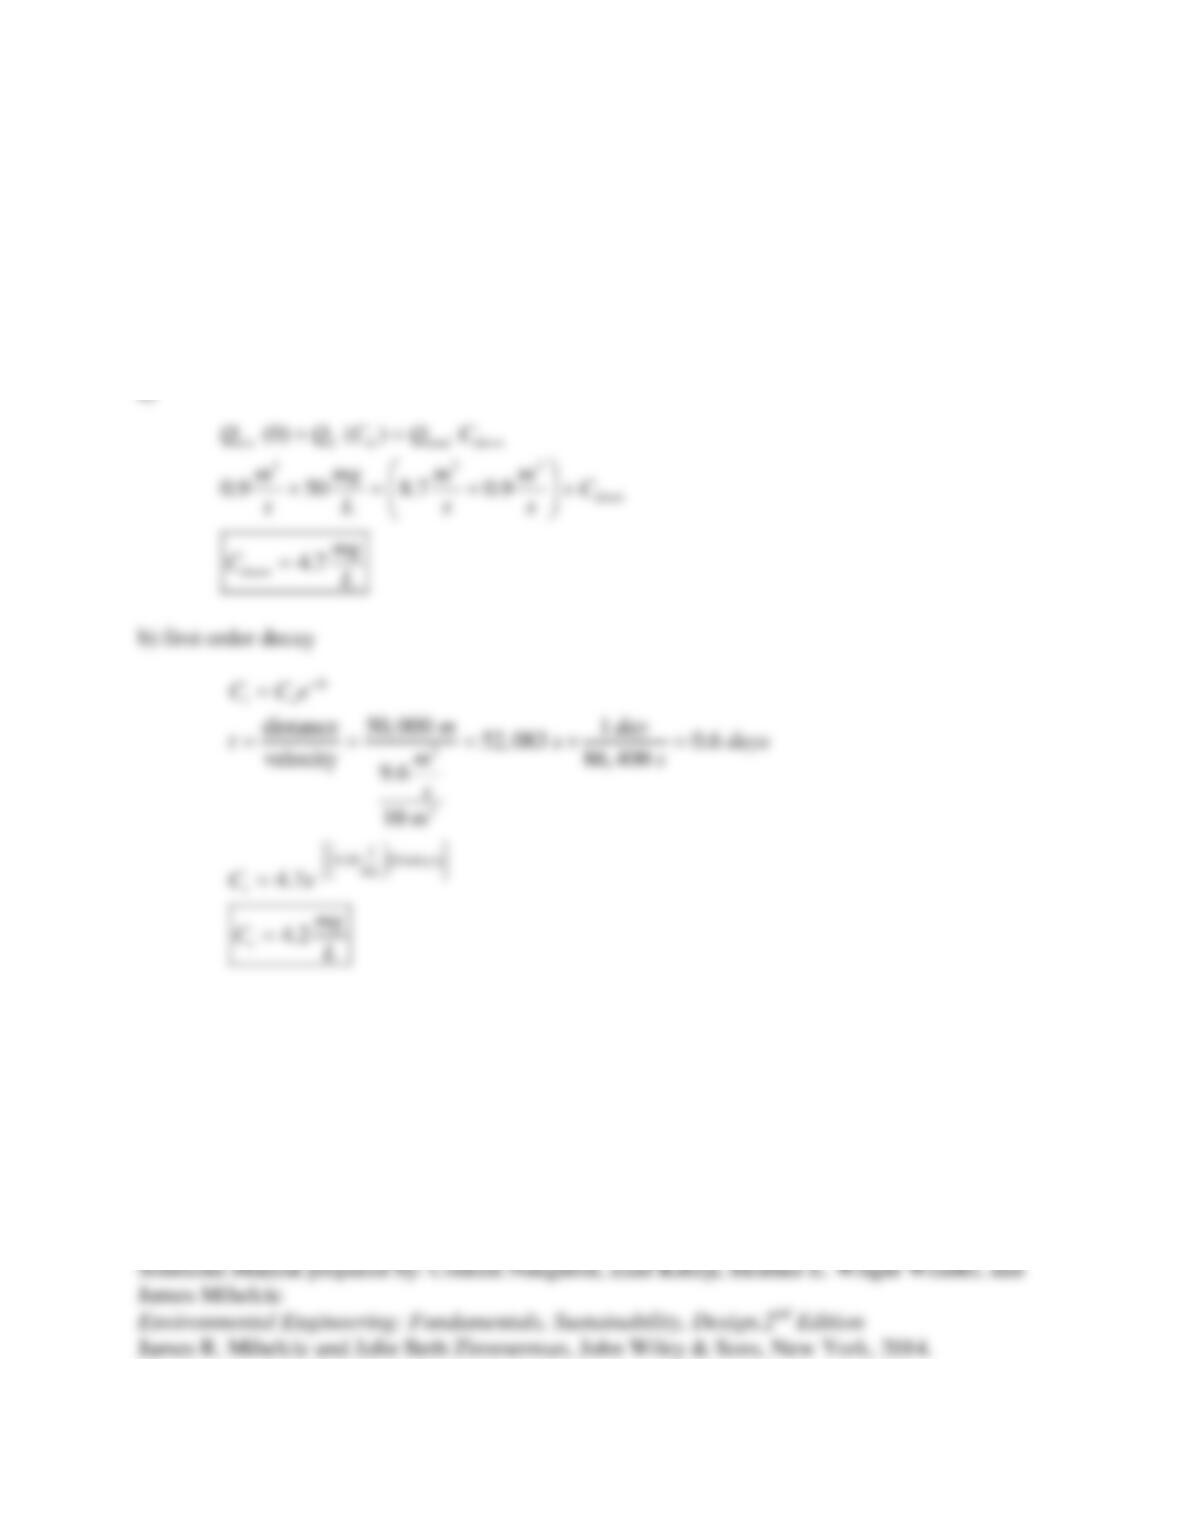
4.6 Poorly treated municipal wastewater is discharged to a stream. The river flow rate upstream
of the discharge point is Qu/s = 8.7 m3/s. The discharge occurs at a flow of Qd = 0.9 m3/s and has
a BOD concentration of 50.0 mg/L. Assuming that the upstream BOD concentration is
negligible. (a) What is the BOD concentration just downstream of the discharge point? (b) If the
stream has a cross-sectional area of 10 m2, what would the BOD concentration be 50 km
downstream? (BOD is removed with a first-order decay rate constant equal to 0.20/day.)
Solution:
a)
/
3 33
(0) ( )
0.9 50 8.7 0.9
4.7
u s d d total down
down
down
Q QC Q C
m mg m m C
sL s s
mg
CL
+=
×= + ×
=
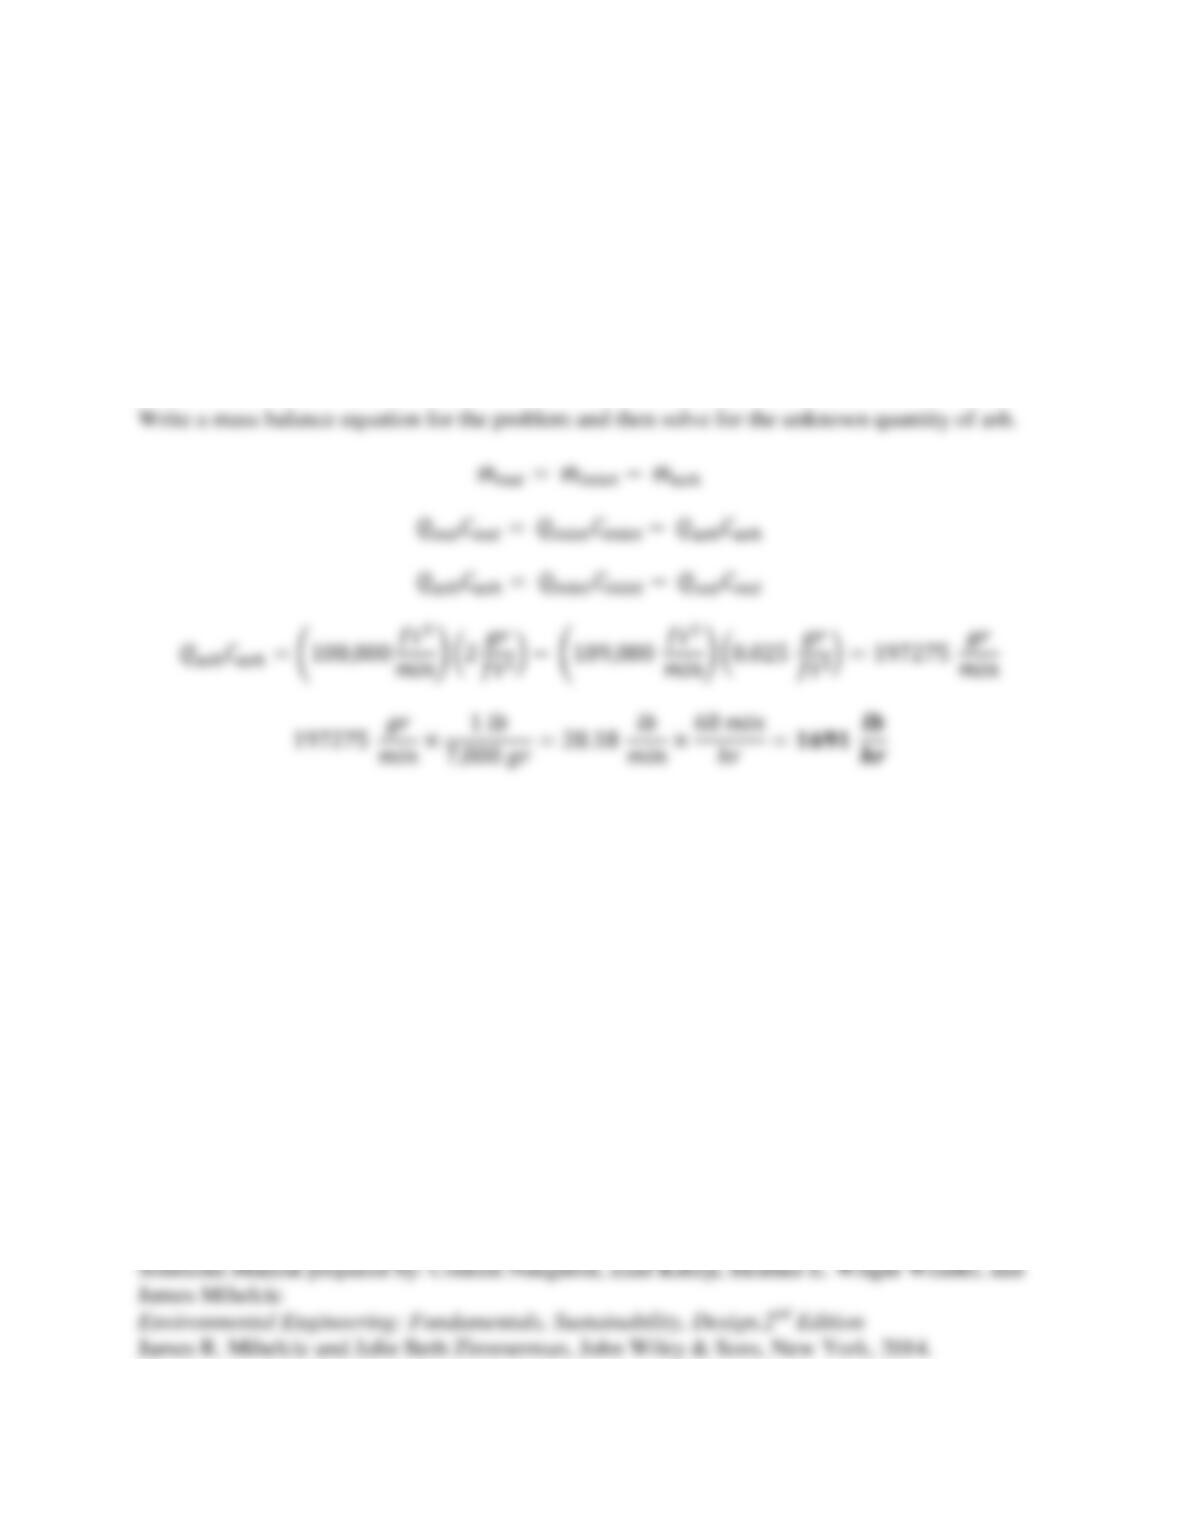
4.7 As shown in Figure 4.25, during an air emission test, the inlet gas stream to a fabric filter is
100,000 actual ft3/min (ACFM) and the particulate loading is 2 grains/actual cubic feet (ACF).
The outlet gas stream from the fabric filter is 109,000 actual ft3/min and the particulate loading is
0.025 grains/ actual ft3/min. What is the maximum quantity of ash that will have to be removed
per hour from the fabric filter hopper based on these test results? Assume that 7,000 grains of
particles equals 1 lb. (problem from EPA Air Pollution Training Institute,
http://www.epa.gov/apti/bces/)
Solution:
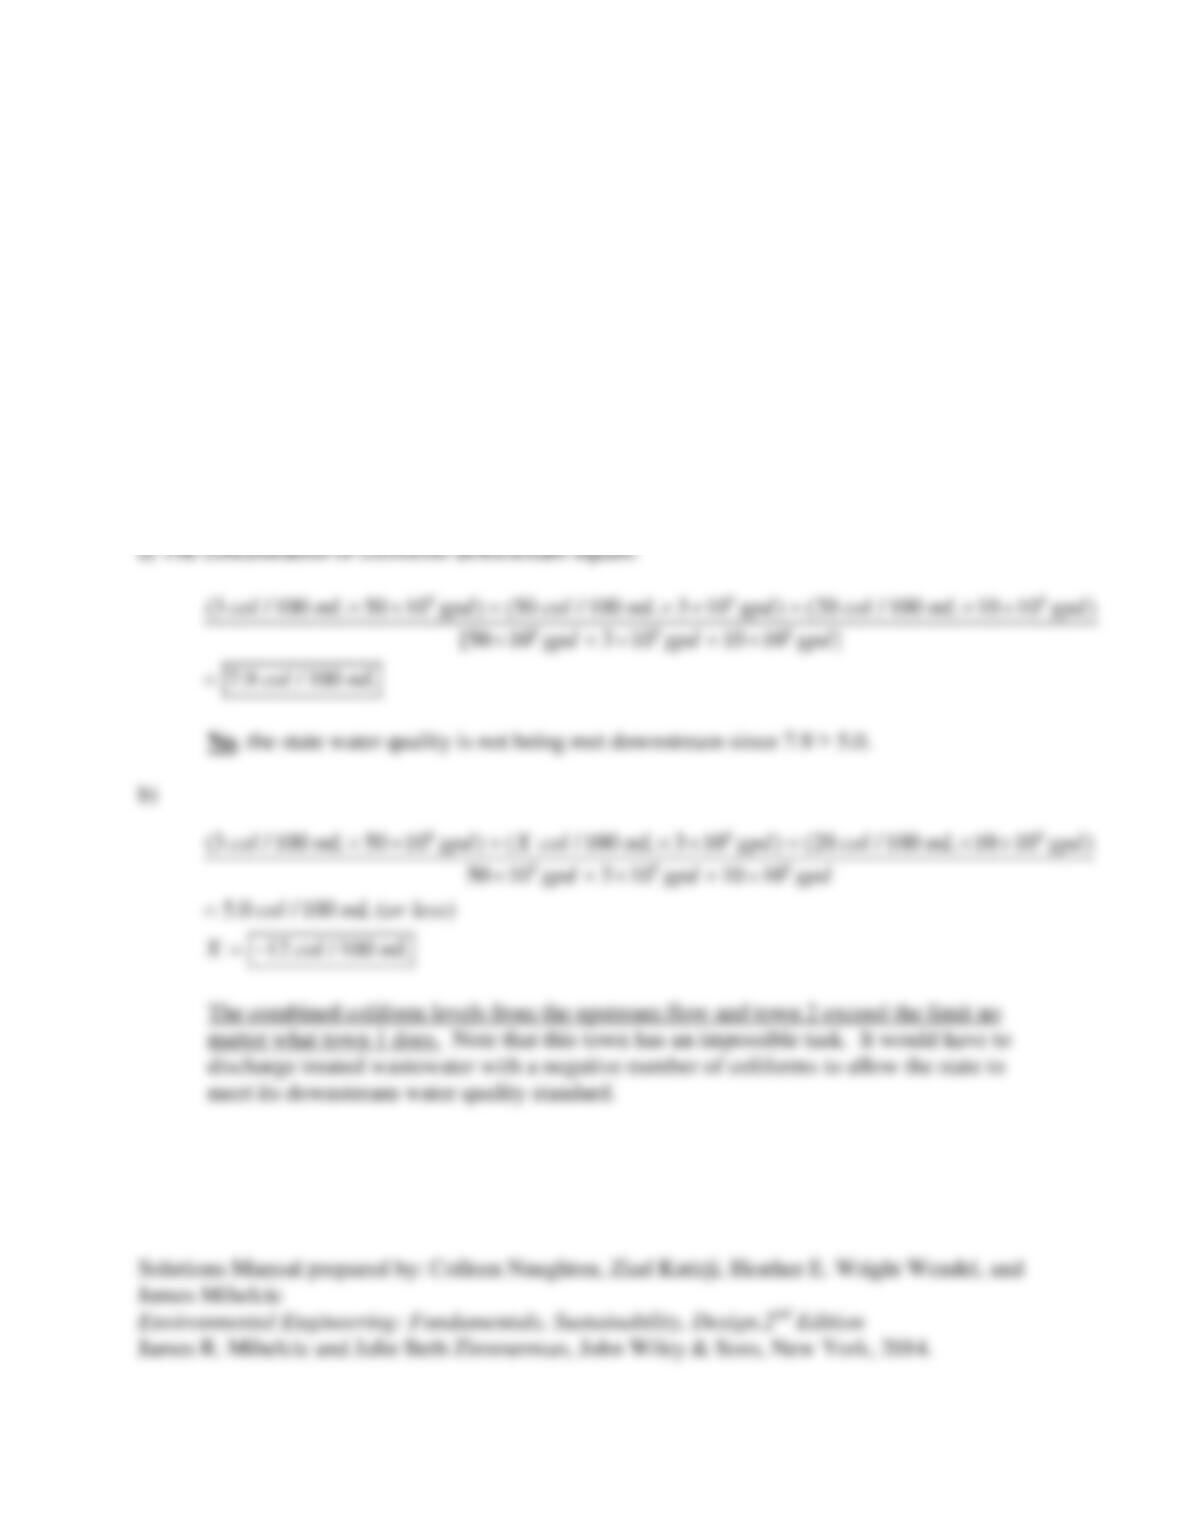
4.8 Two towns, located directly across from each other, operate municipal wastewater–treatment
plants that are situated along a river. The river flow is 50 million gallons per day (50 MGD).
Coliform counts are used as a measure to determine a water’s ability to transmit disease to
humans. The coliform count in the river upstream of the two treatment plants is 3 coliforms/l00
mL. Town 1 discharges 3 MGD of wastewater with a coliform count of 50 coliforms/100 mL,
and town 2 discharges 10 MGD of wastewater with a coliform count of 20 coliforms/100 mL.
Assume that the state requires that the downstream coliform count not exceed 5 coliforms/ 100
mL. (a) Is the state water-quality standard being met downstream? (Assume that coliforms do
not die by the time they are measured downstream.) (b) If the state standard downstream is
not met, the state has informed town 1 that they must treat their sewage further so the
downstream standard is met. Use a mass–balance approach to show that the state’s request is
unfeasible.
Solution: