37
P5–12 Continued
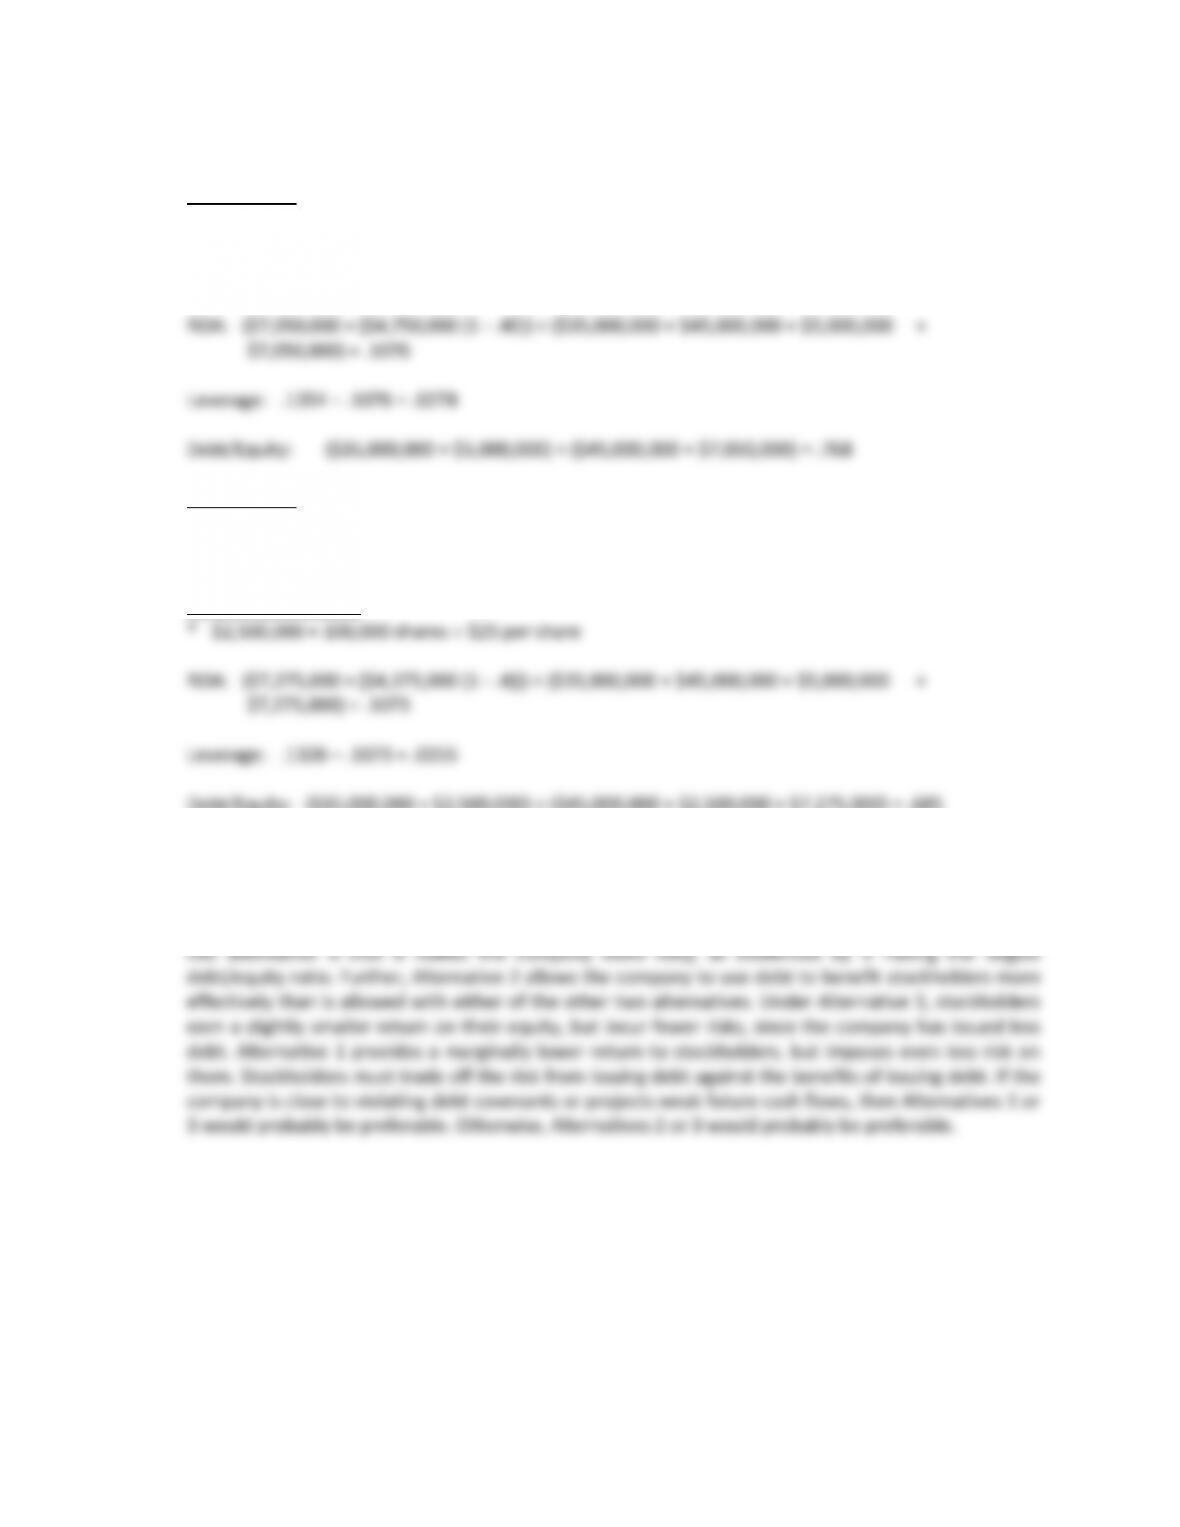
Alternative 2
EPS: $7,050,000 ÷ 2,000,000 shares = $3.53
ROE: $7,050,000 ÷ ($45,000,000 + $7,050,000) = .1354
Alternative 3
EPS: $7,275,000 ÷ (2,000,000 shares + 100,000 shares) = $3.46
ROE: $7,275,000 ÷ ($45,000,000 + $2,500,000* + $7,275,000) = .1328
Debt/Equity: ($35,000,000 + $2,500,000) ÷ ($45,000,000 + $2,500,000 + $7,275,000) = .685
b. Alternative 2 prevents a dilution of the stockholders’ position. Since this alternative did not require any
additional shares of stock to be issued, it provides the largest earnings per share. Alternative 2 allows
the company to more effectively manage its stockholders’ investment, as evidenced by return on
equity, and all investments, as evidenced by return on assets. The only potentially serious drawback of
38
P5–12 Concluded
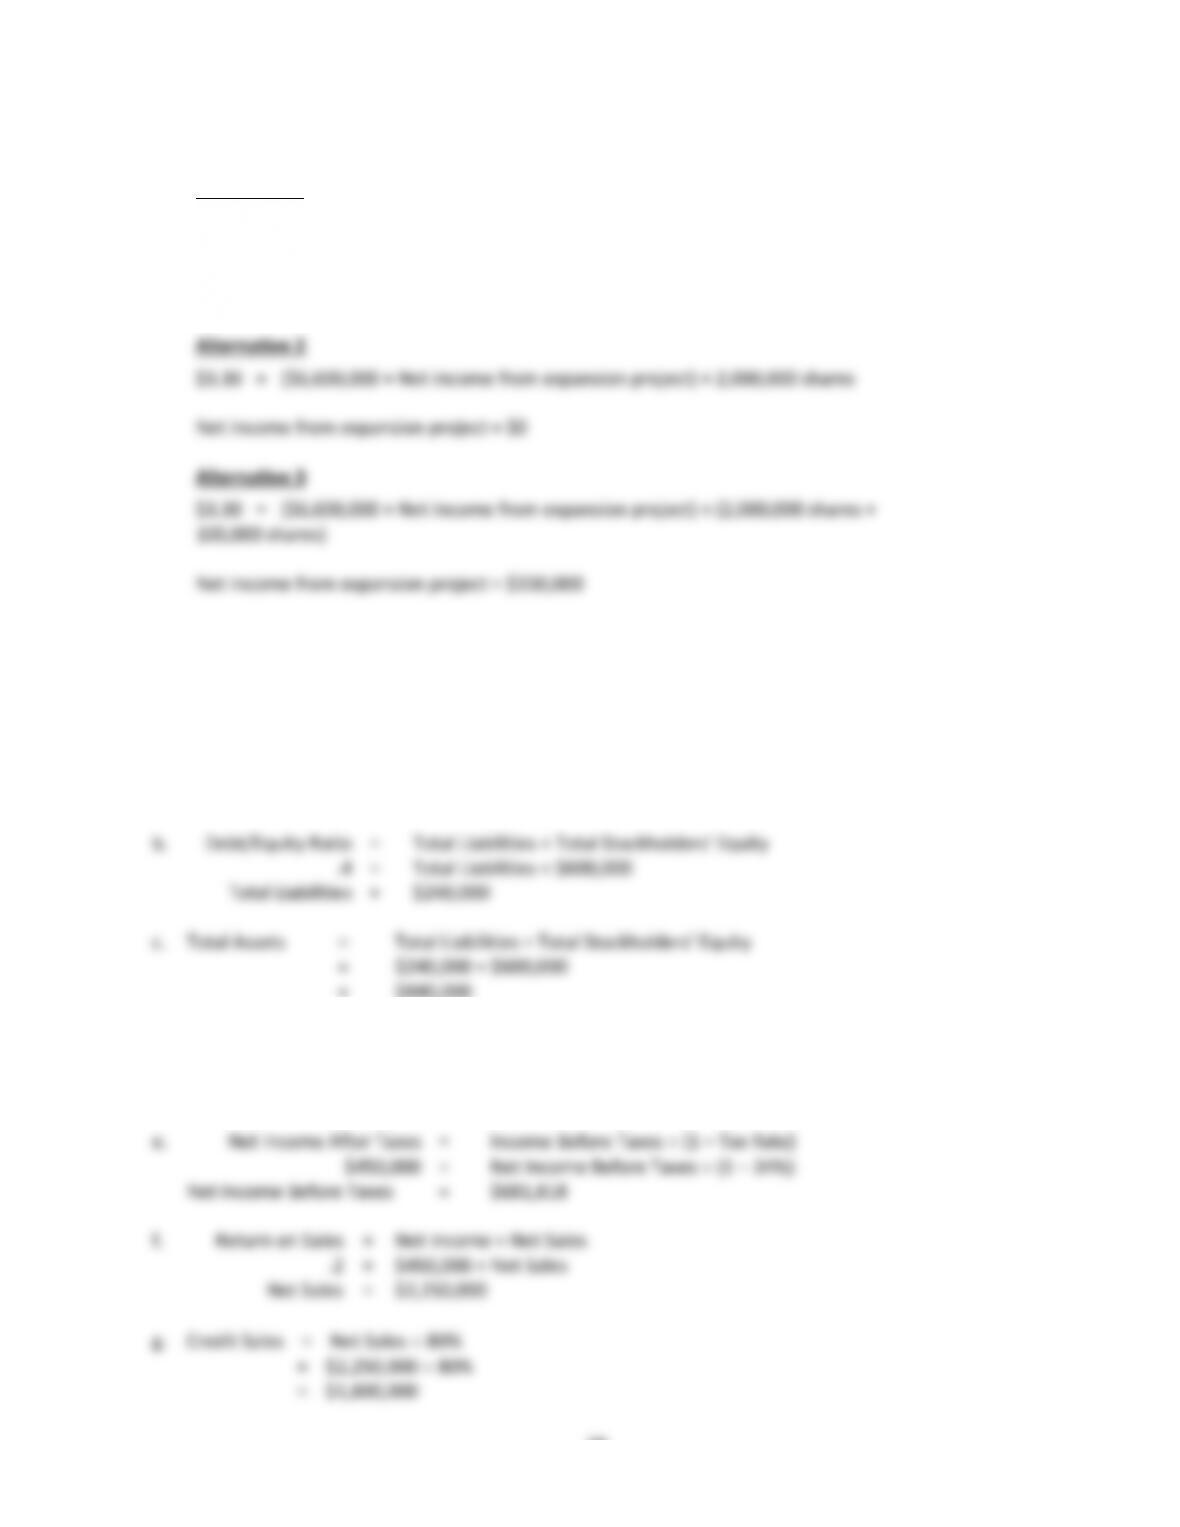
c. Alternative 1
$3.30 = ($6,600,000 + Net income from expansion project) ÷ (2,000,000 shares +
200,000 shares)
Net income from expansion project = $660,000
P5–13
Note: Although some ratios use average balances, year-end balances were used in the ratios as directed
in the problem.
a. Return on Equity = Net Income ÷ Total Stockholders‘ Equity
.75 = $450,000 ÷ Total Stockholders’ Equity
Total Stockholders’ Equity = $600,000
= $840,000
d. Return on Assets = (Net Income + Interest Expense) ÷ Total Assets
.65 = ($450,000 + Interest Expense) ÷ $840,000
Interest Expense = $96,000
39
P5–13 Concluded
h. Receivables Turnover = Net Credit Sales ÷ Accounts Receivable
25 = $1,800,000 ÷ Accounts Receivable
Accounts Receivable = $72,000
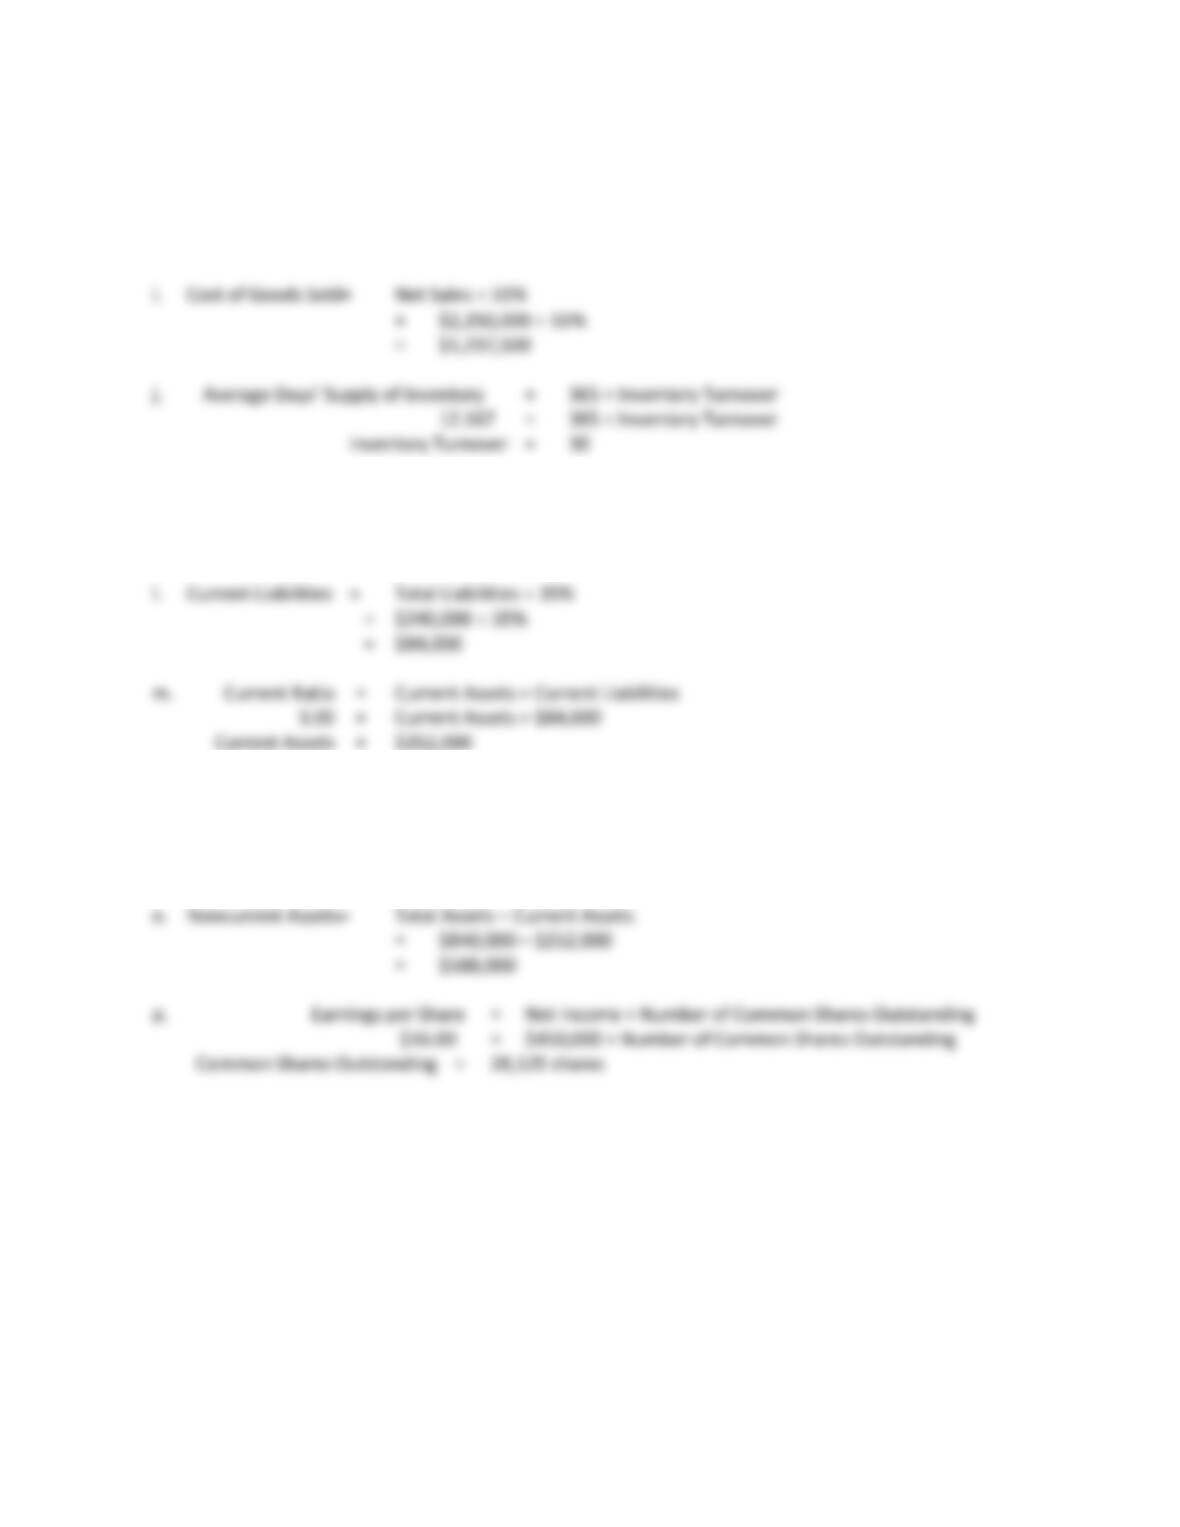
k. Inventory Turnover = Cost of Goods Sold ÷ Inventory
30 = $1,237,500 ÷ Inventory
Inventory = $41,250
n. Quick Ratio = (Cash + Accounts Receivable + Mkt. Securities) ÷ Current
Liabilities
2.0 = ($68,000 + $72,000 + Marketable Securities) ÷ $84,000
Marketable Securities = $28,000
P5–14
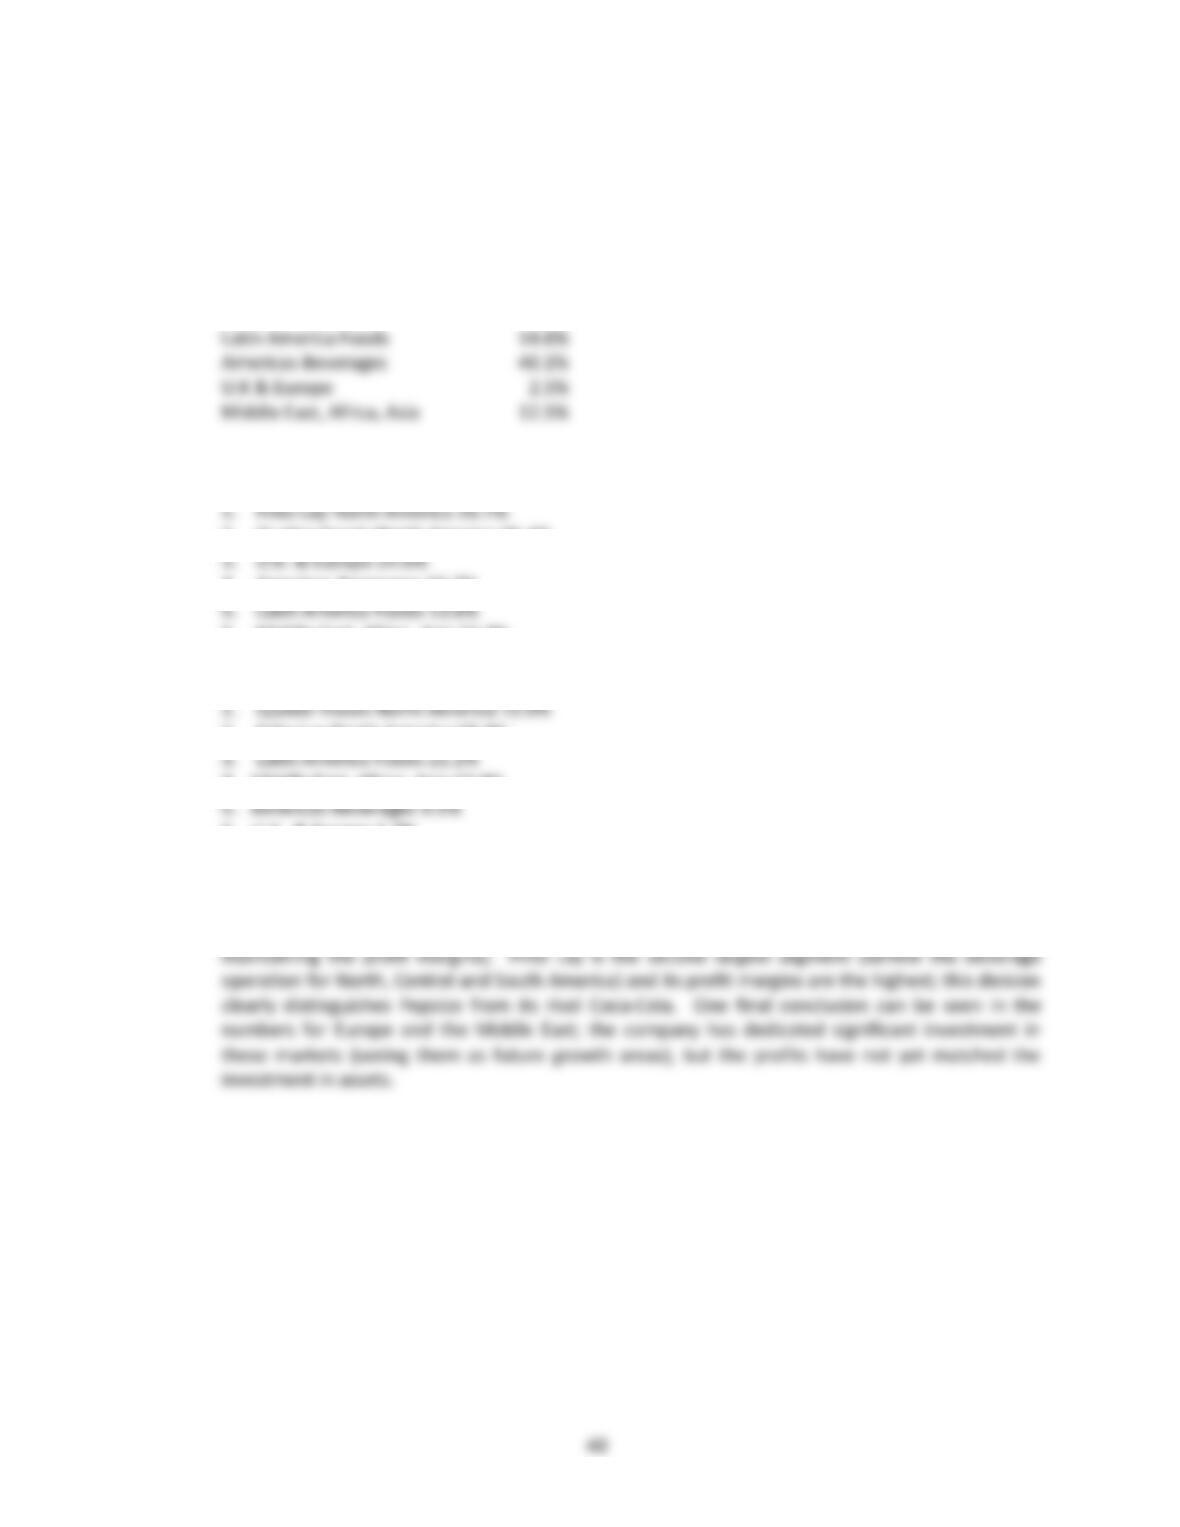
a. Total Revenues equal $53,395 with the percentage breakdown as follows:
Frito Lay North America 25.4%
Quaker Foods North America 4.9%
b. Ranking the segments on profit margin (Profits/Revenues) yields:
2. Quaker Foods North America 26.4%
4. Americas Beverages 13.7%
6. Middle East, Africa, Asia 11.2%
c. Ranking the segments on Return on Assets (Profits/Assets) yields:
2. Frito Lay North America 68.4%
4. Middle East, Africa, Asia 13.0%
6. U.K. & Europe 1.7%
d. Quaker Foods is the second smallest of the segments, but it is one of the most profitable. Pepsico’s
management should focus efforts on growing the Quaker Oats business in terms of revenue (while
41
P5–15
The ratios for the 2012 Unilever statements are:
a. ROE Net Income/Average Stockholders’ Equity
4,948/15,318.5 = 32.3%
ROA [Net Income + (1 – Tax Rate)x (Interest Expense)]/Average Total Assets
[4,948 + (1 – .26)(526)]/46,839 = 11.4%
Capital Structure Leverage Average Total Assets/Average Stockholders’ Equity
46,839/ 15,318.5 = 3.06
Debt/Equity Ratio Average Total Liabilities/Average Stockholders’ Equity
31,520.5/15,318.5 = 2.06
Interest Coverage (Net Income + Tax Expense + Interest Expense)/Interest Expense
(4,948 + 6,683 + 526)/526 = 23.1
Accounts Payable Turnover Cost of Goods Sold*/Average Accounts Payable
30,703/11,319.5 = 2.71
365 days/2.71 times = 134.7 days
42
P5–15 Concluded
*Cost of Goods Sold found in footnotes
Based on the Current and Quick Ratios, the company will have to look to the conversion of long-term assets
to Cash (from either operating those assets or liquidating them) to satisfy current liabilities. The company
b. As demonstrated in the ROE Model, Return on Equity is driven by Return on Assets, Capital Structure
Leverage and Common Equity Leverage. Although the 2010 numbers are not provided (for 2011 averages),
it appears that Equity levels are up, while Liabilities levels are down—meaning that Unilever has
43
ISSUES FOR DISCUSSION
ID5–1
(1) Bank of America (2) Bed, Bath & Beyond (3) HP (4) Kelly Services
Bank of America is Company #1. As a commercial bank, B of A generates service revenue (see Income
Statement) and carries receivables (loans) that are funded by deposits (current liabilities on the balance
sheet). Banks also are highly leveraged; Company #1 has the lowest equity of the four companies shown.
ID5–2
(1) General Electric (2) EchoStar (3) Walgreen’s (4) Campbell’s Soup
General Electric is Company #1. GE operates as both a manufacturer and a diversified financial services
firm, generating both sales and service revenue. The financial services business, similar to Bank of America
in ID5-1, will carry a significant amount of receivables.
ID5–3
Book value (stockholders’ equity) is a GAAP number that is derived from accounting values that may not
reflect current market prices. For example, the book value of a company might include fixed assets that
were purchased many, many years ago and were recorded on the books at historic costs; if market values
ID5–4
(a) A consensus earnings forecast is the most common or average earnings forecast by Wall Street
analysts. Companies wish to consistently beat the estimates because, in general, the stock of their
company tends to go higher as they beat the consensus estimate. If a company misses a forecast then
analysts could downgrade the stock and the stock price could fall.
ID5–5
(a) It is likely that analysts saw Kodak’s move coming. Analysts closely monitor industry conditions and
technological changes and therefore understood that digital photography was the future. Pinpointing
the exact dollar amount of the charge, however, would be more difficult for the analysts.
Management, with its access to all the data and numbers of the company, is in a much better position
(b) Management of Kodak was taking all of the bad news at once. By booking the entire restructuring
expense at the date of the announcement, and not as the payments are made, is a move companies
take to show all the negatives today, holding the positives for the future. The thought is that the
(d) Several cases of companies facing technological obsolescence exist. For example, network television
companies such as ABC, NBC and CBS are vulnerable to the advances of cable and satellite television
providers. Companies specializing in the delivery of documents such as Federal Express and UPS (as
ID5–6
Staples might want to separate the losses from its dot-com operations in order to help maintain a high
stock price. By excluding the losses from the dot-com operation Staples will be reporting a higher net
income. This will tend to have a positive effect on its stock price. This is especially true if its competitors
include similar types of losses in their reported income.
ID5–7
A stock price that has already fallen dramatically has less risk than one that is trading at its all time high. A
number of investors have already sold the stock and as the stock price falls there may be other investors
who become interested in the stock. A falling stock price could also be reflecting that short sellers of the
stock have been knocking the price down. Short sellers eventually have to buy back the shares that they
46
An increase in discretionary expenditures like research and development would be a strong statement by
management that future business seems to be in very good shape. If management did not have a positive
view on future sales then it probably would not increase spending in areas that were not critical.
ID5–8
a. An efficient market implies that all information about a company is reflected in the price of the
company’s stock as soon as the information becomes available to the public. Since the information in
financial reports is available to the public, market efficiency implies that as soon as the financial report
is made public, all the information in the report is reflected in the company’s stock price. Thus,
ID5–9
Intangibles refer to the many assets that do not have physical characteristics. The majority of these are not
recorded on the balance sheet of a company. A very valuable intangible asset that is not shown on the
balance sheet is the brand name of a company. Examples of these would be the Coca-cola name, the Nike
47
ID5–10
Buffett is making the case that the reaction of a weak management to a difficult operating environment is
to try and slide through by using questionable accounting measures to make up for poor performance. A
strong management would be able to work through the difficult times and not have to fudge the
accounting numbers. Evaluating how management handles adversity is probably a good indicator of which
companies will perform the best during good times.
ID5–11
a. Receivables turnover and inventory turnover are the two ratios that probably best capture the
suggested indicators.
b. Inventory turnover is calculated as cost of goods sold divided by average inventory, and receivables
turnover is calculated as net credit sales divided by average accounts receivable. A decreasing
inventory turnover means that the company is taking longer to sell its inventory. Similarly, a
decreasing receivables turnover means that the company is taking longer to collect its receivables.
Both ratios have implications for solvency and earning power. If a company is turning over its
ID5–12
48
Theoretically, the price of a company’s stock equals the present value of the stock market’s expectations of
ID5–13
a. Many of the Internet companies that became publicly-traded in the 1990s ended in failure. The
researchers were suggesting that a similar problem might happen again in the future with the 2007
companies going public before establishing themselves as profitable businesses.
ID5–14
The case asks you to assess Eli Lilly’s financial statements using the ROE model. Relevant ratios for Lilly are
calculated below: (tax rate equals 24%; interest expense taken from the footnotes equals $171.9 million in
2012 and $167.4 million in 2011)
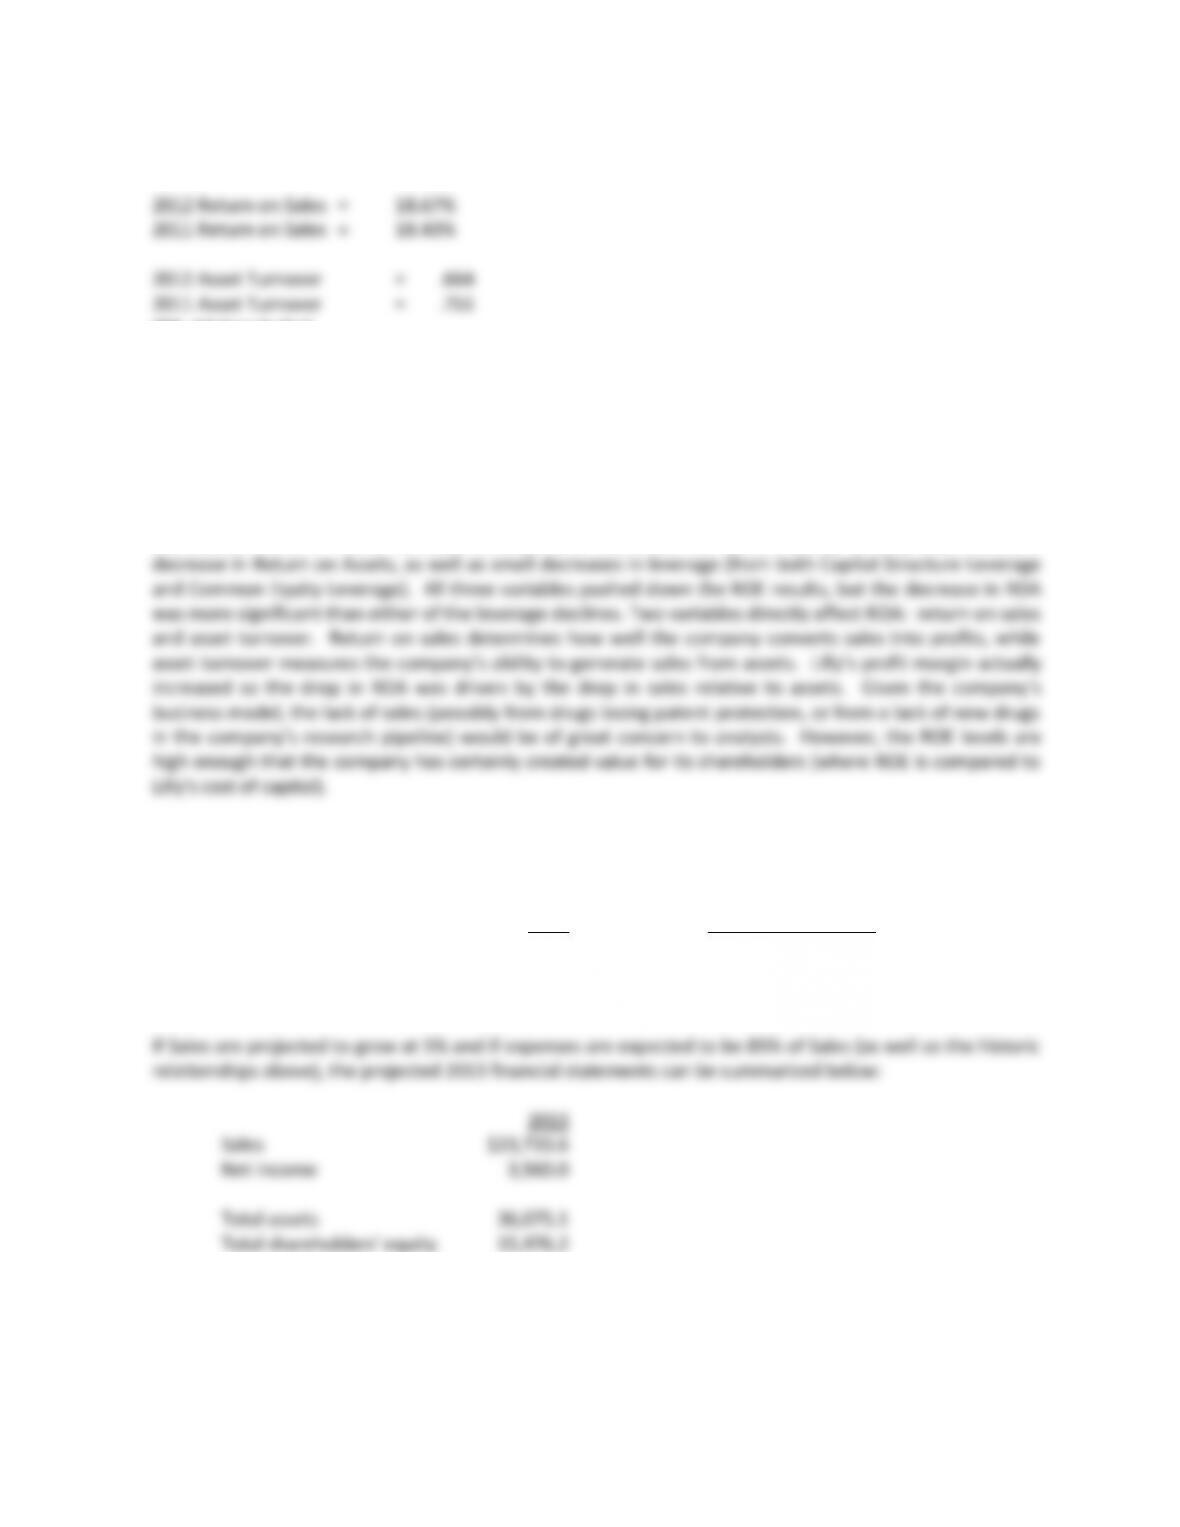
2012 Return on Equity = 28.9%
2011 Return on Equity = 33.5%
49
2011 .335 = .138 x .972 x 2.49
ID5–14 Concluded
ROA = P.M. x A.T.
2012 .124 = .1867 x .664
2011 .138 = .1843 x .751
From 2011 to 2012, Eli Lilly experienced a drop in Return on Equity from over 33 percent to approximately
29 percent. The ROE model can be used to pinpoint the variable(s) that is(are) driving the change in
shareholder return. Three variables directly feed into ROE. As shown above, Eli Lilly experienced a
ID5–15
2012 Historic Relationship
Sales $22,603.4 NA
Total Assets 34,398.9 1.52 times Sales
Total Liabilities 19,625 57.1% of Assets
ID5–16
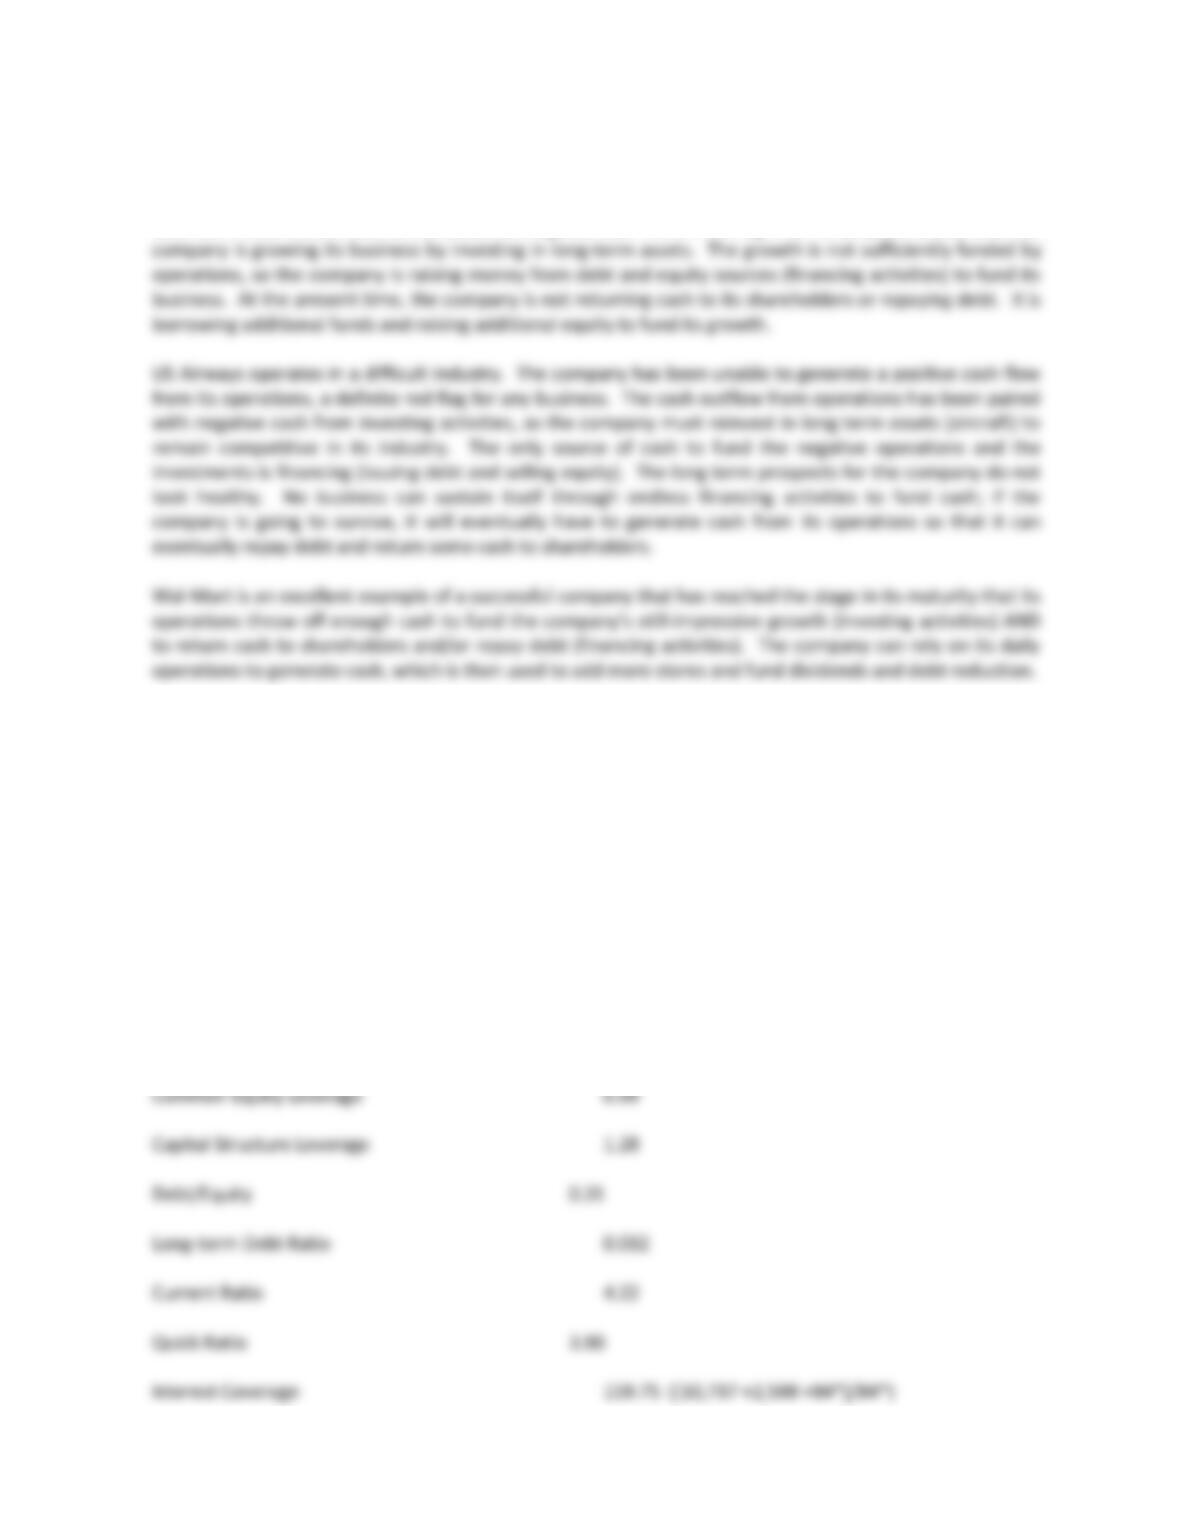
Profile #1 – EchoStar Profile #2 – US Airways Profile #3 – Wal-Mart
50
EchoStar is a relatively new company with a relatively new product. The company has been growing, as
more consumers switch from traditional and cable television services to satellite television. The growth of
the company has generated positive cash from operations. However, the company has had to take that
cash and invest it back into its business; the negative cash from investing in all three years shows that the
ID5–17
a)
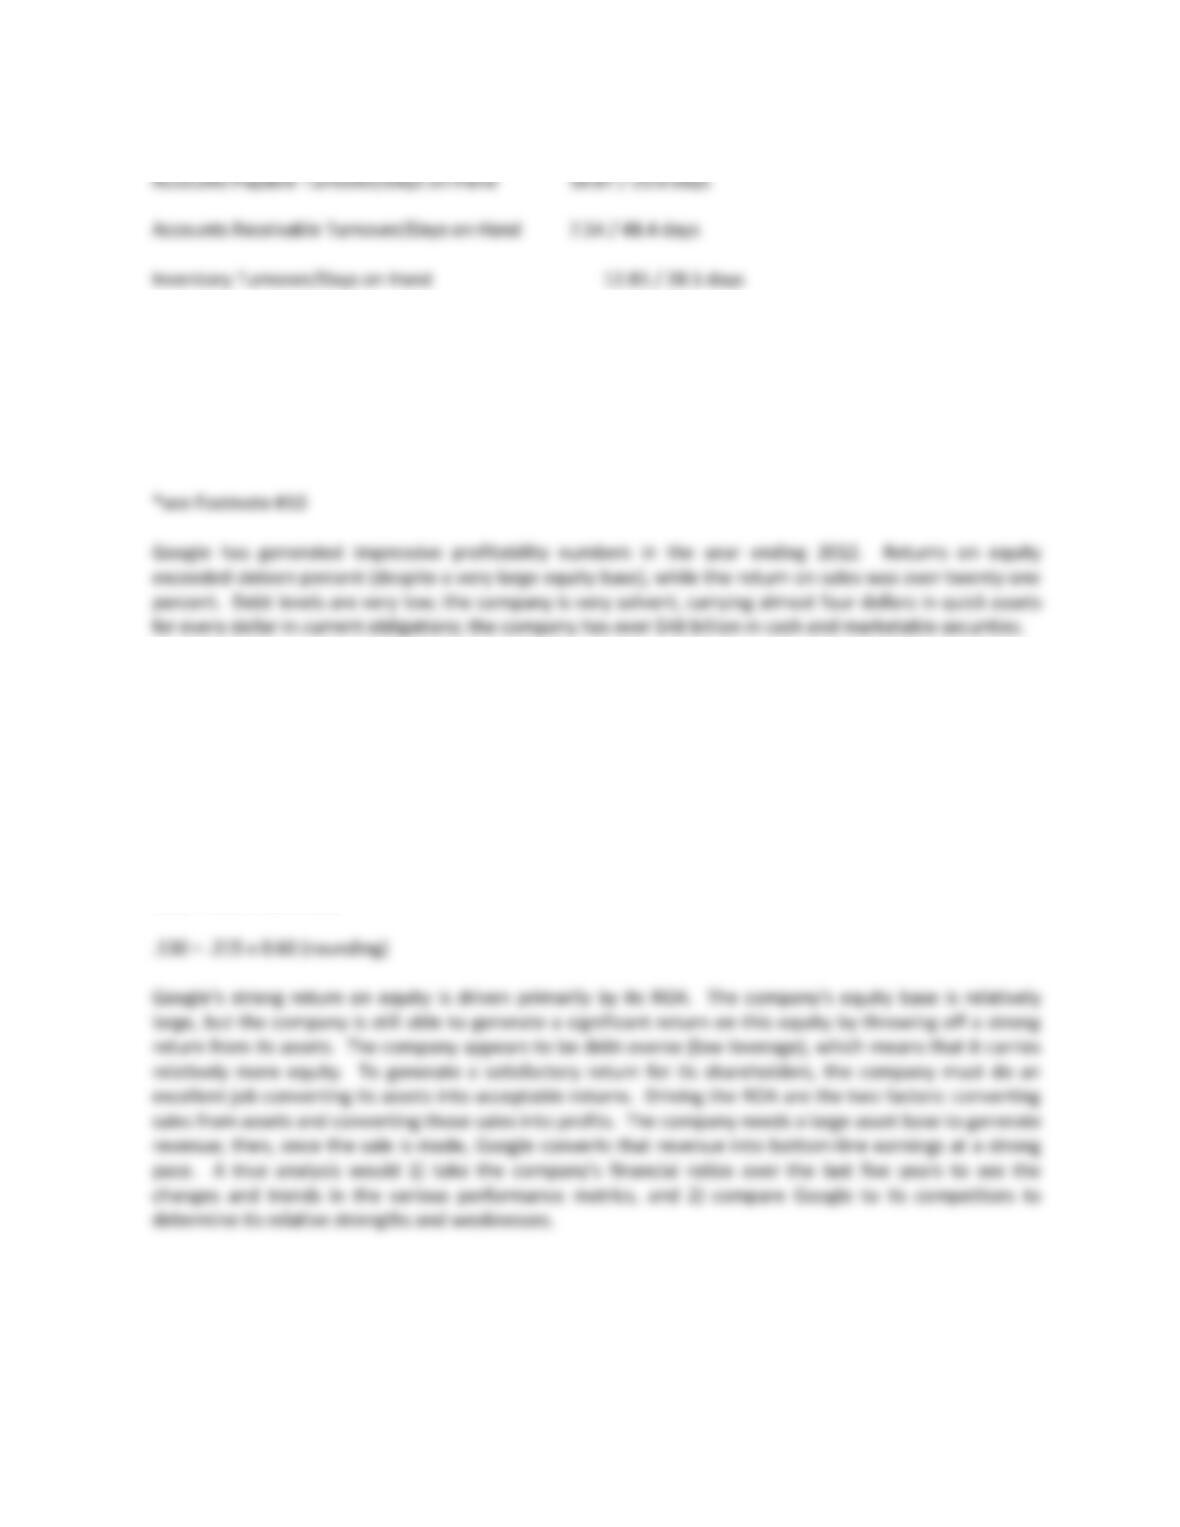
Financial ratios for Google are outlined below: (tax rate = 19%)
2012
Return on Equity 16.5%
Return on Assets 13.0%
Return on Sales 21.5%
51
ID5–17 Continued
Fixed Asset Turnover 4.68
Asset Turnover 0.60
b)
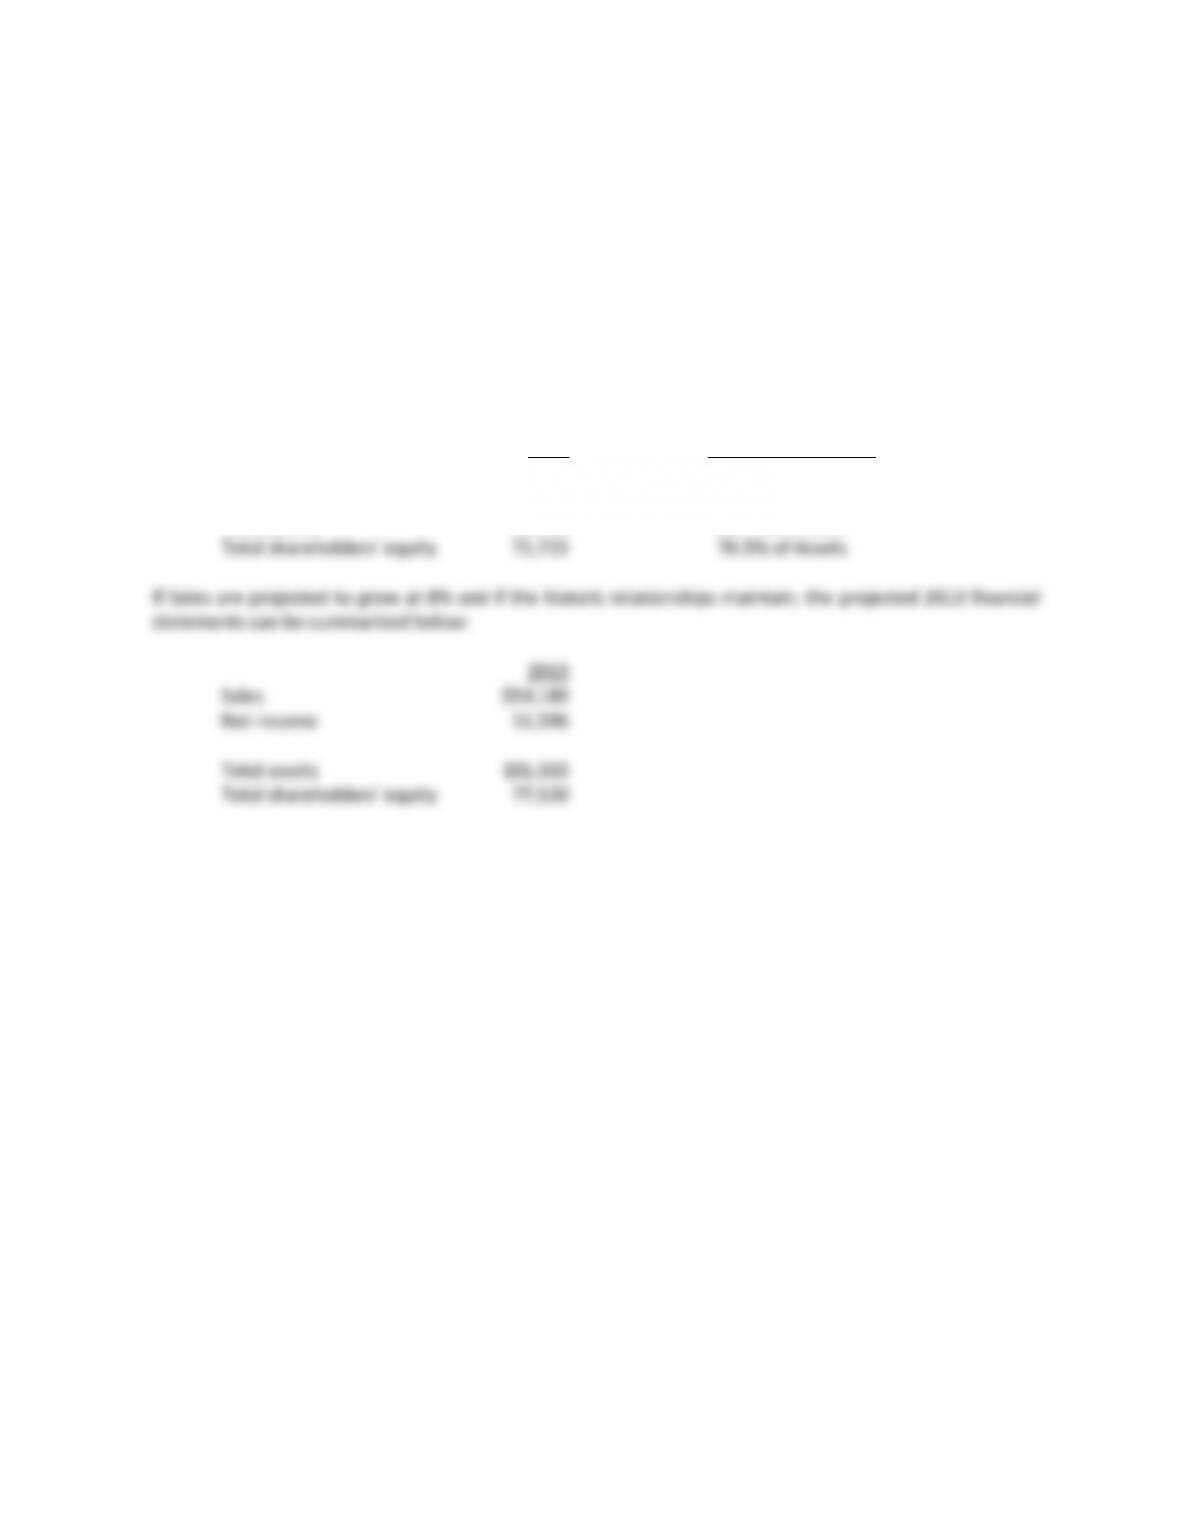
ROE = ROA x Common Equity Leverage x Capital Structure Leverage
ROA = Return on Sales x Asset Turnover
Google 2012
.165 = .130 x .99 x 1.28
52
ID5–17 Concluded
c)
2012 Historic Relationship
Sales $50,175 NA
Net income 10,737 21.4% of Sales
Total assets 93,798 1.87 times Sales