
21
22
P5–4 Continued
(2) Return on equity measures a company’s effectiveness at managing owners’ investments, while return
on assets measures a company’s effectiveness at managing all investments, both debt and equity.
The excess of return on equity over return on assets indicates a company’s effectiveness at using
debt to generate returns for the owners. This measure is called financial leverage. Since financial
leverage is calculated using return on assets, the first step is to calculate return on assets. Return on
assets is calculated as the sum of net income and [interest expense x (1- tax rate)] divided by average
total assets. Gidley’s return on assets for 2014 and 2015 is:
(3) The current ratio measures whether a company has sufficient current assets to meet its current
liabilities. The current ratio equals current assets divided by current liabilities. Gidley’s current ratio
for 2014 and 2015 is:
2014: $1,010,000 ÷ $275,000 = 3.673
2015: $980,000 ÷ $290,000 = 3.379
Gidley Electronics appears to have sufficient cash and near-cash assets available to meet its current
obligations. Therefore, the company should have no significant short-term solvency problems.
23
P5–4 Concluded
(4) The price/earnings ratio measures the sensitivity of stock prices to changes in earnings. This ratio is
calculated by dividing the market price per share by earnings per share. Since this ratio uses earnings
per share in the calculations, the first step is to calculate earnings per share. Earnings per share is
calculated by dividing net income by the average number of common shares outstanding during the
year. Gidley‘s earnings per share for 2014 and 2015 are:
2014: $515,000 ÷ [(17,000 + 17,000) ÷ 2] = $30.29
2015: $510,000 ÷ [(17,000 + 22,000) ÷ 2] = $26.15
(5) The average number of days accounts receivable are outstanding is calculated as 365 days divided by
accounts receivable turnover. The accounts receivable turnover is, in turn, calculated by dividing net
credit sales by average accounts receivable. Gidley’s accounts receivable turnover for 2014 and 2015
is:
2014: $3,010,000 ÷ [($400,000 + $400,000) ÷ 2] = 7.525
P5–5
a. Return on equity provides a measure of a company’s effectiveness at managing the owners’ capital.
The formula for calculating return on equity is net income divided by average stockholders’ equity. The
2015 return on equity for Hathaway Toy Company and Yakima Manufacturing would be:
Hathaway: $875,000 ÷ [($1,585,000 + $2,460,000) ÷ 2] = .433
P5–5 Concluded
b. Return on assets provides a measure of a company’s effectiveness at managing all investors’ capital.
The formula for calculating return on assets is the sum of net income and tax-adjusted interest expense
divided by average total assets. The 2015 return on assets for Hathaway Toy Company and Yakima
Manufacturing would be:
c. Earnings per Share = Net Income ÷ Average Number of Common Shares Outstanding
Hathaway: $875,000 ÷ [(80,000 + 80,000) ÷ 2] = $10.94
d. Yes, stockholders are realizing a return on their capital of 168.7% (from Part [a]), while debtholders
are realizing only a return on their capital of approximately 10.5% ($195,000 of interest expense ÷
P5–6
In order to consider an investment in Goodyear, let us first compute the following ratios:
1. Return on Equity = Net Income ÷ Average Stockholders’ Equity
2011: $ 321 ÷ [($1,505 + $1,624) ÷ 2] = 20.5%
25
P5–6 Concluded
3. Current Ratio =Current Assets ÷ Current Liabilities
2011: $9,812 ÷ $5,929 = 1.65
4. Debt/Equity Ratio = Total Liabilities ÷ Total Stockholders’ Equity
2011: $16,005 ÷ $1,624 = 9.86
P5–7
a. Return on Equity = Net Income ÷ Average Stockholders’ Equity
Robotronics: $610,000 ÷ [($1,005,000 + $1,005,000) ÷ 2] = .607
Based on return on equity, Technology is almost twice as efficient as Robotronics at managing the
stockholders’ capital. If unusual items were not considered, return on equity for each company would
be:
Technology now appears to be considerably worse than Robotronics at managing the stockholders’
capital. Including unusual items in calculating return on equity does provide a more complete measure
26
P5–7 Concluded
b. Financial leverage indicates how effectively a company uses debt for the benefit of stockholders.
Financial leverage equals return on equity less return on assets. Thus, return on assets must be
calculated before calculating financial leverage.
Return on Assets = (Net Income + Interest Expense (net of tax)) ÷ Average Total Assets
From this analysis, Robotronics is approximately twice as effective as Technology at using debt to
generate returns for its stockholders. If unusual items are not considered, the return on assets for each
company would be:
Therefore, the financial leverage of the two companies would be:
Robotronics: .607 – .211 = .396
27
P5–8
Return on Sales = Net Income ÷ Net Sales
.08 = $25,000 ÷ Net Sales
Net Sales = $312,500
Cost of Goods Sold = Net sales x (1 – Gross Margin Percentage)
= $312,500 x (1 – 40%)
= $187,500
Receivables Turnover = Net Credit Sales ÷ Average Accounts Receivable
8 = $312,500 ÷ [($0 + Ending Accounts Receivable)÷2) Ending
Accounts Receivable = $78,125
Tumwater Canyon Campsites
Income Statement
For the Year Ended December 31, 2015
Sales $312,500
Cost of goods sold 187,500
Tumwater Canyon Campsites
Statement of Current Assets and Liabilities
December 31, 2015
Current assets Current liabilities
Cash $ 21,875 Accounts payable $200,000
Accounts receivable 78,125

29
P5–9
a.
Mountain-Pacific Railroad
Common-Size Balance Sheet
December 31, 2015 and 2014
2015 2014
Dollar % Dollar %
Assets
Current assets:
Cash $ 10,000 0.68% $ 312,000 20.36%
Short-term marketable securities 125,000 8.47% 120,000 7.83%
Accounts receivable 500,000 33.90% 150,000 9.79%
Inventory 200,000 13.56% 210,000 13.71%
Liabilities and Stockholders’ Equity
Current liabilities:
Accounts payable $ 10,000 0.68% $ 50,000 3.26%
Wages payable 5,000 0.34% 2,000 0.13%
Dividends payable 125,000 8.47% 5,000 0.33%
Income taxes payable 50,000 3.39% 35,000 2.29%
Current portion of long-term debt 100,000 6.78% 175,000 11.42%
30
P5–9 Continued
Mountain-Pacific Railroad
Common-Size Income Statement
For the Years Ended December 31, 2015 and 2014
2015 2014
Dollar % Dollar %
Revenue:
Net cash sales $ 1,955,000 32.02% $ 2,775,000 66.31%
Net credit sales 4,150,000 67.98% 1,410,000 33.69%
Total revenue $ 6,105,000 100.00% $ 4,185,000 100.00%
Cost of goods sold:
Gross profit $ 2,090,000 34.24% $ 1,620,000 38.71%
Selling & administrative expenses:
Depreciation expense $ 75,000 1.23% $ 90,000 2.15%
General selling expenses 575,000 9.42% 600,000 14.34%
General administrative expenses 480,000 7.86% 420,000 10.04%
Total selling & administrative
exp. $ 1,130,000 18.51% $ 1,110,000 26.53%
Income from operations $ 960,000 15.73% $ 510,000 12.18%
By looking at the common-size balance sheets and income statements, we can observe the following:
1. The proportion of current assets to total assets has increased slightly from 57% to 60%. The
composition of current assets has changed dramatically. Cash balance has declined by about 19%
and accounts receivables have gone up by about 24%.
31
P5–9 Concluded
4. Since retained earnings are down by approximately 6%, and the net income is slightly up, one can
5. It seems that the relative composition of cash versus credit sale is switching from 2014 to 2015.
This corroborates the dramatic increase in accounts receivable.
b. The proportion of credit sales and cash sales to total sales changed dramatically from 2014 to 2015. The
company made approximately twice as many credit sales during 2015 as it made during 2014. This shift
the Accounts Receivable balance to increase during 2015.
c. Common-size financial statements allow people to make comparisons across time and across
companies by providing a benchmark against which to make the comparisons. Standard financial
P5–10
a. Return on Equity = Net Income ÷ Average Stockholders’ Equity
2014: $294,000 ÷ $815,000 = .361
2015: $485,000 ÷ [($815,000 + $835,000) ÷ 2] = .588
32
P5–10 Continued
Return on Assets = (Net Income + [Interest Expense (1 – Tax Rate)]) ÷ Average Total Assets
2014: ($294,000 + [$65,000 (1 – .34)]) ÷ $1,532,000 = .220
2015: ($485,000 + [$50,000 (1 – .34)]) ÷ [($1,532,000 + $1,475,000) ÷ 2] = .345
Receivables Turnover = Net Credit Sales ÷ Average Accounts Receivable
Price/Earnings Ratio = Market Price per Share ÷ Earnings per Share
2014: $45.00 ÷ $26.73 = 1.684
2015: $70.00 ÷ $31.29 = 2.237
Financial Leverage = Return on Equity – Return on Assets
2014: .361 – .220 = .141
2015: .588 – .345 = .243
Dividend Yield = Dividend per Share ÷ Market Price per Share
33
P5–10 Continued
Interest Coverage Ratio = (Net Income Before Taxes and Interest Expense) ÷ Interest Expense
2014: ($445,000 + $65,000) ÷ $65,000 = 7.846
2015: ($910,000 + $50,000) ÷ $50,000 = 19.200
Inventory Turnover = Cost of Goods Sold ÷ Average Inventory
The company has more than sufficient current assets to meet its current liabilities, as evidenced by its
current ratio. The company’s receivable turnover increased dramatically during 2015, which indicates
that it is doing a better job of collecting from its customers. Closer inspection of the receivable
turnover, however, reveals that Mountain-Pacific may actually be doing a worse job of collecting from
34
P5–10 Concluded
b. Based on the average of the company’s 2014 and 2015 ratios, Mountain-Pacific’s return on equity,
current ratio, and return on assets are almost identical to the industry averages. While the absolute
levels of these ratios are similar, the trend of Mountain-Pacific’s ratios provides additional information
P5–11
As a loan officer, I would be concerned with whether a potential borrower has the ability to meet its debts
as they come due. Since both companies are requesting only nine-month loans, I would be interested in the
potential borrowers’ short-term solvency. Therefore, I would examine their current ratios and quick ratios.
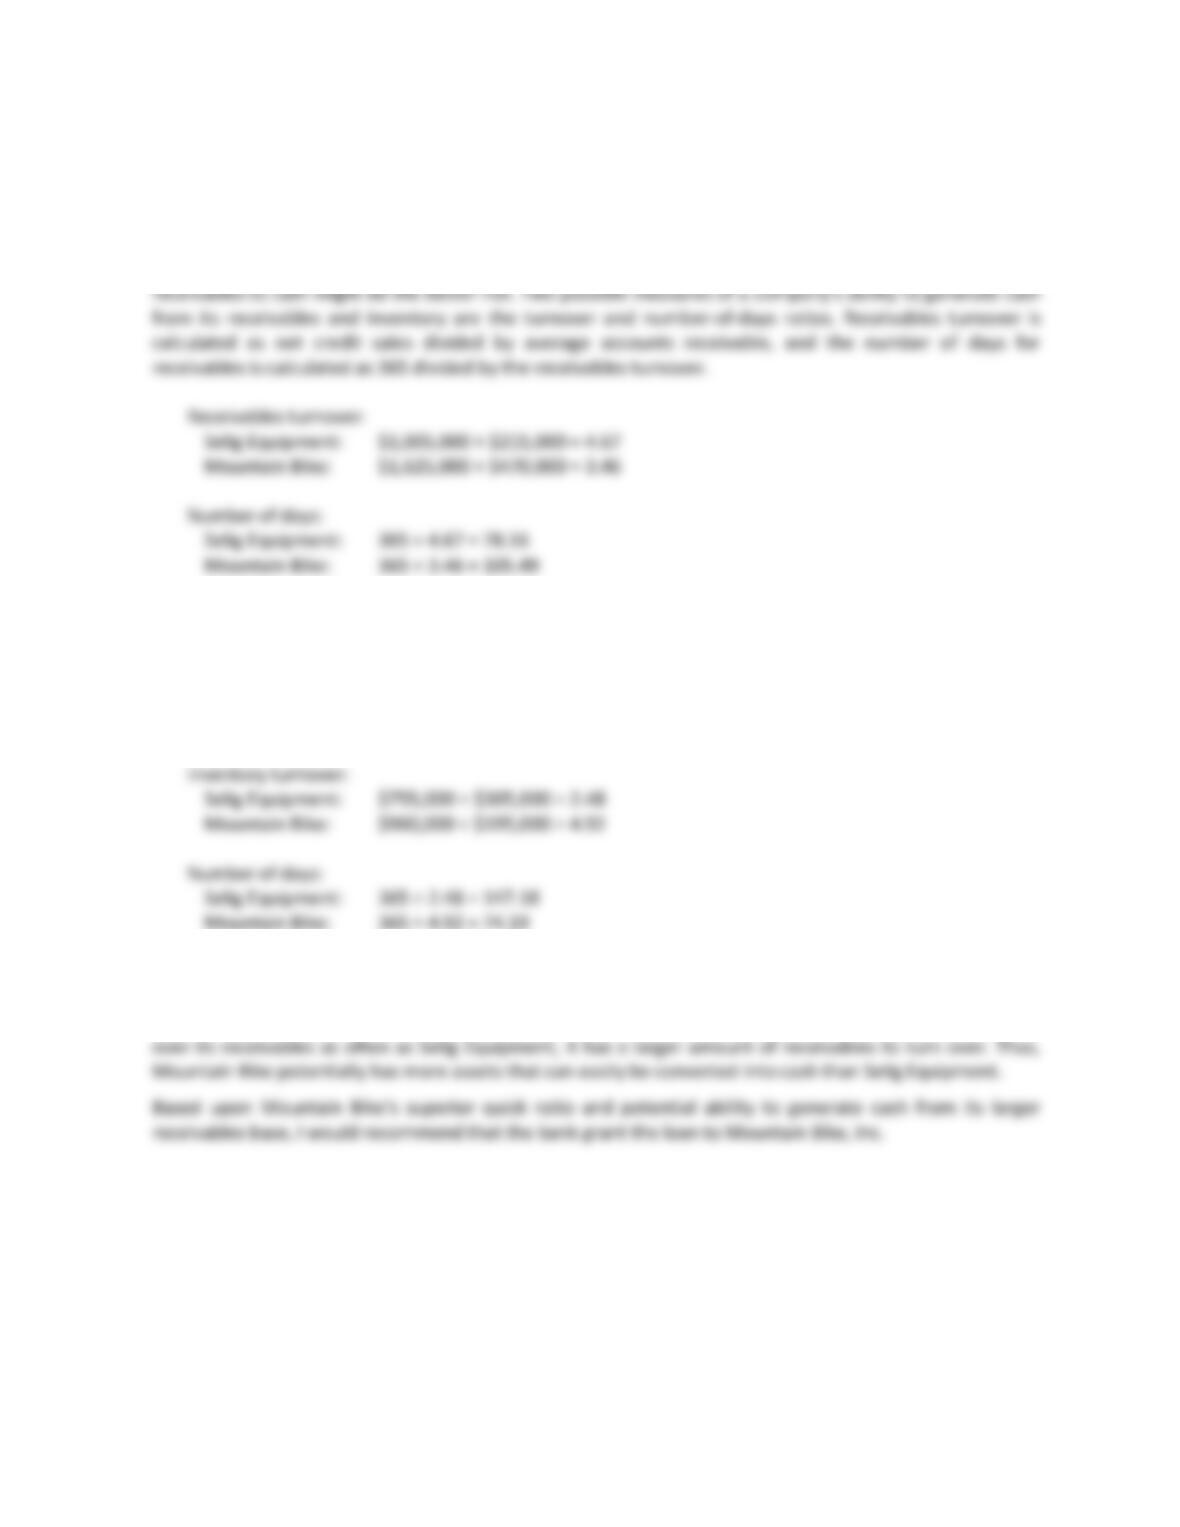
Further, I would consider the effect of the potential loan on these ratios. The current ratio is calculated as
current assets divided by current liabilities.
35
P5–11 Concluded
Based on the quick ratio, Mountain Bike, Inc. appears to be a much better risk than Selig Equipment.
Mountain Bike has approximately 2.5 times more near-cash assets available than Selig Equipment to meet
its current obligations. Therefore, Mountain Bike does not have to rely as heavily on converting other assets
to cash as Selig does to meet its obligations. The company that can most readily convert its inventory and
These ratios indicate that Selig Equipment, on average, collects its receivables 27 days quicker than
Mountain Bike. Therefore, Selig Equipment can more easily convert its receivables to cash than Mountain
Bike can.
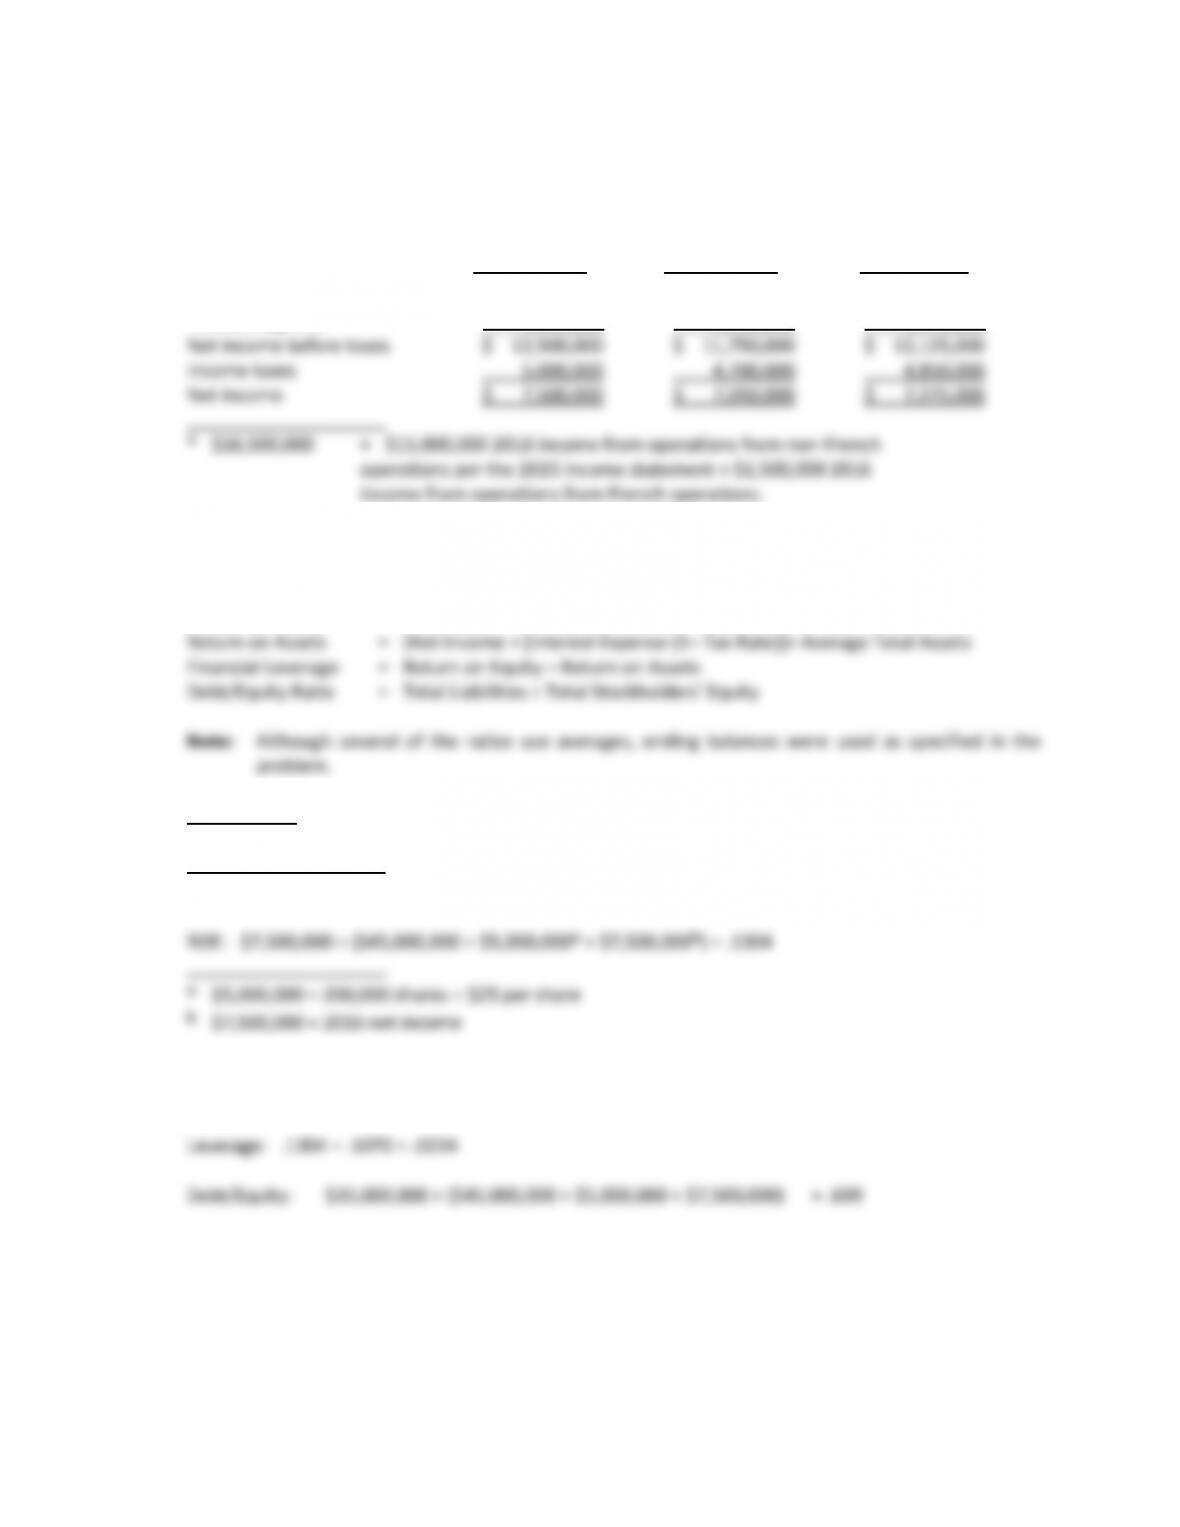
Inventory turnover is calculated as cost of goods sold divided by average inventory, and the number of days
is calculated as 365 divided by inventory turnover.
Mountain Bike: 365 ÷ 4.92 = 74.19
These ratios bode well for Mountain Bike. Mountain Bike sells its inventory, on average, 73 days sooner
than Selig Equipment sells its inventory. This difference implies that Mountain Bike generates more sales
which, in turn, implies that it generates more accounts receivable. Although Mountain Bike does not turn
36
P5–12
a. Watson Metal Products’ 2016 income statements under the different financing alternatives would be
as follows.
Alternative 1 Alternative 2 Alternative 3
Income from operations* $ 16,500,000 $ 16,500,000 $ 16,500,000
Interest expense 4,000,000 4,750,000 4,375,000
The formulas for the requested ratios are:
Earnings per Share = Net Income ÷ Average Number of Common Shares Outstanding
Return on Equity = Net Income ÷ Average Stockholders’ Equity
Alternative 1
EPS: $7,500,000 ÷ (2,000,000 shares* + 200,000 shares) = $3.41
* 2,000,000 shares = $6,600,000 2015 net income ÷ $3.30 2015 earnings per share
ROA: ($7,500,000 + [$4,000,000 (1 – .4)]) ÷ ($35,000,000 + $45,000,000 + $5,000,000 +
$7,500,000) = .1070