1
CHAPTER 5
USING FINANCIAL STATEMENT INFORMATION
BRIEF EXERCISE
BE5–1
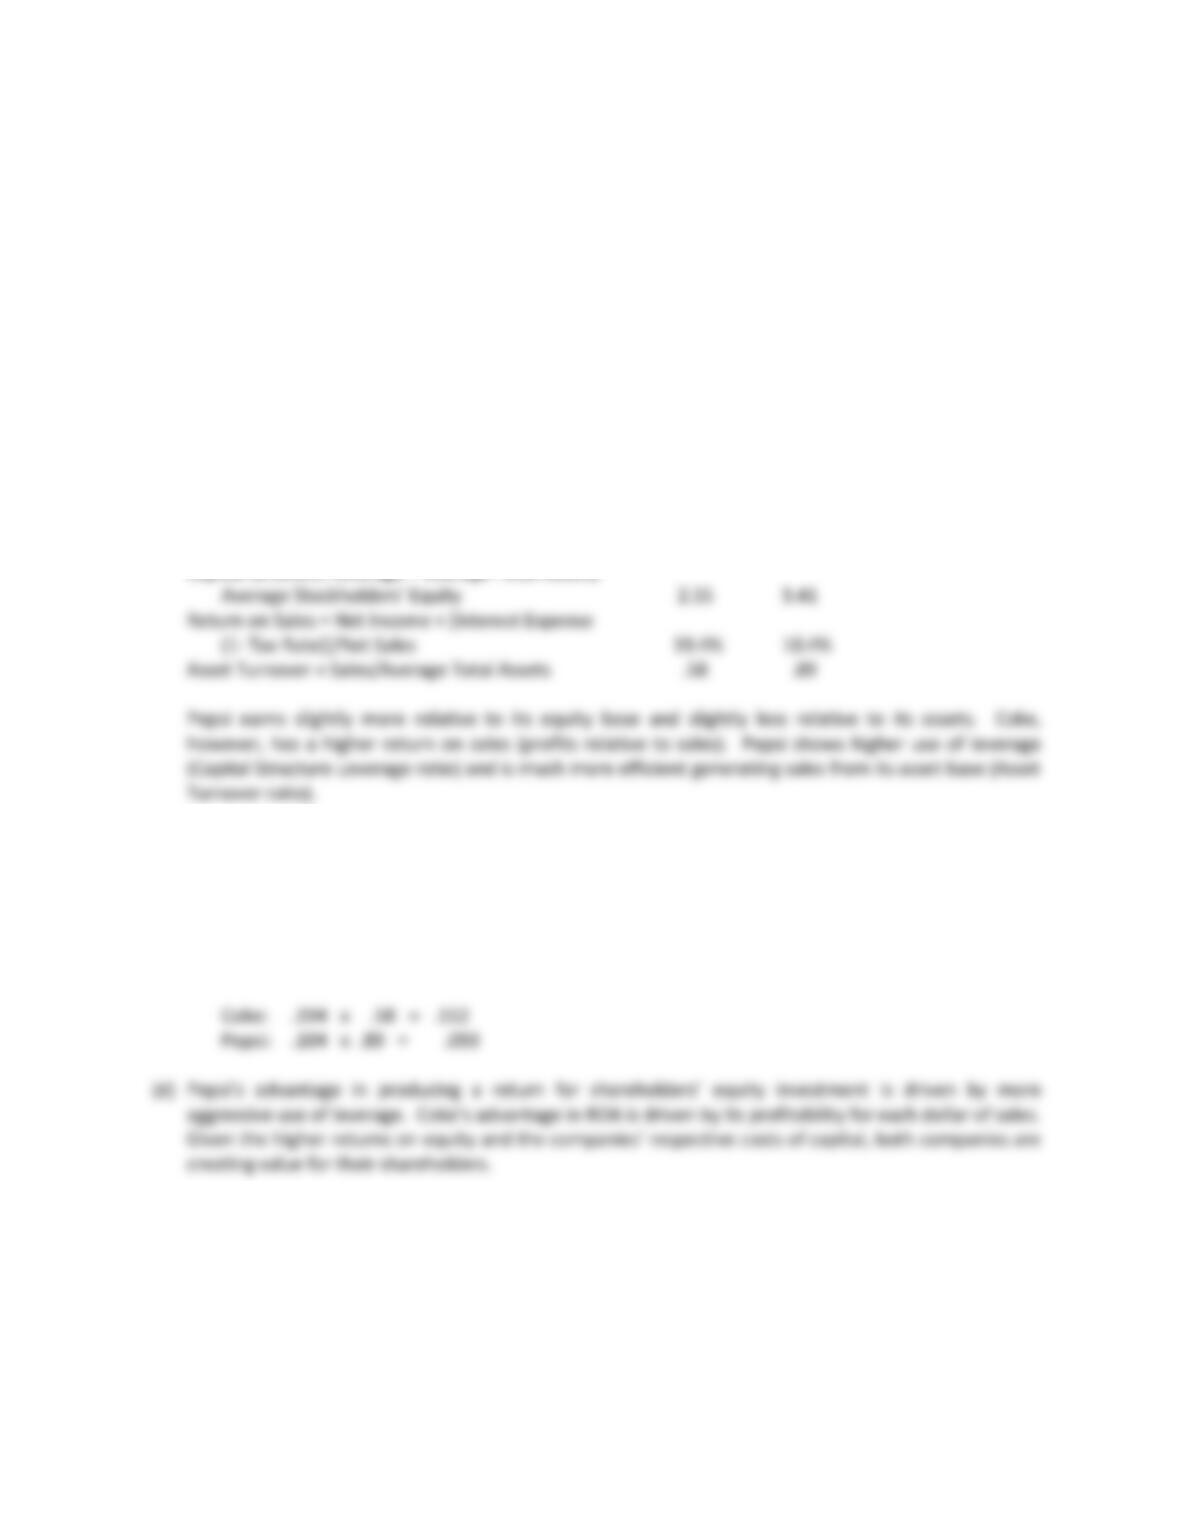
Coke Pepsi
(a) ROE = Net Income/Average Stockholders’ Equity 27.7% 28.5%
ROA = (Net Income +[Interest Expense (1-Tax Rate)])/
Average Total Assets 11.2% 9.3%
Common Equity Leverage = Net Income/(Net Income +
[Interest Expense(1-Tax Rate)]) 96.7% 90.4%
Capital Structure Leverage = Average Total Assets/
(b) ROA x Common Equity Leverage x Capital Structure Leverage = ROE
Coke: .112 x .967 x 2.55 = .277 (rounding)
Pepsi: .093 x .904 x 3.41 = .285 (rounding)
(c) Return on Sales x Asset Turnover = ROA
2
BE5–2
(a) With $27.46 billion in 2012 revenues, J & J’s medical devices business is the largest. From 2010 to
2012, the pharmaceutical division showed the largest percentage growth at 13.4%.
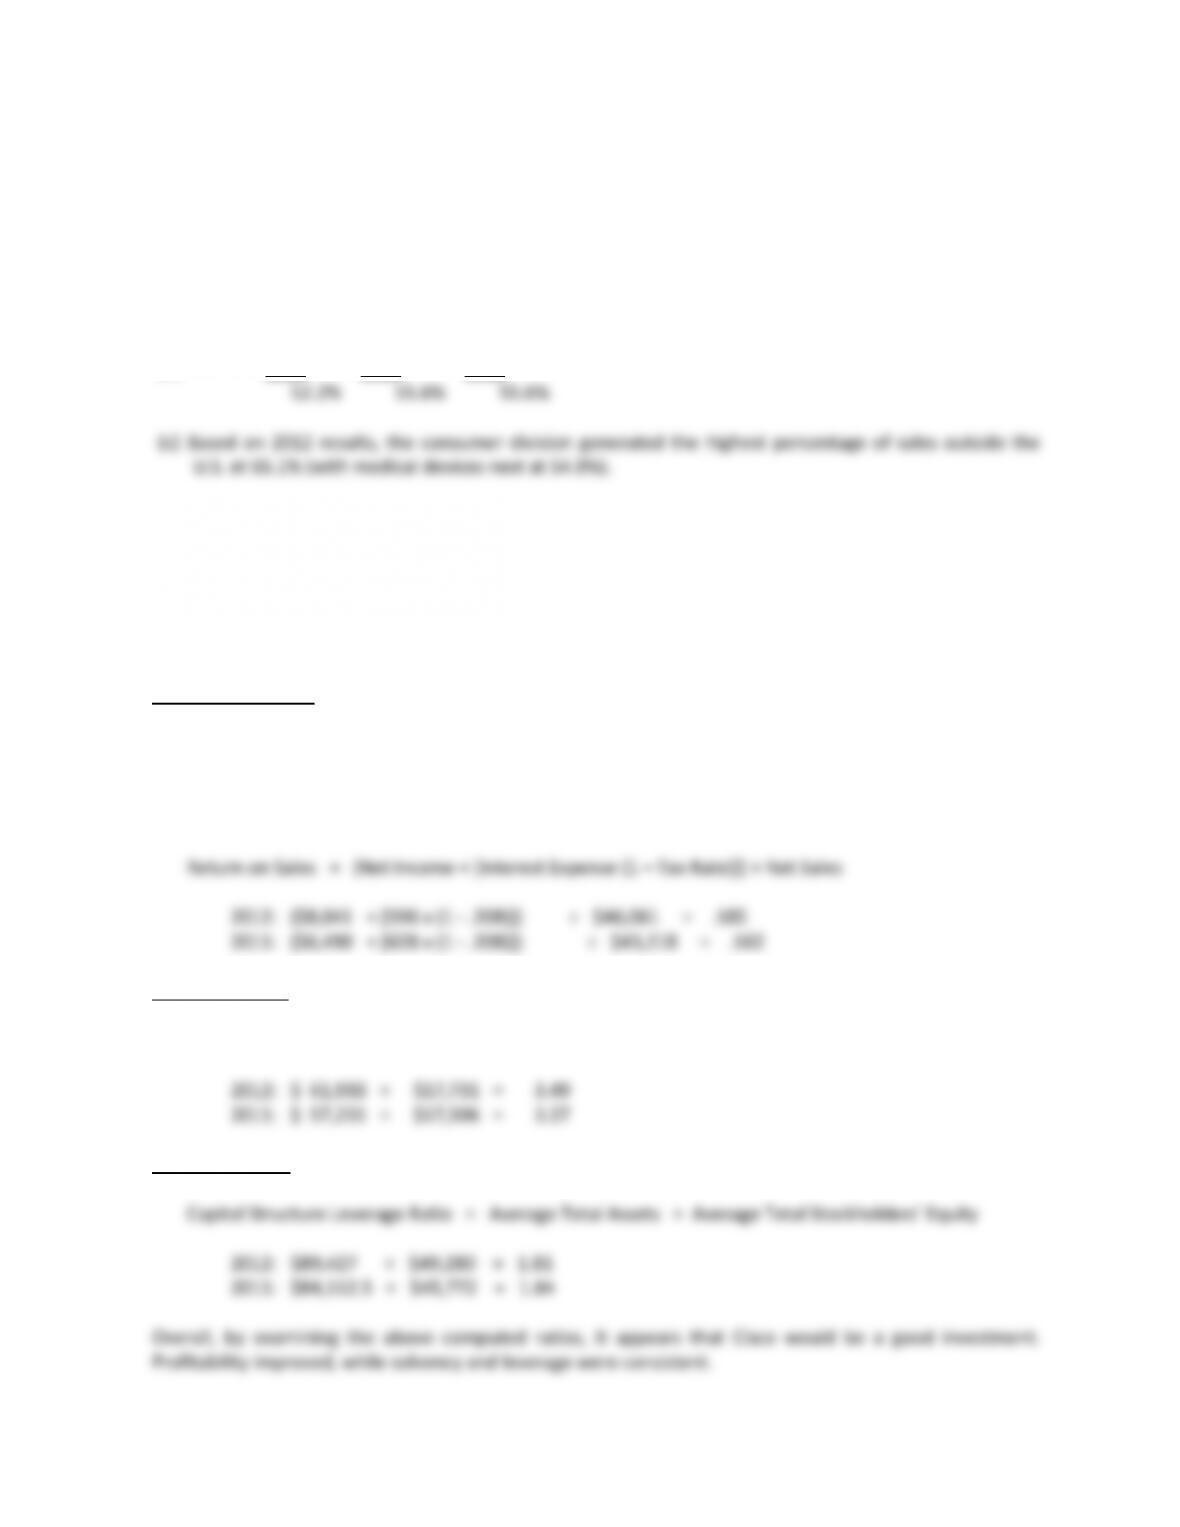
(b) 2010 2011 2012
EXERCISES
E5–1
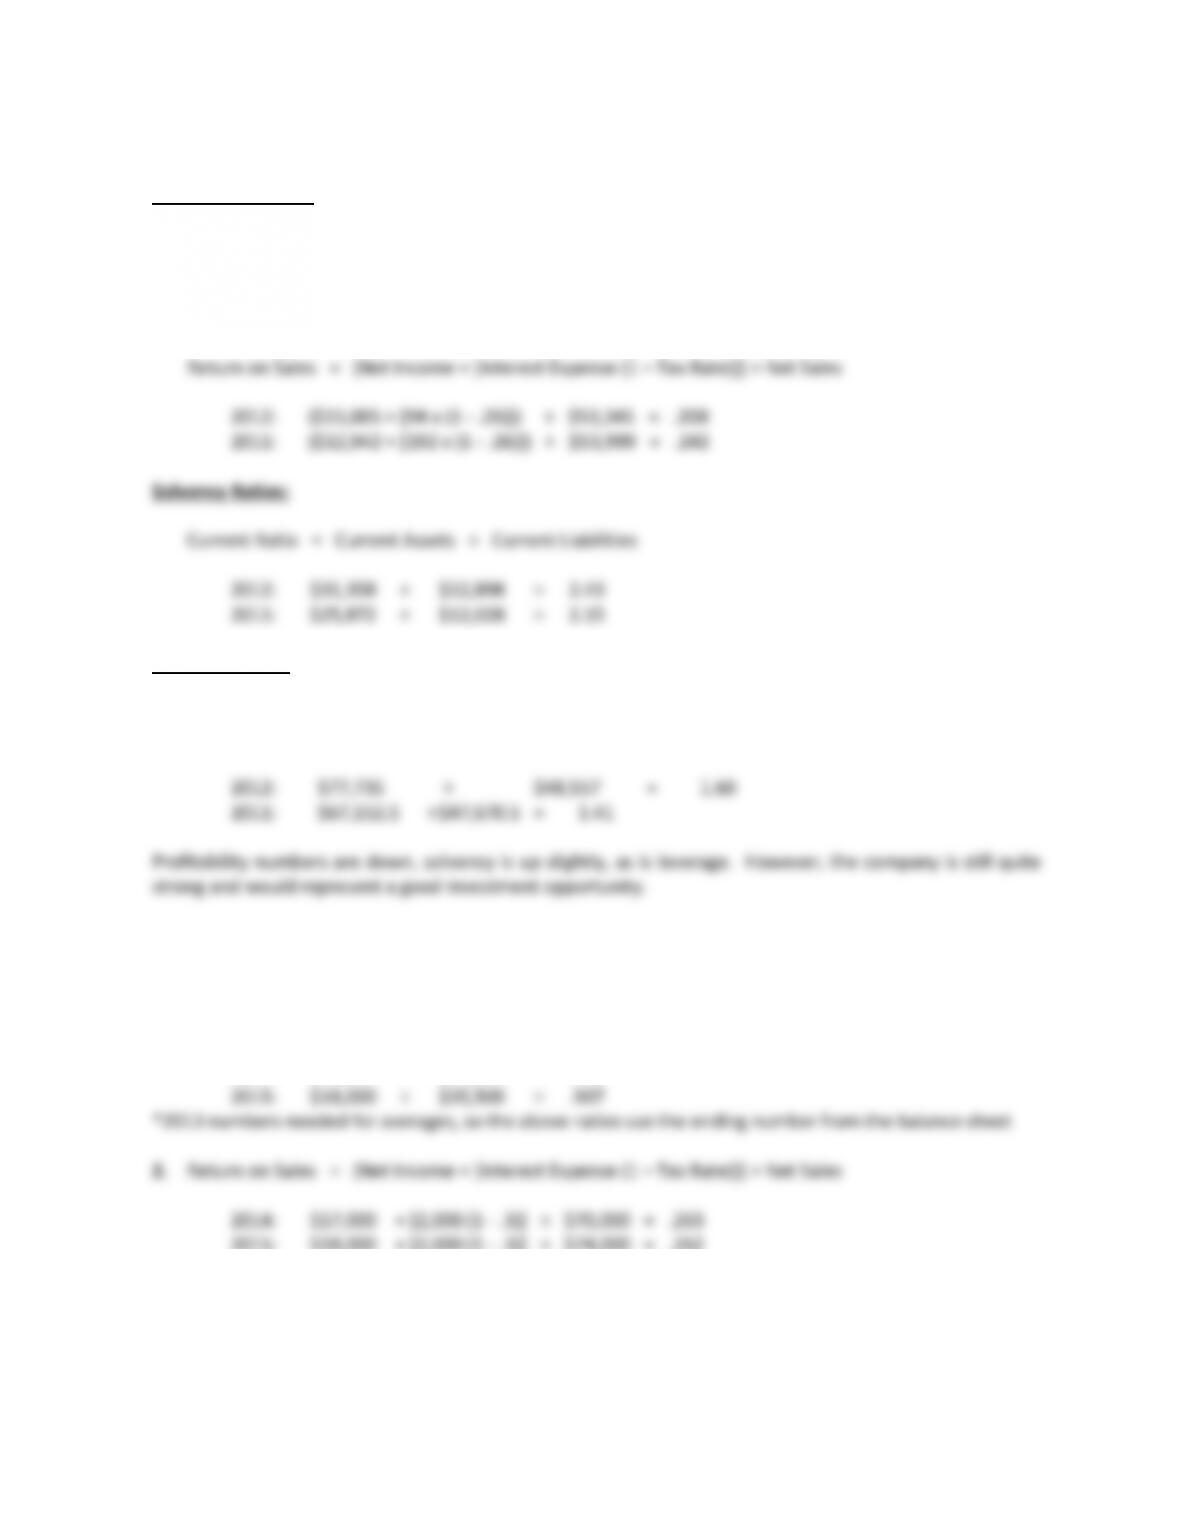
Profitability Ratios:
Return on Equity = Net Income ÷ Average Stockholders’ Equity
2012: $8,041 ÷ 49,280 = .163
2011: $6,490 ÷ 45,772 = .142
Solvency Ratios:
Current Ratio = Current Assets ÷ Current Liabilities
Leverage Ratios:
3
E5–2
Profitability Ratios:
Return on Equity = Net Income ÷ Average Stockholders’ Equity
2012: $11,005 ÷ 48,557 = .227
2011: $12,942 ÷ 47,670.5 = .272
Leverage Ratios:
Capital Structure Leverage Ratio = Average Total Assets ÷ Average Total Stockholders’ Equity
E5–3
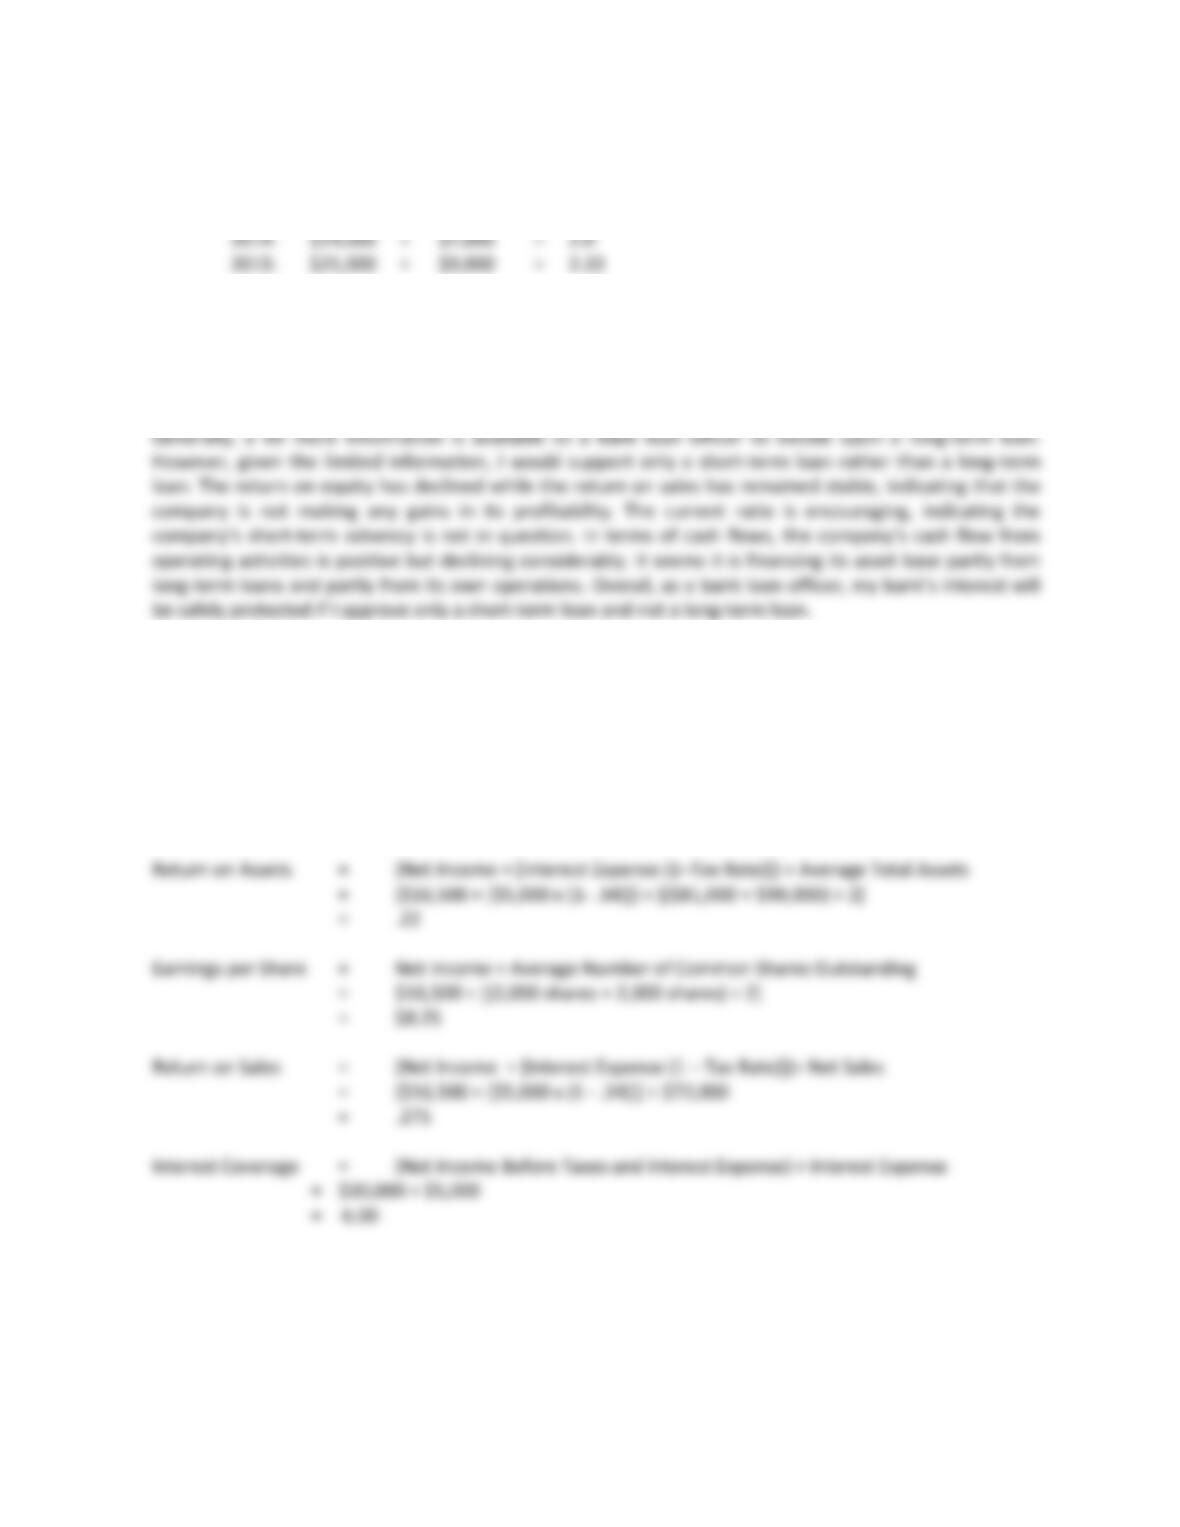
Based on the information provided by Ginny’s Fashions, we can compute the following ratios:
1. Return on Equity = Net Income ÷ Average Stockholders’ Equity*
2014: $17,000 ÷ $31,000 = .548
2015: $18,000 + [2,000 (1 – .3)] ÷ $74,000 = .262
4
E5–3 Concluded
3. Current Ratio = Current Assets ÷ Current Liabilities
4. Debt/Equity Ratio = Total Liabilities ÷ Total Stockholders’ Equity
2014: $33,000 ÷ $31,000 = 1.065
2015: $33,000 ÷ $40,000 = .825
E5–4
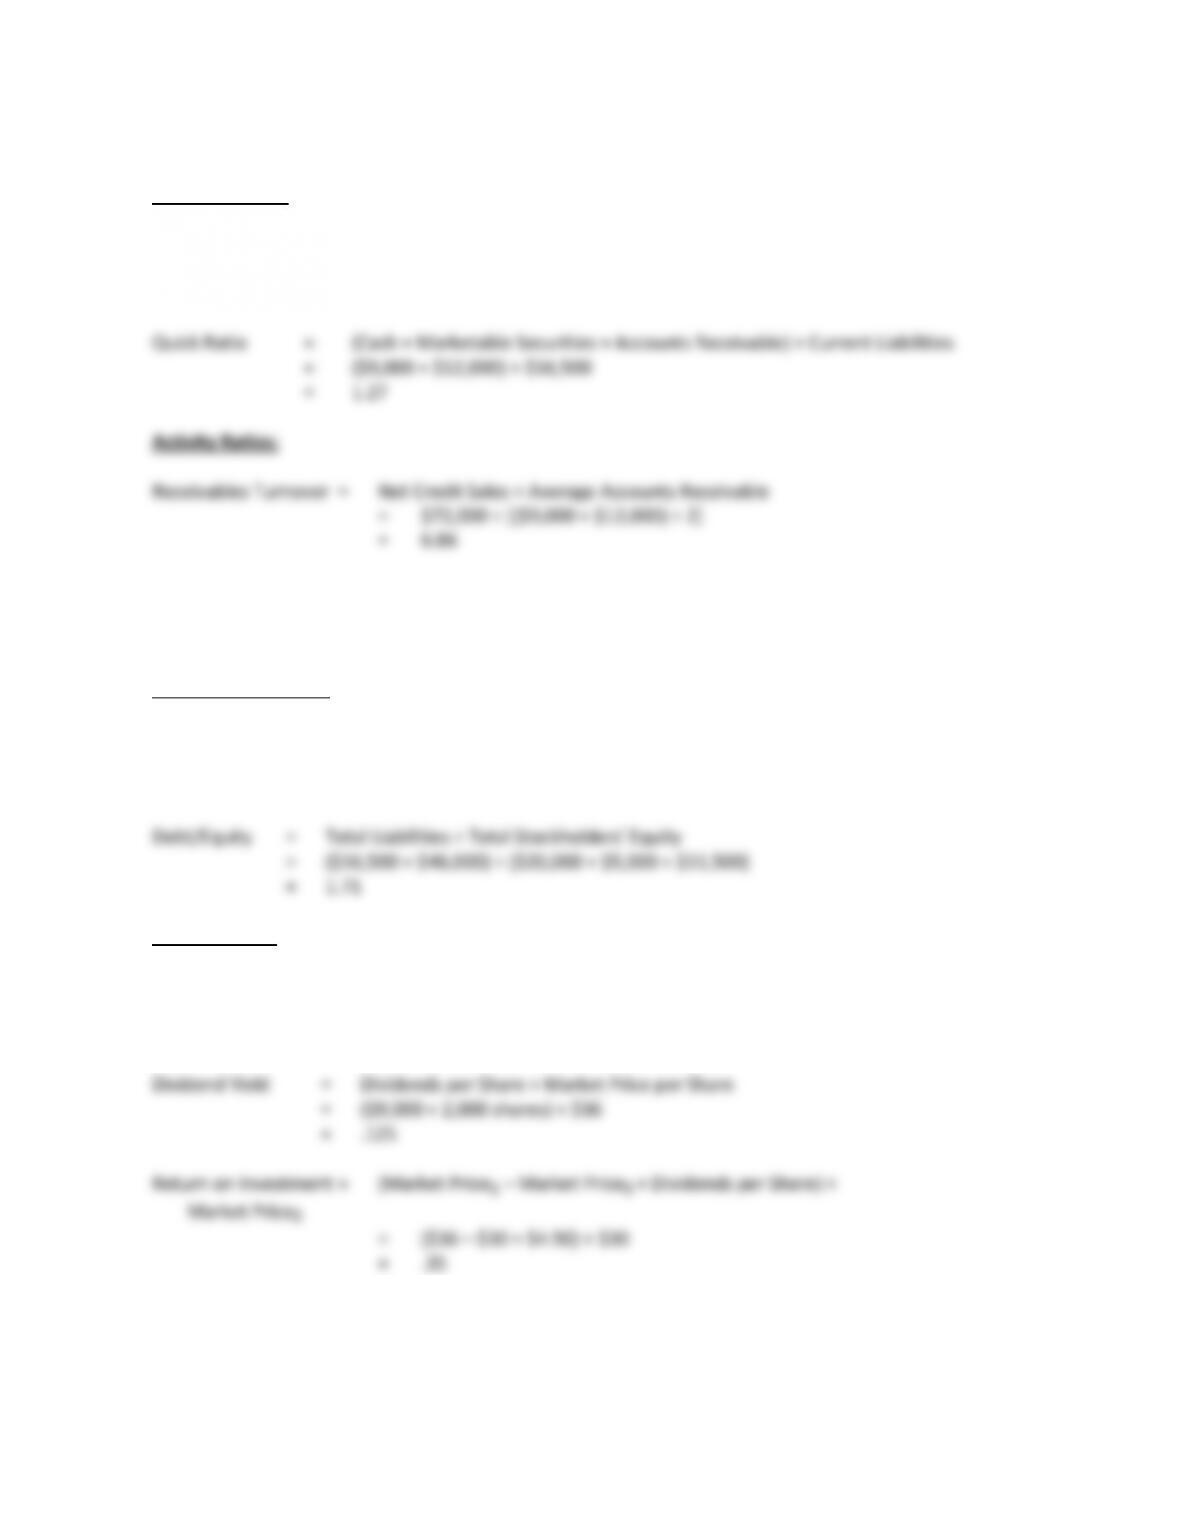
a.
Profitability Ratios:
Return on Equity = Net Income ÷ Average Stockholders’ Equity
= $16,500 ÷ [($29,000 + $36,500) ÷ 2]
= .504
5
E5–4 Continued
Solvency Ratios:
Current Ratio = Current Assets ÷ Current Liabilities
= ($9,000 + $12,000 + $18,000) ÷ $16,500
= 2.36
Inventory Turnover = Cost of Goods Sold ÷ Average Inventory
= $30,000 ÷ [($15,000 + $18,000) ÷ 2]
= 1.82
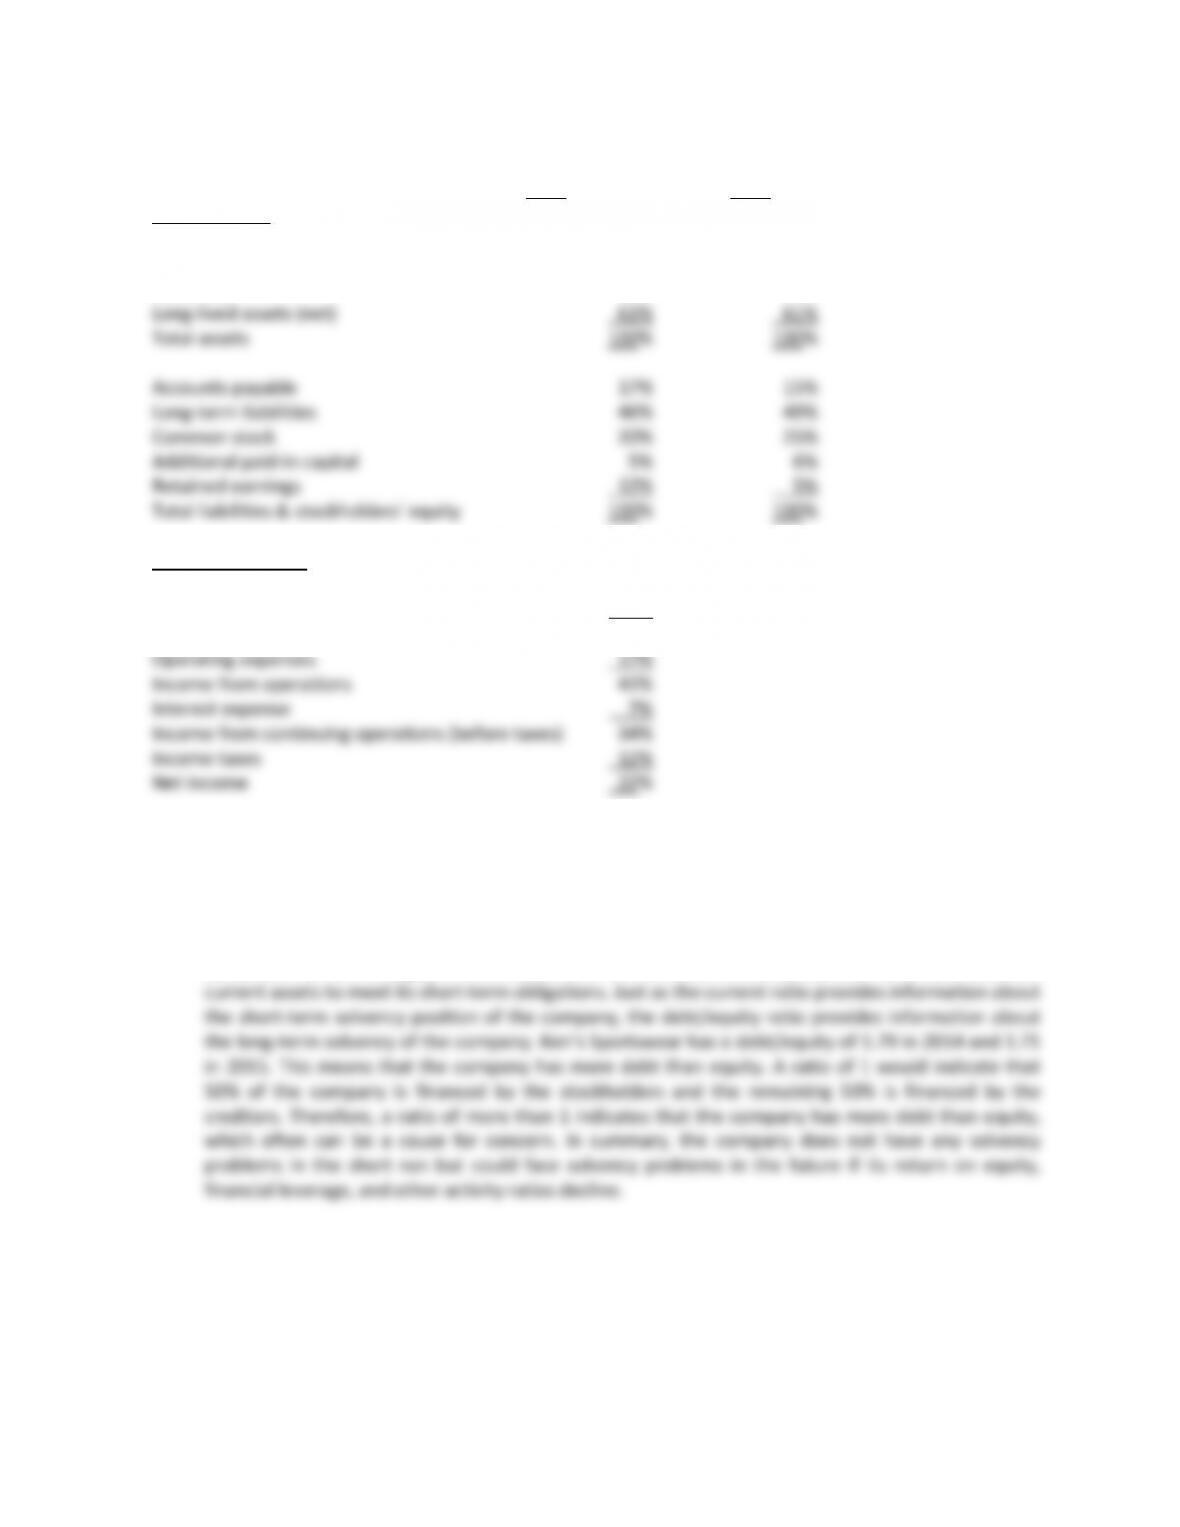
Capitalization Ratios:
Financial Leverage = Return on Equity – Return on Assets
= .504 – .22
= .284
Market Ratios:
Price/Earnings Ratio = Market Price per Share ÷ Earnings per Share
= $36 ÷ $8.25
= 4.36
6
E5–4 Concluded
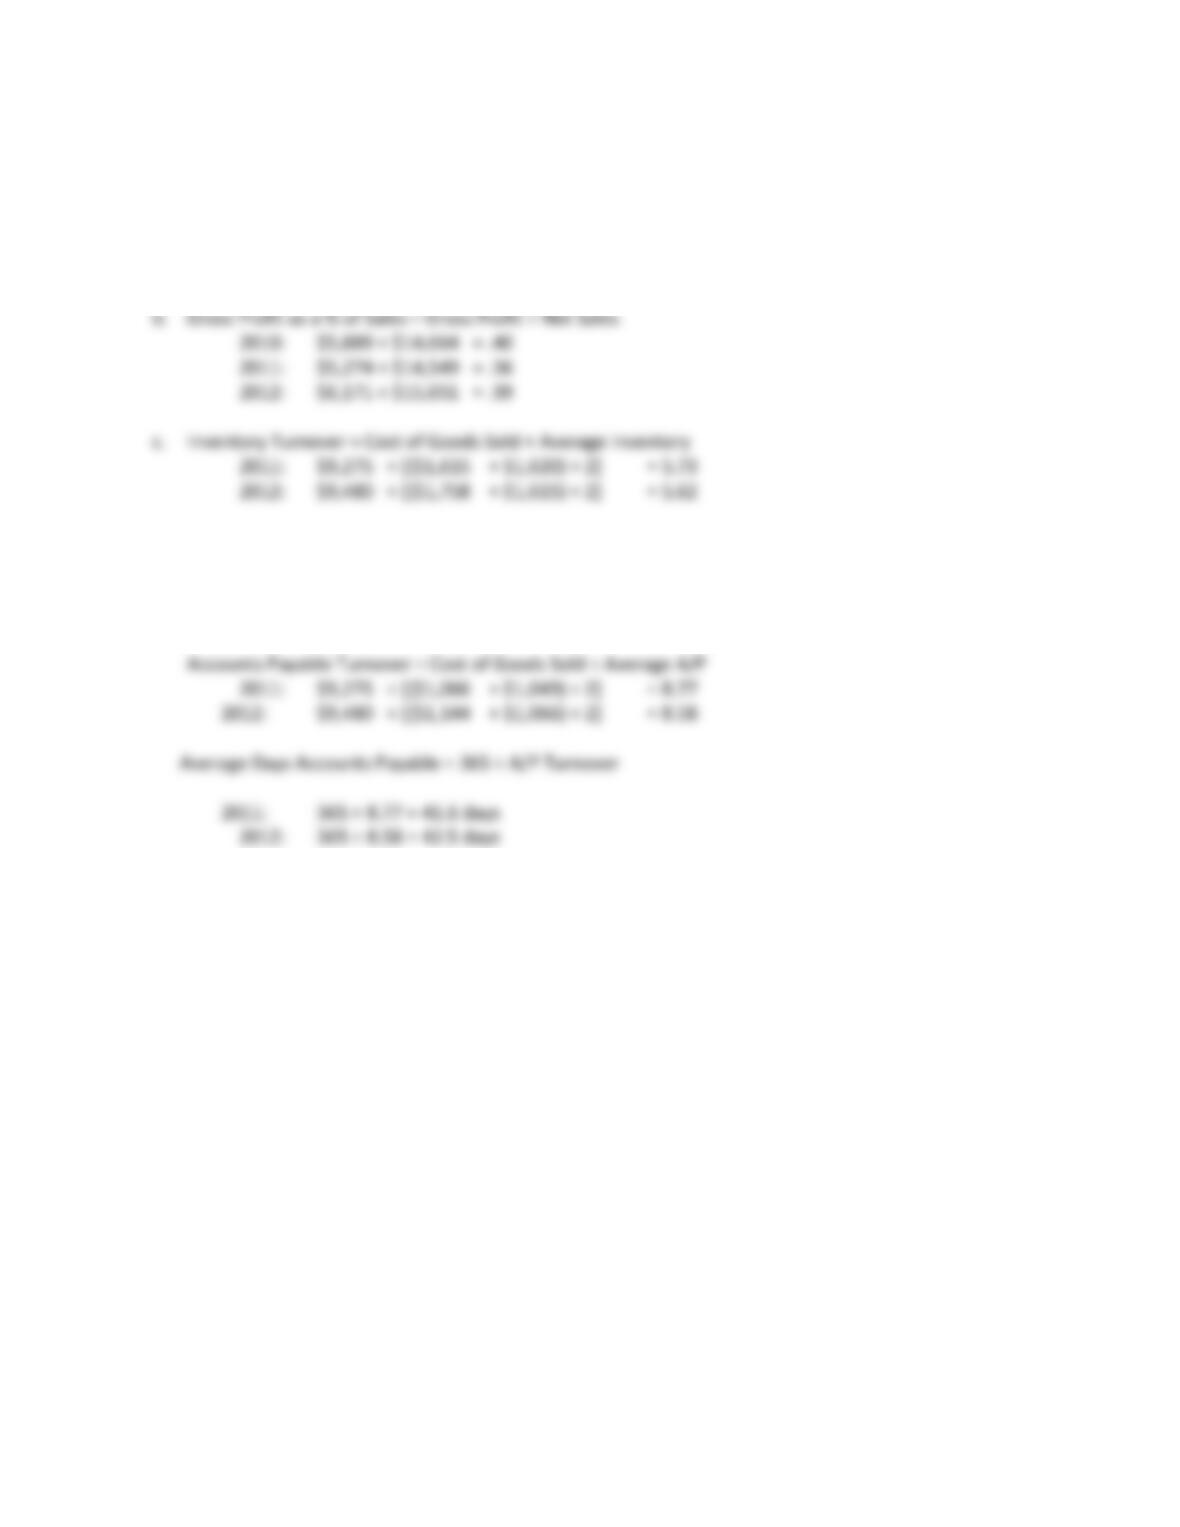
b. 2015 2014
Balance Sheet
Cash 9% 9%
Accounts receivable 12% 11%
Inventory 18% 19%
Income Statement
Sales 100%
Cost of goods sold 42%
Gross profit 58%
c. The company is making a handsome return of 27.5% on sales. Its return on equity is more than 50%.
Since the return on equity measures a company’s ability to use equity investor’s capital to generate
net assets through operations, a return of more than 50% indicates that Ken’s Sportswear has
exceptional earning power.
The current ratio of Ken’s Sportswear has gone down from 2.58 for the year 2014 to 2.36 for the year
2015, but it is still very good. It is indicative of the fact that the company has more than twice the
7
E5–5
a. Current Ratio = Current Assets ÷ Current Liabilities
2010: $3,926 ÷ $2,095 = 1.87
2011: $4,309 ÷ $2,128 = 2.02
2012: $4,132 ÷ $2,344 = 1.76
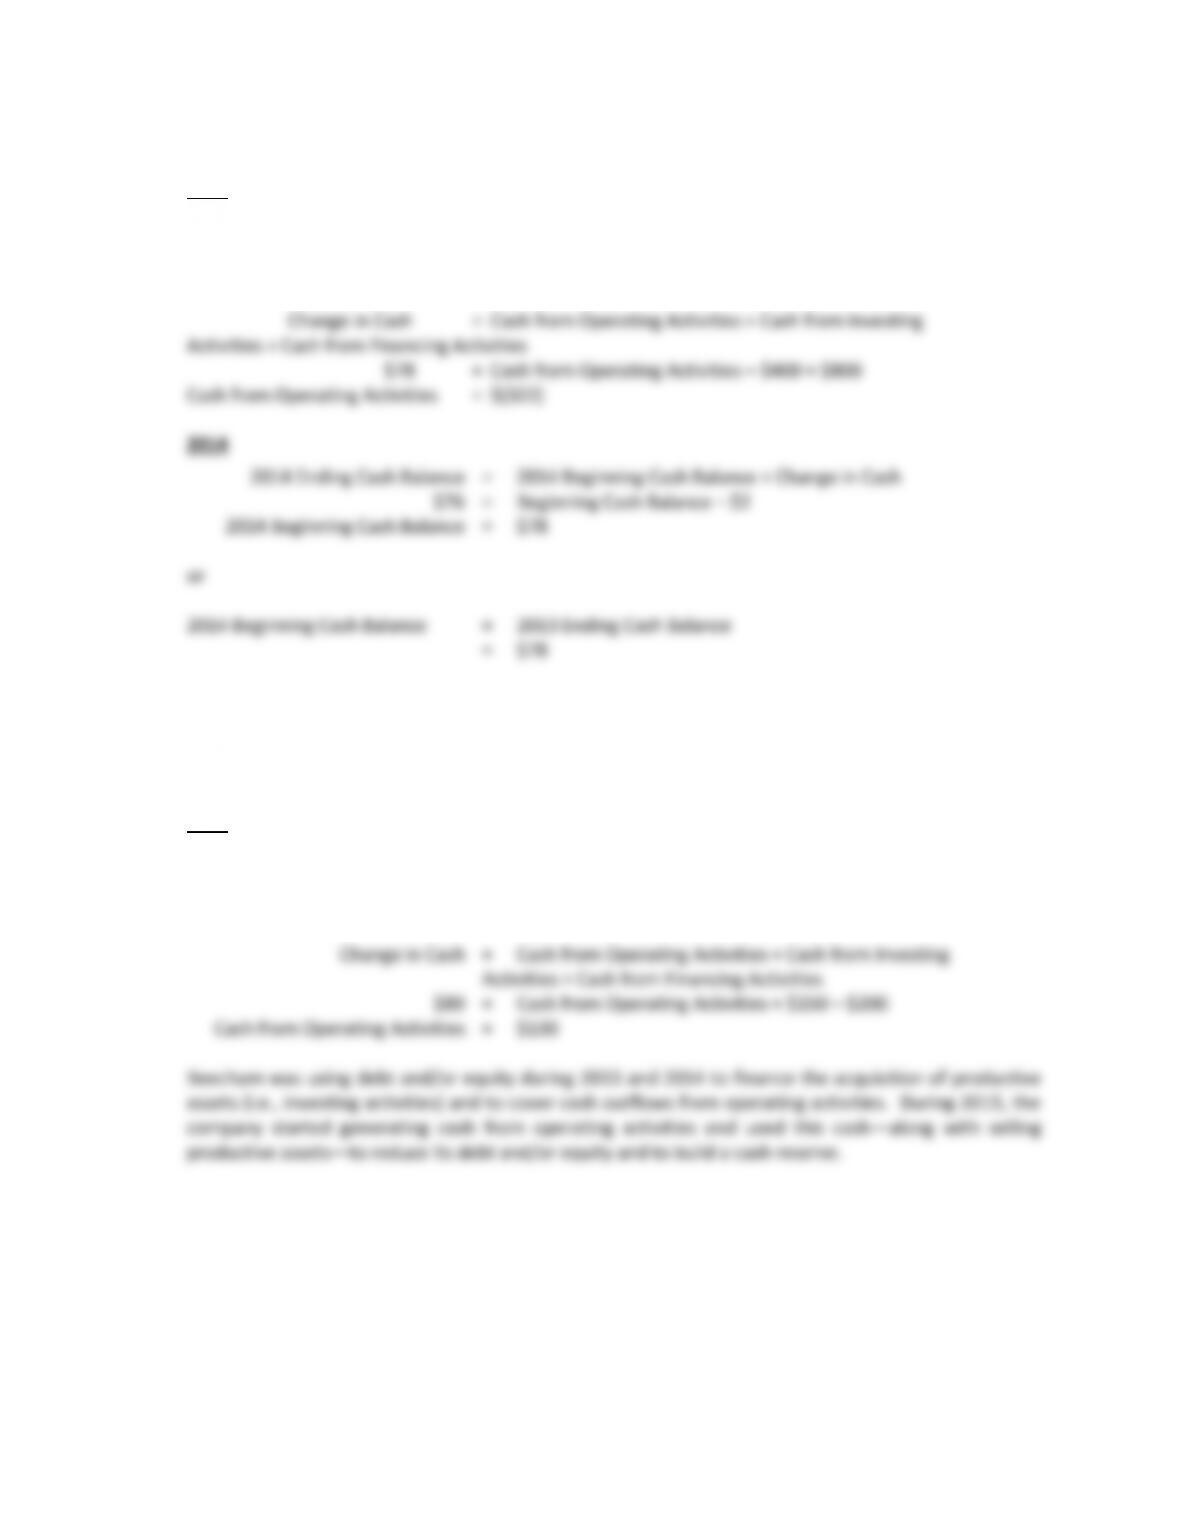
Average Days Supply of Inventory = 365 ÷ Inventory Turnover
2011: 365 ÷ 5.73 = 63.7 days
2012: 365 ÷ 5.62 = 64.9 days
d. Over the period shown, solvency has deteriorated, as best demonstrated by the drop in the current
ratio and the longer time required to sell inventory and pay trade payables.
8
E5–6
a. 2013
2013 Ending Cash Balance = 2013 Beginning Cash Balance + Change in Cash
= $0 + $78
= $78
Change in Cash = Cash from Operating Activities + Cash from Investing
Activities + Cash from Financing Activities
$(2) = $(252) + Cash from Investing Activities + $400
Cash from Investing Activities = $(150)
2015
2015 Ending Cash Balance = 2015 Beginning Cash Balance + Change in Cash
$156 = $76 + Change in Cash
Change in Cash = $80
9
E5–6 Concluded
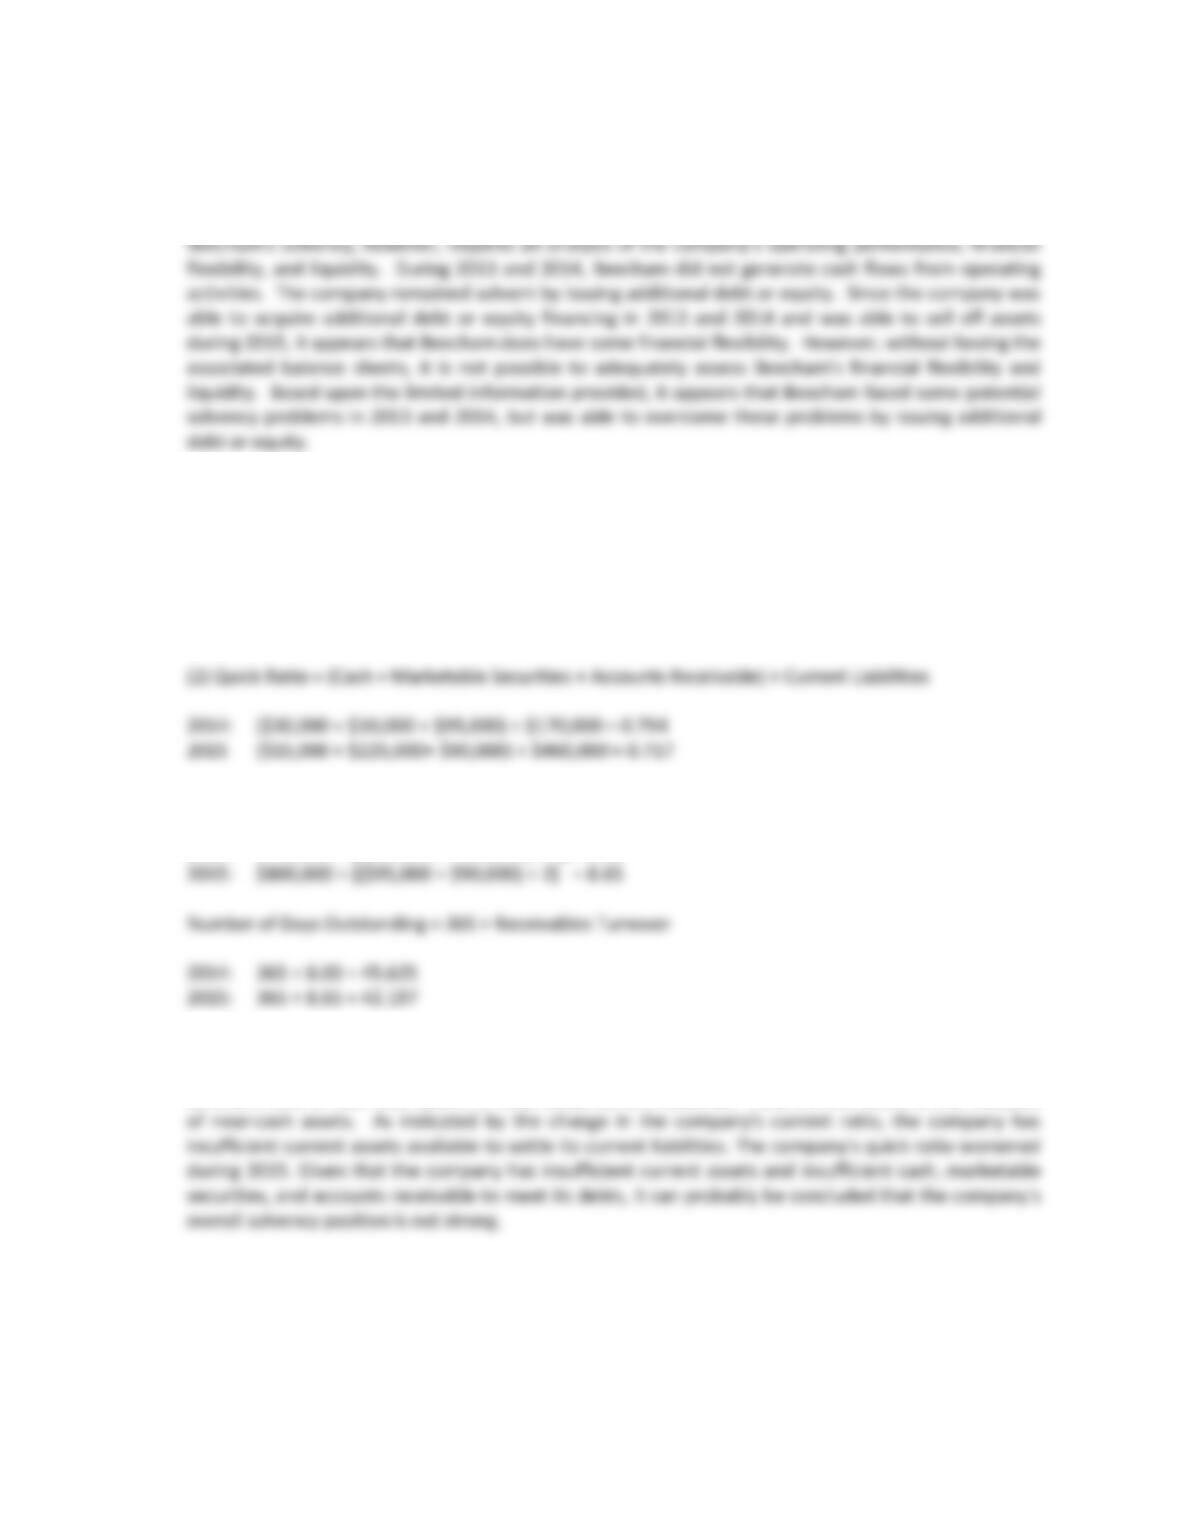
b. Other than at the beginning of 2013, the company always had a positive cash balance. From that
standpoint the company was solvent throughout the three-year period. A more detailed analysis of
E5–7
a. (1) Current Ratio = Current Assets ÷ Current Liabilities
2014: $385,000 ÷ $170,000 = 2.26
2015: $400,000 ÷ $460,000 = 0.87
b. Receivables Turnover = Net Credit Sales ÷ Average Accounts Receivable
2014: $780,000 ÷ [($100,000 + $95,000) ÷ 2] = 8.00
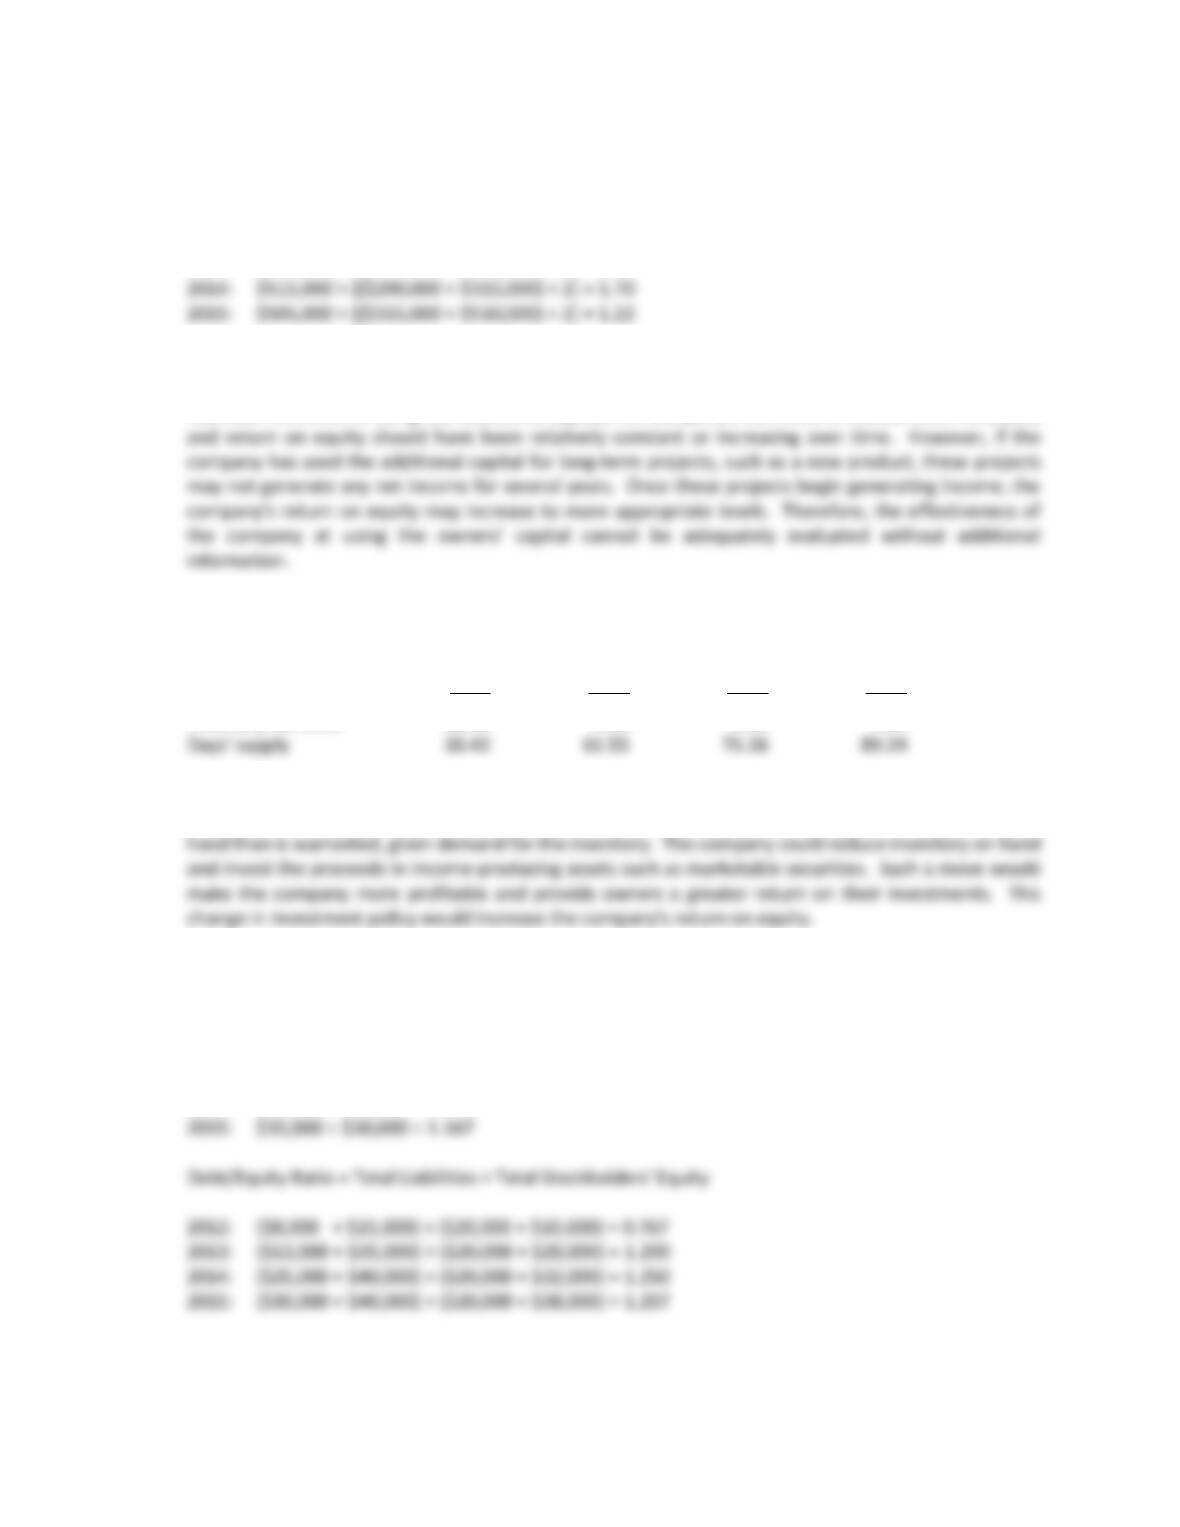
c. Solvency refers to a company’s ability to meet its debts as they come due. Current liabilities represent
the debts that are expected to come due first. Therefore, to be solvent, a company must have
sufficient cash or near-cash assets to meet these current liabilities. Total current assets is one measure
10
E5–8
a. Return on Equity = Net Income ÷ Average Stockholders’ Equity
2012: $510,000 ÷ [($100,000 + $100,000) ÷ 2] = 5.10
2013: $490,000 ÷ [($100,000 + $290,000) ÷ 2] = 2.51
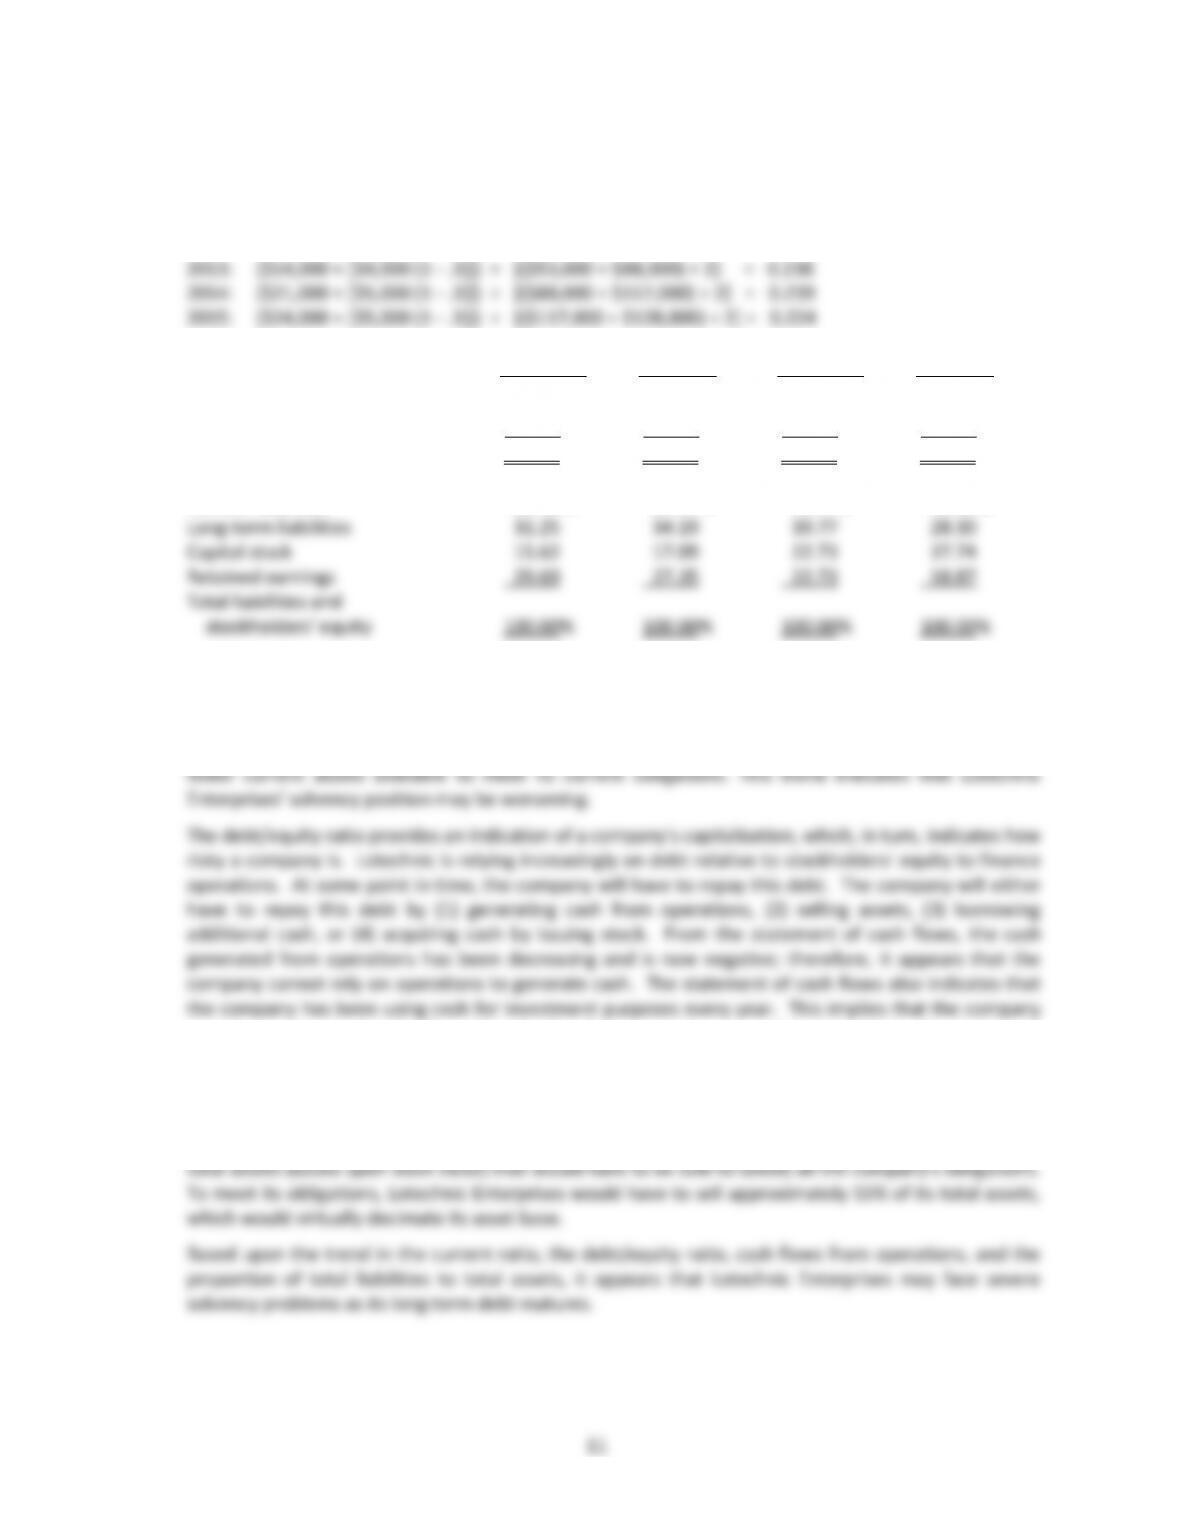
It appears that the additional capital provided by the owners has not been used to generate net
income. The company’s net income has been relatively constant from 2012 to 2015. If the company
had been effective at using the additional capital, the company’s net income should have increased,
b. It appears that the company has overinvested in inventory. The inventory turnover and the days’ supply
of inventory for each year are:
2012 2013 2014 2015
Inventory turnover 12.00 5.93 4.85 4.09
These ratios indicate that the company went from having one month’s supply of inventory on hand to
having almost three months of inventory on hand. It appears that the company has more inventory on
E5–9
a. Current Ratio = Current Assets ÷ Current Liabilities
2012: $20,000 ÷ $8,000 = 2.500
2013: $24,000 ÷ $13,000 = 1.846
2014: $31,000 ÷ $25,000 = 1.240
E5–9 Continued
Return on Assets = (Net Income + [Interest Expense (1 – Tax Rate)]) ÷ Average Total Assets
2012: ($13,000 + [$2,000 (1 – .3)]) ÷ [($53,000] = 0.272
b. 2015 2014 2013 2012
Current assets 27.34% 26.50% 27.27% 37.74%
Noncurrent assets 72.66 73.50 72.73 62.26
Total assets 100.00% 100.00% 100.00% 100.00%
Current liabilities 23.44% 21.37% 14.77% 15.09%
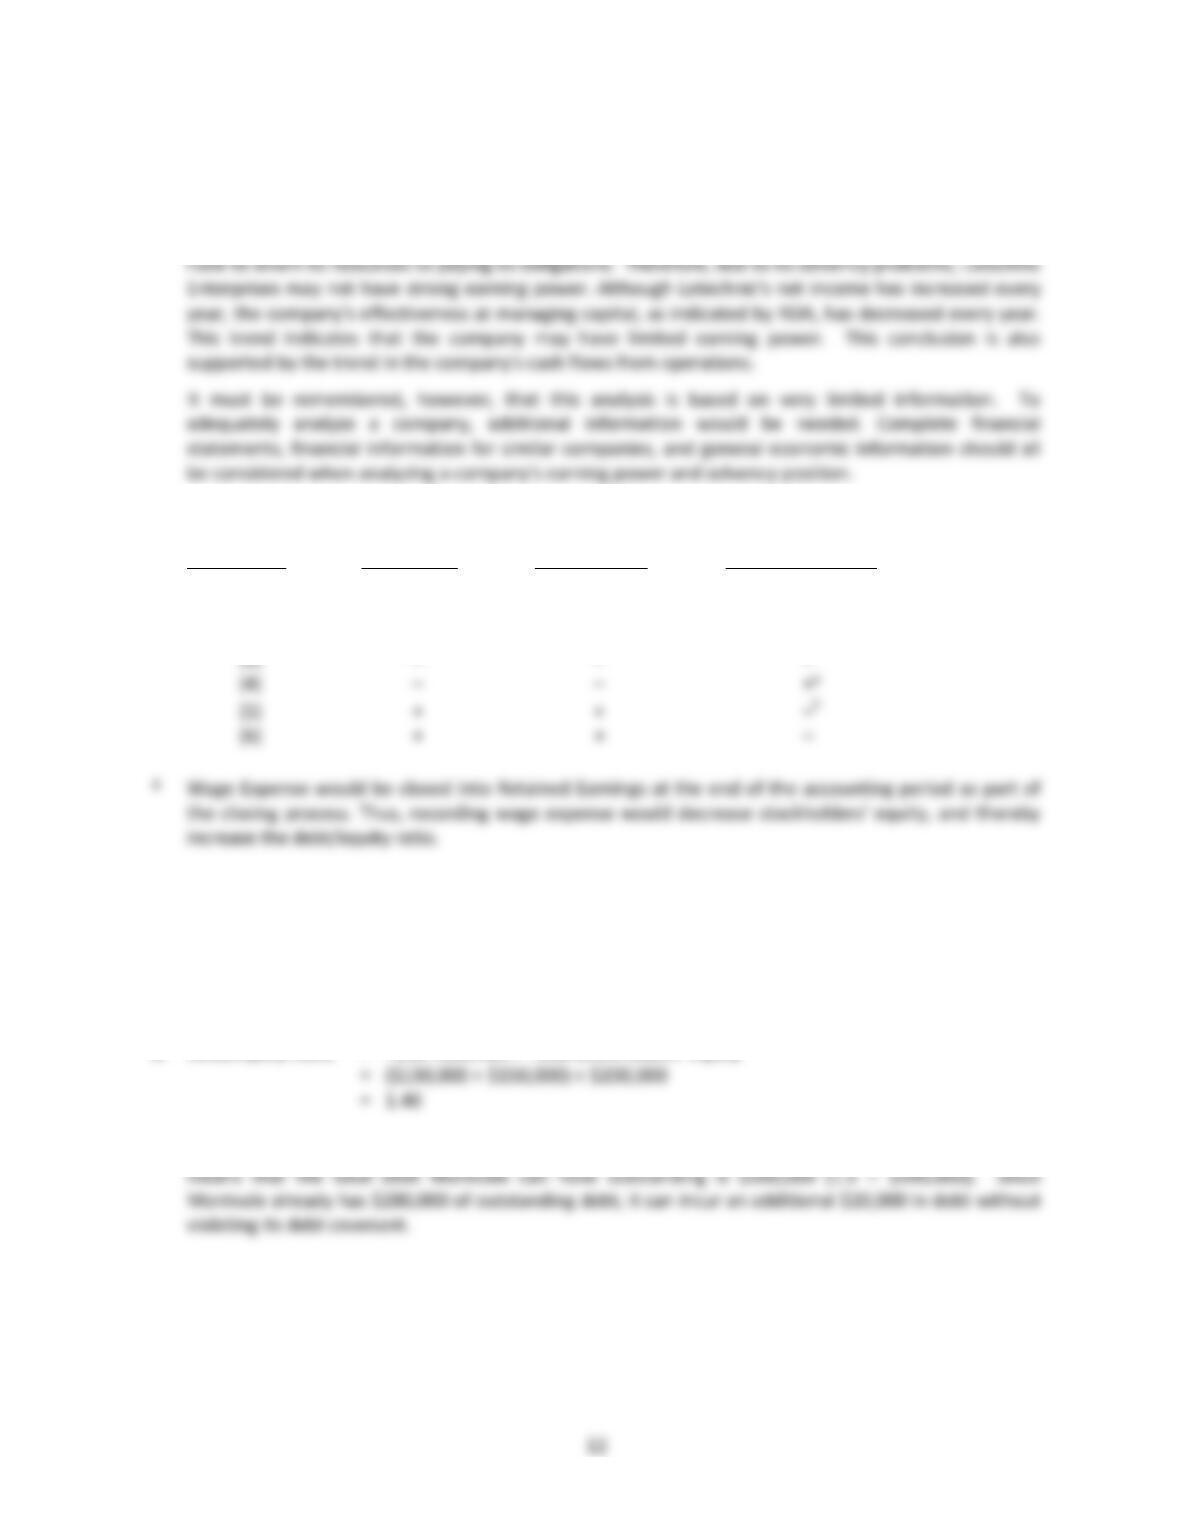
c. Solvency measures a company‘s ability to meet its debts as they come due. The current ratio provides
one measure of a company’s solvency. Based upon this ratio, Lotechnic has sufficient current assets to
meet its current obligations. However, the trend in its current ratio indicates that the company’s
excess of current assets over current liabilities is decreasing. Therefore, the company has relatively
may have some assets that it could sell. But if these assets are used in operations, the company’s
operations may be adversely affected by selling them.
Since total assets equal the sum of total liabilities and stockholders’ equity, the proportion of total
liabilities to the sum of total liabilities and stockholders’ equity reported on the common–size balance
sheet equals the proportion of total liabilities to total assets. This measure indicates the proportion of
E5–9 Concluded
Earning power is defined as a company’s ability to increase its wealth through operations and to
generate cash from operations. Earning power and solvency are closely related. A company must have
adequate resources to generate wealth. If a company experiences solvency problems, it will most likely
E5–10
Transaction Quick Ratio Current Ratio Debt/Equity Ratio
(1) – – +
(2) N E N E +
(3) – – –
b This transaction would increase both Sales and Cost of Goods Sold. Both of these accounts would be
closed into Retained Earnings as part of the closing process. Since the sales price exceeds the cost of
the inventory, the net effect of this transaction would be to increase Retained Earnings. Thus, total
stockholders’ equity would increase, and thereby decrease the debt/equity ratio.
E5–11
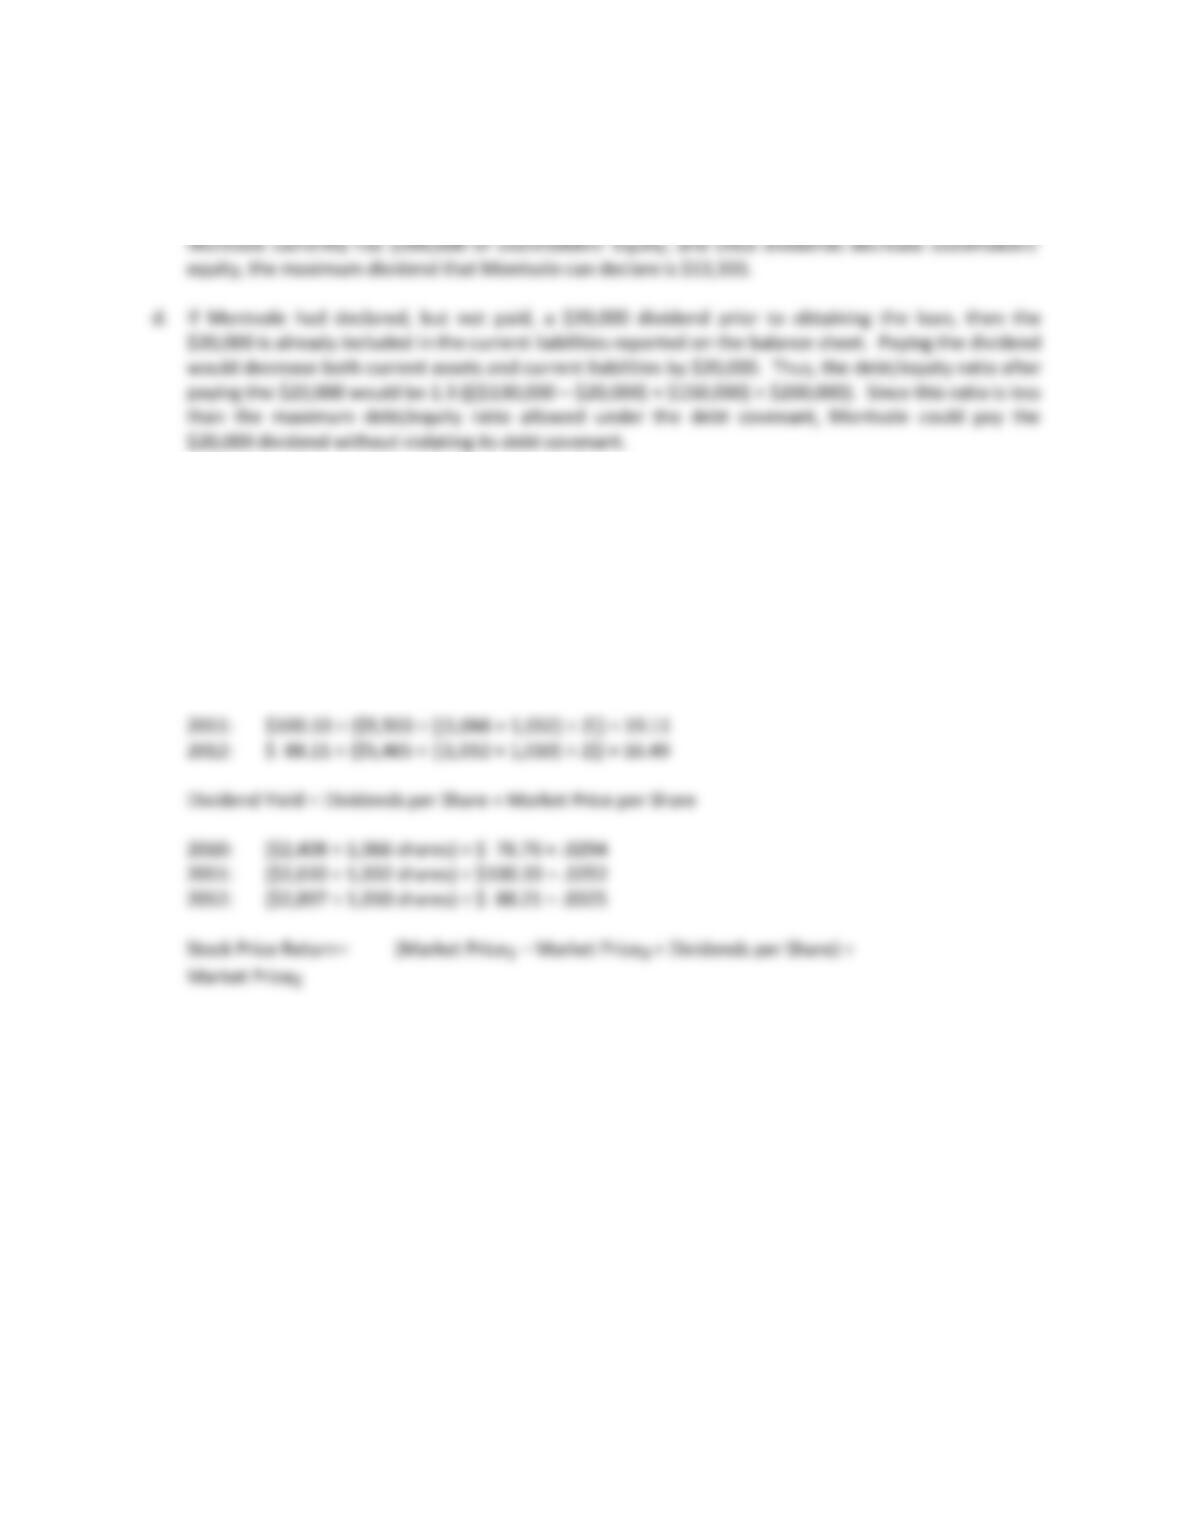
a. Debt/Equity Ratio = Total Liabilities ÷ Total Stockholders’ Equity
b. The maximum debt that Montvale can have outstanding is 1.5 times its total stockholders’ equity. This
13
E5–11 Concluded
c. The minimum level of stockholders’ equity that Montvale can have is total debt divided by 1.5. This
means that the total stockholders‘ equity Montvale can have is $186,667 ($280,000 ÷ 1.5). Since
E5–12
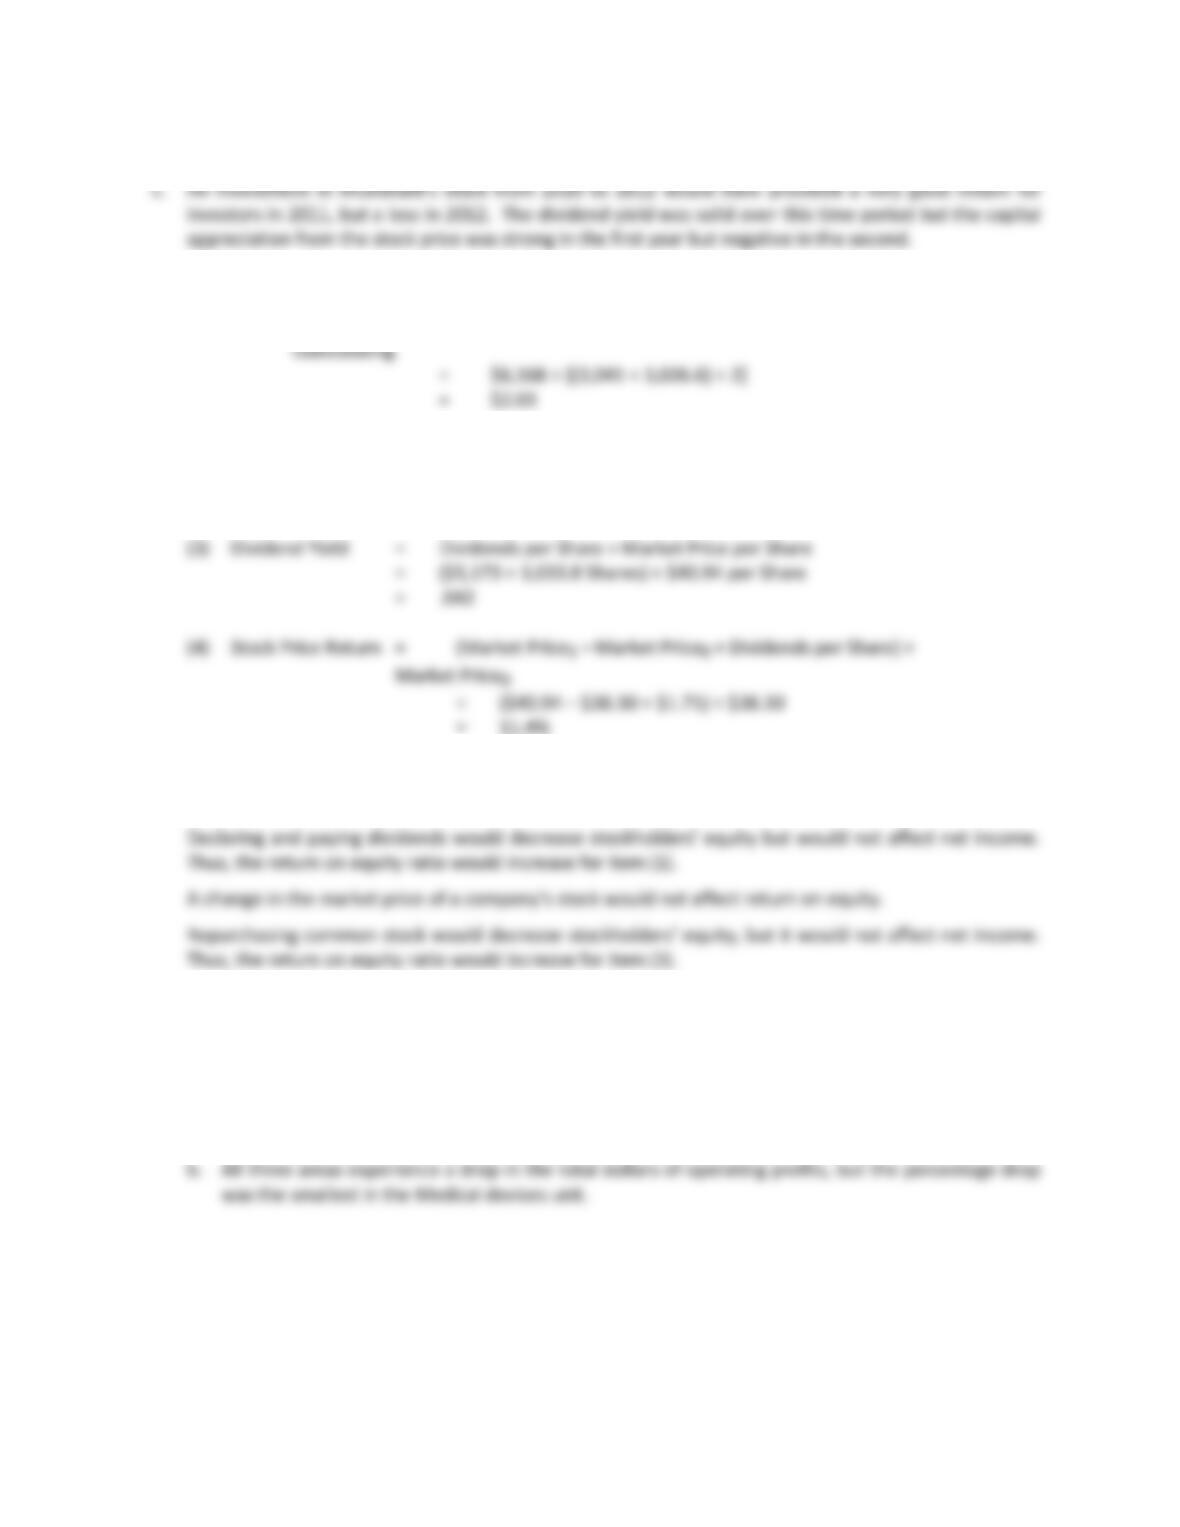
a. 2010: $2,408 ÷ $4,946 = 48.7%
2011: $2,610 ÷ $5,503 = 47.4%
2012: $2,897 ÷ $5,465 = 53.0%
b. Price Earnings Ratio = Market Price per Share ÷ Earnings per Share
= Market Price per Share ÷ (Net Income ÷ Average Number of
Common Shares Outstanding)
2011: ($100.33 – $76.76 + $2.53) ÷ $76.76 = 34.0%
2012: ($88.21 – $100.33 + $2.87) ÷ $100.33 = – 9.22%
14
E5–12 Concluded
E5–13
a. (1) Earnings per Share = Net Income ÷ Average Number of Common Shares
(2) Price/Earnings = Market Price per Share ÷ Earnings per Share
= $40.94 per Share ÷ $2.03 per Share
= 20.17
b. Return on equity equals net income divided by average stockholders’ equity. Thus, only those items
that affect net income or stockholders’ equity would affect a company’s return on equity.
E5–14
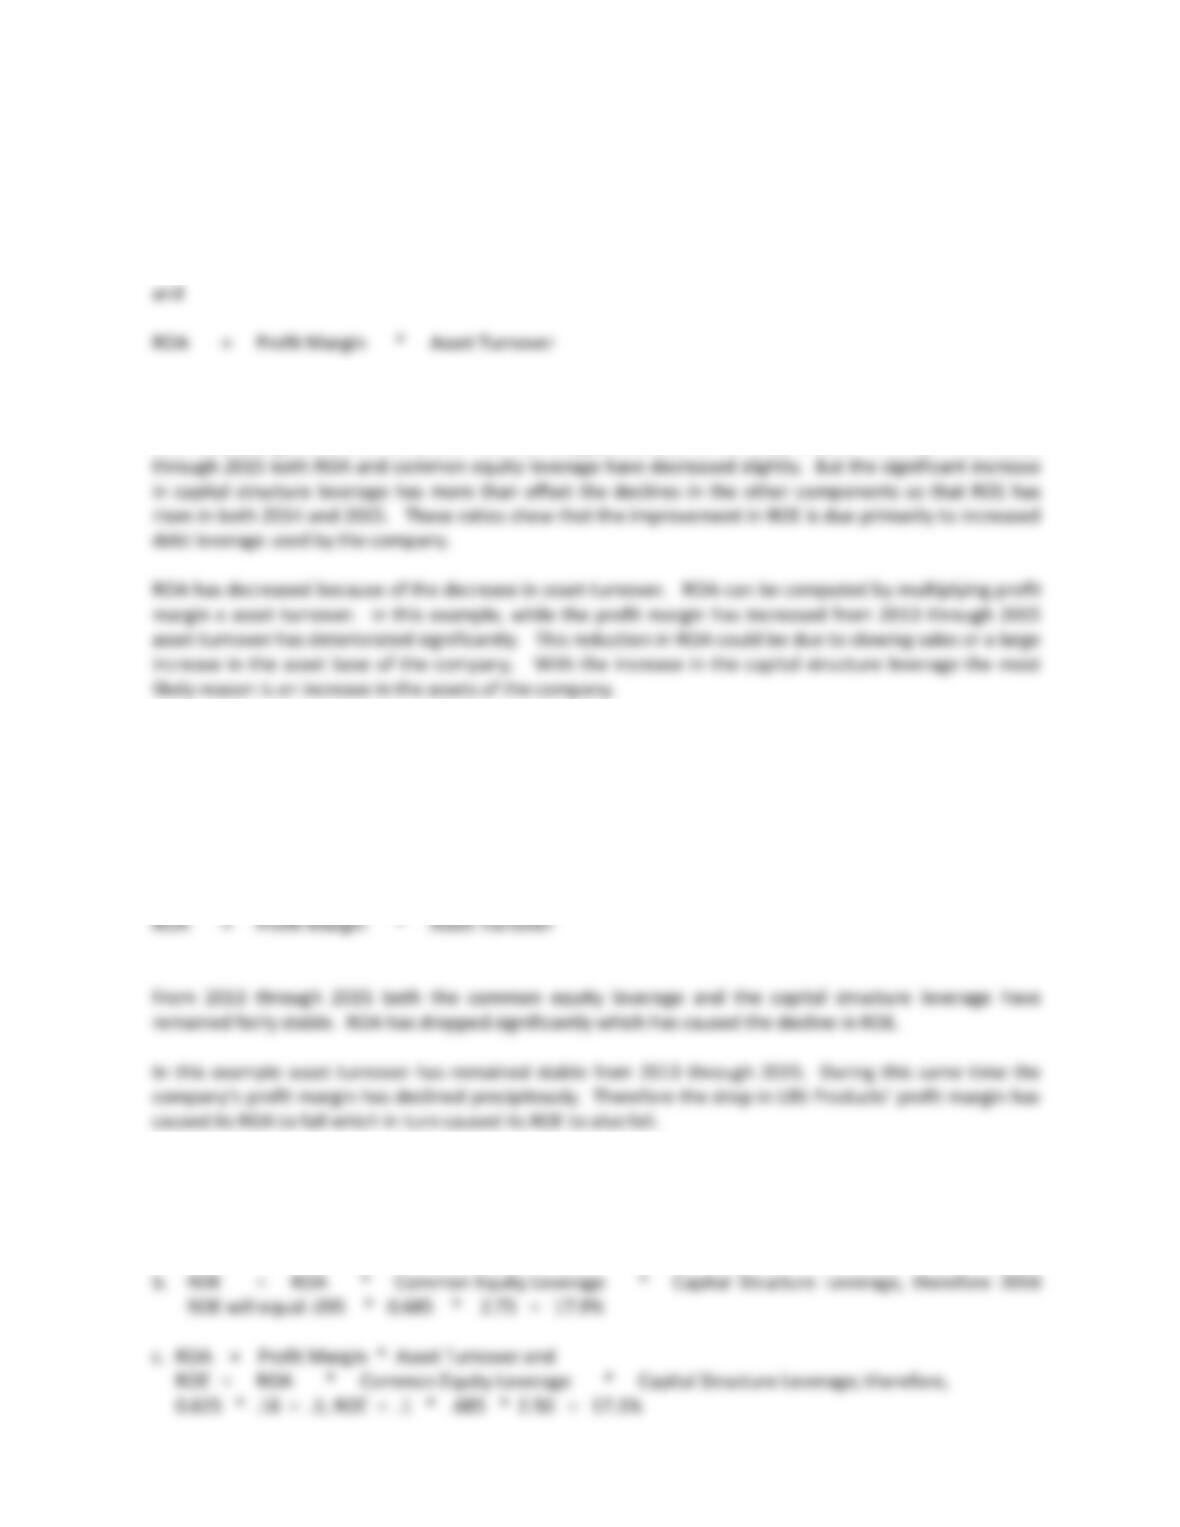
a. Based on the 2012 numbers the Medical devices unit generated the highest operating profits as a
percentage of sales at 26.2%, slightly ahead of the Pharmaceutical unit at 24.0%
15
E5–15
The formulas that are used by the ROEmodel are as follows:
ROE = ROA * Common Equity Leverage * Capital Structure Leverage
The first item that stands out is the steady increase in ROE from 2013 through 2015. This is being driven
completely by the increase in Capital Structure Leverage. Both ROA and Common Equity Leverage have
been decreasing over the three years. ROA has dropped because of the drop in Asset Turnover. From 2013
E5–16
The formulas that are used by the ROE model are as follows:
ROE = ROA * Common Equity Leverage * Capital Structure Leverage
and
E5–17
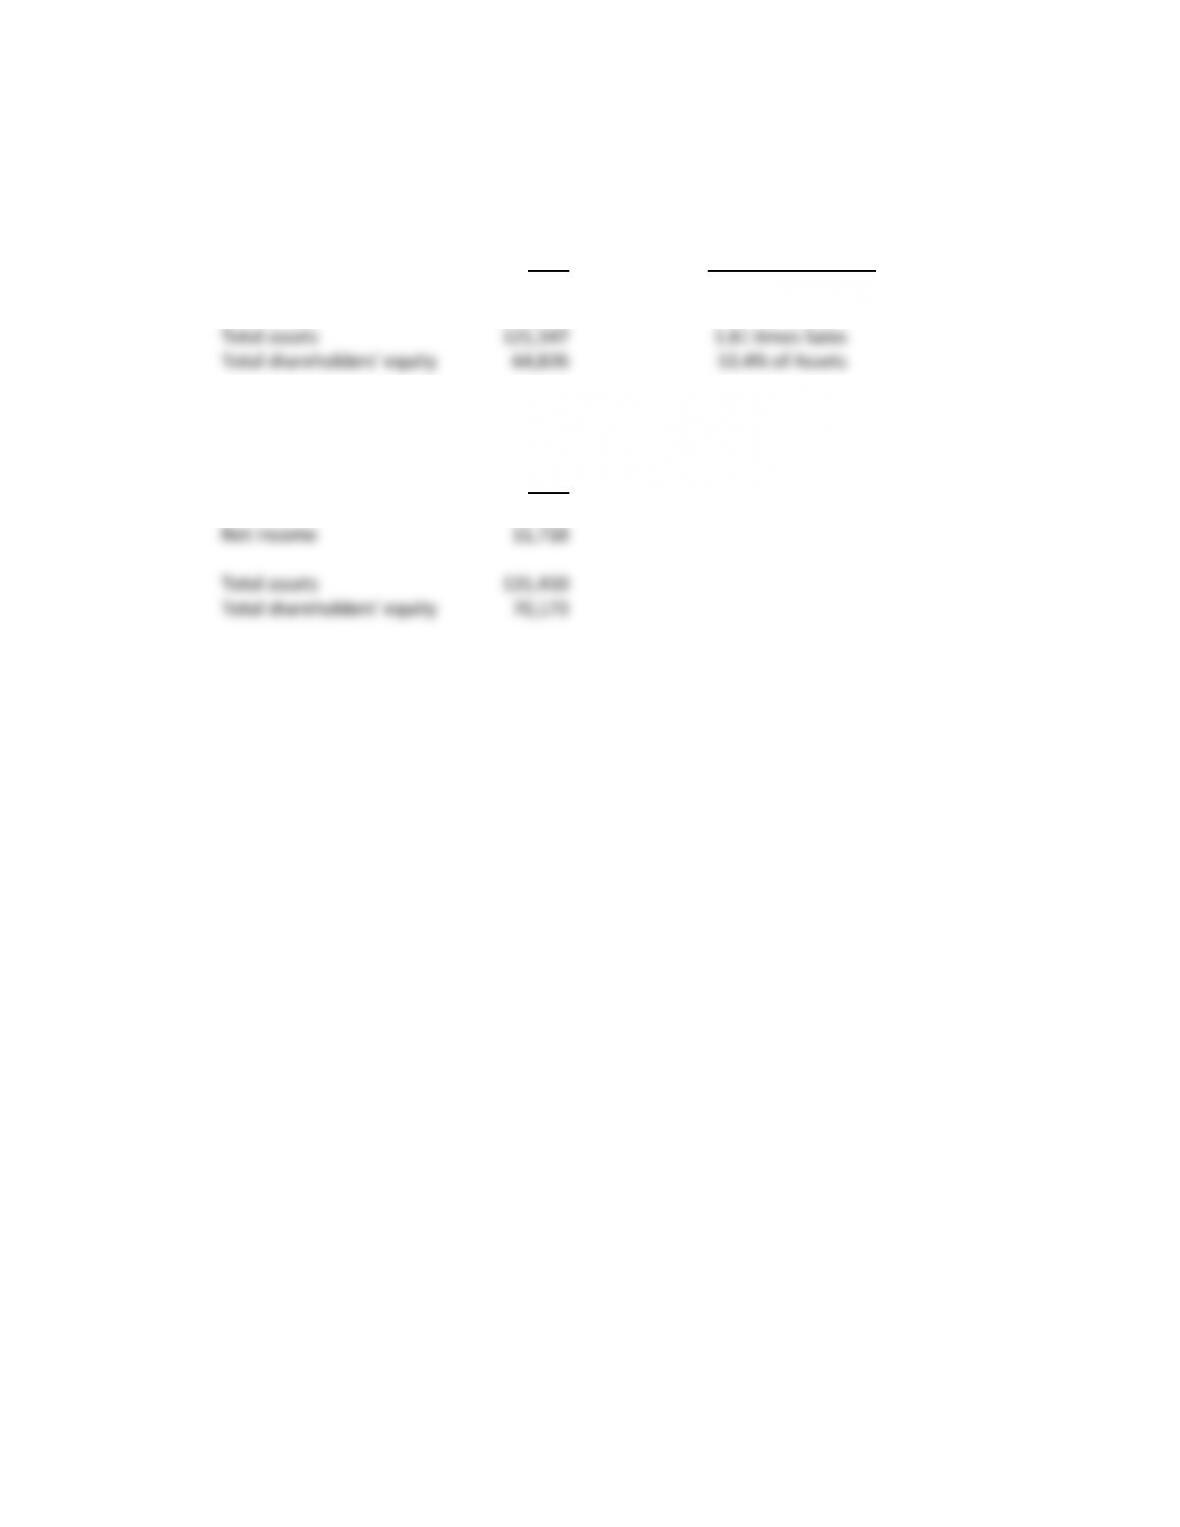
a. ROE = ROA * Common Equity Leverage * Capital Structure Leverage;
therefore, ROE = .095 * 0.685 * 2.50 = 16.3%
16
E5–18
2012 Historic Relationship
Sales $67,224 NA
Net income 10,853 16.14% of Sales
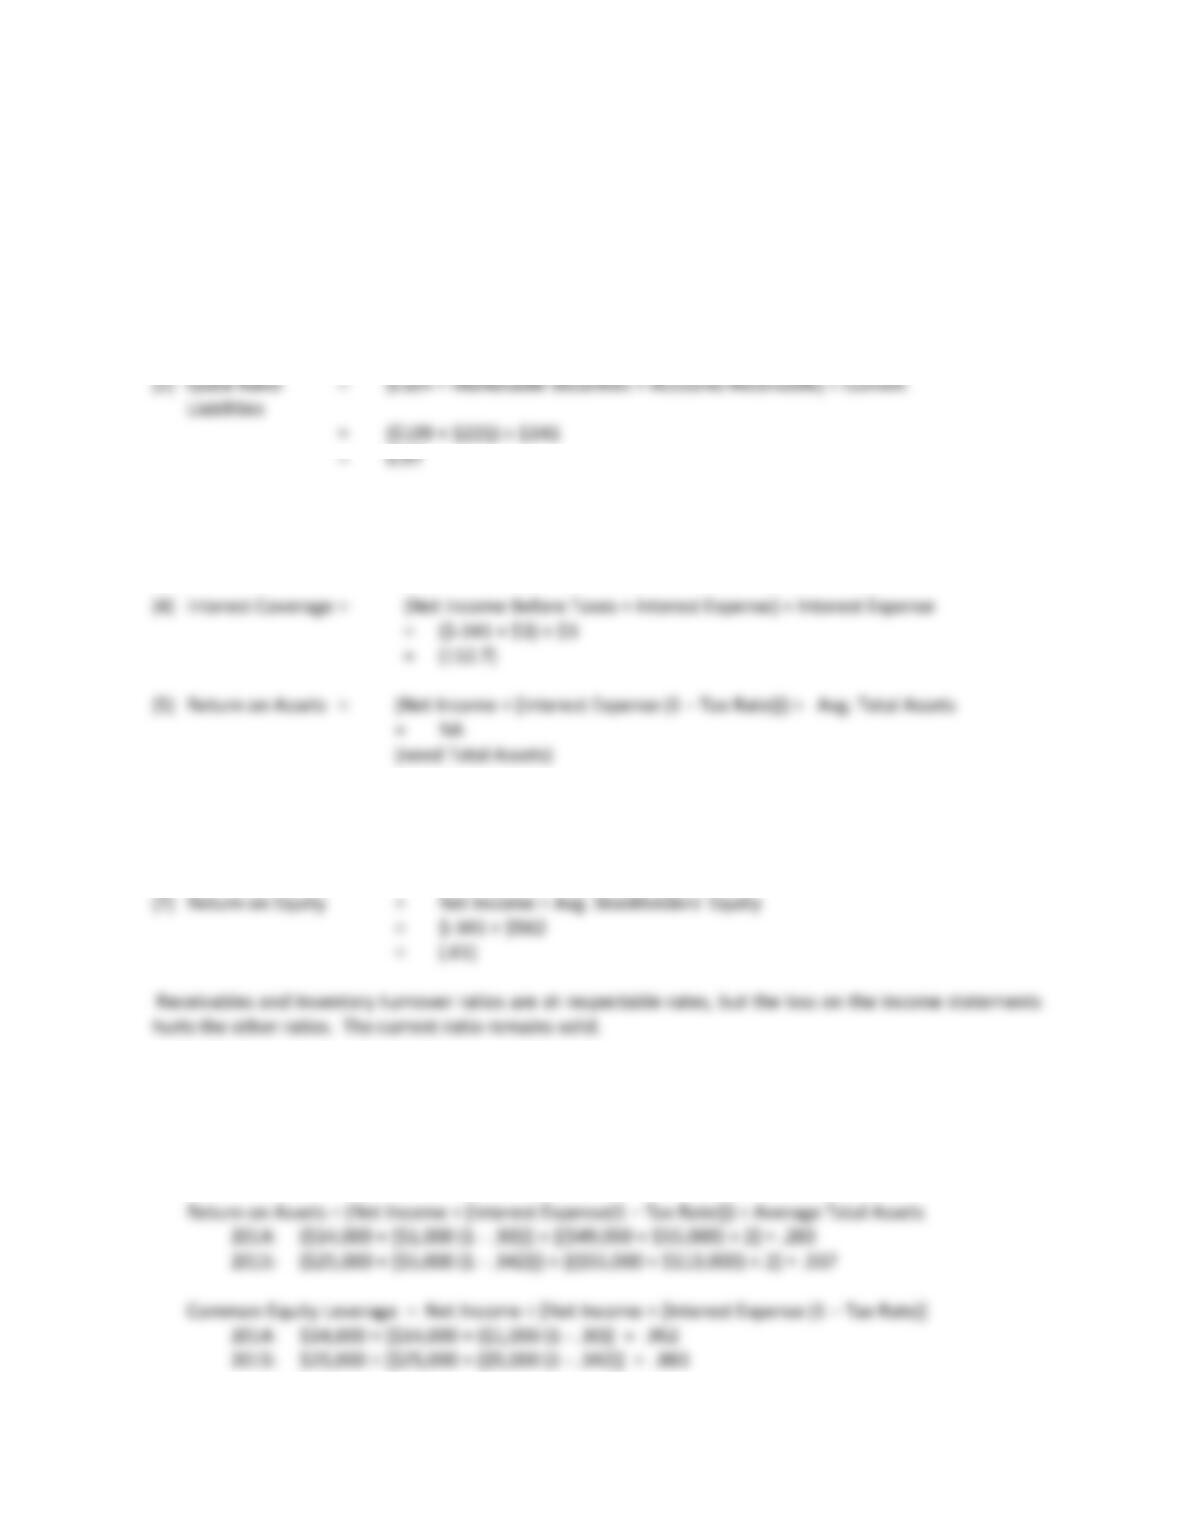
If Sales are projected to grow at 8% and if the historic relationships maintain, the projected 2013 financial
statements can be summarized below:
2013
Sales $72,602
17
PROBLEMS
P5–1
(1) Current Ratio = Current Assets ÷ Current Liabilities
= $557 ÷ $341
= 1.63
(3) Receivables Turnover = Net Credit Sales ÷ Average Accounts Receivables
= $1,100 ÷ ((221 + 235) ÷ 2)
= 4.82
(6) Inventory Turnover = Cost of Goods Sold ÷ Avg. Inventory
= $897 ÷ $187.5
= 4.78
P5–2
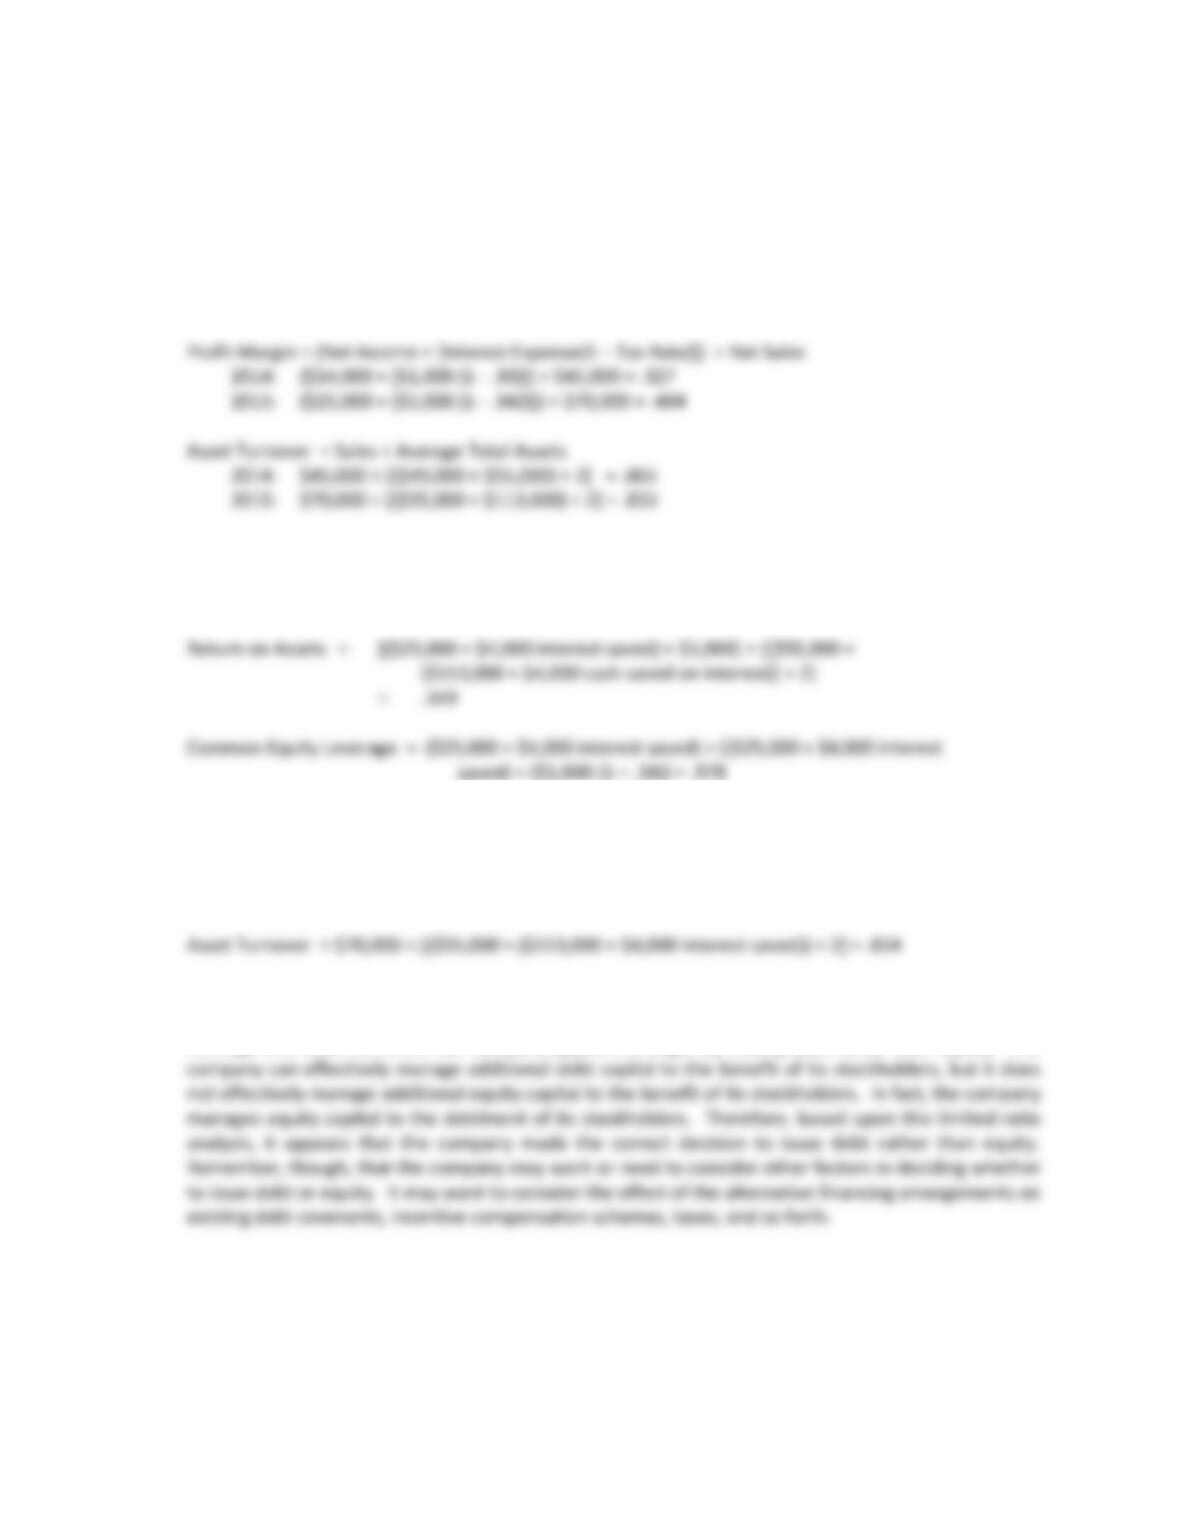
a. Return on Equity = Net Income ÷ Average Stockholders’ Equity
2014: $14,000 ÷ [($34,000 + $38,000) ÷ 2] = .389
2015: $25,000 ÷ [($38,000 + $51,000) ÷ 2] = .562
18
P5–2 Concluded
Capital Structure Leverage = Average Total Assets ÷ Average Shareholders’ Equity
2014: [($49,000 + $55,000) ÷ 2] ÷ [($34,000 + $38,000) ÷ 2] = 1.444
2015: [($55,000 + $113,000) ÷ 2] ÷ [($38,000 + $51,000) ÷ 2] = 1.888
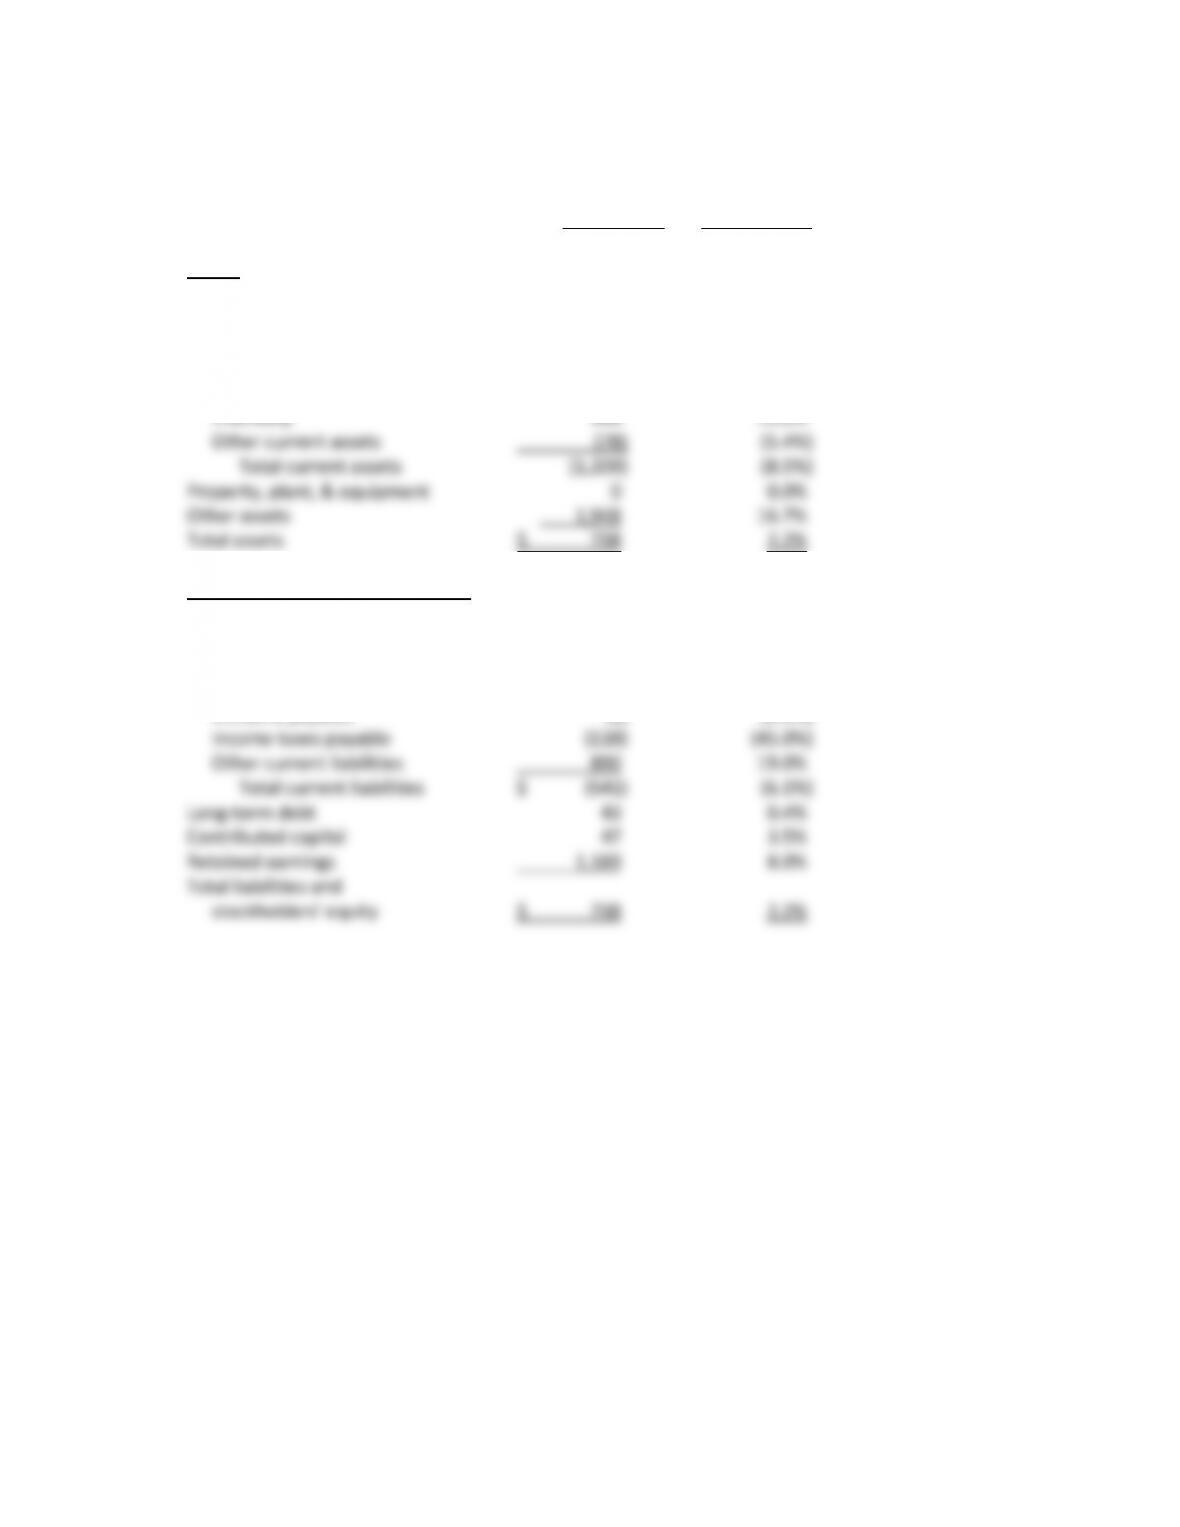
b. Return on Equity = ($25,000 + $4,000 interest saved) ÷ {[($38,000 + $40,000) +
($51,000 + $40,000 + $4,000 interest saved)] ÷ 2}
= .335
Capital Structure Leverage = [($55,000 + ($113,000 + $4,000 interest saved)) ÷ 2] ÷ [$38,000 +
($51,000 + $4,000 interest saved) ÷ 2] = 1.849
Profit Margin = [($25,000 + $4,000 interest saved) + ($1,000 (1 – .34)] ÷ $70,000 = .424
c. The company appears stronger by issuing equity rather than debt if one examines return on assets,
common equity leverage and profit margin. However, based on return on equity, capital structure
leverage and asset turnover, the company appears stronger by issuing debt rather than equity. The
19
P5–3
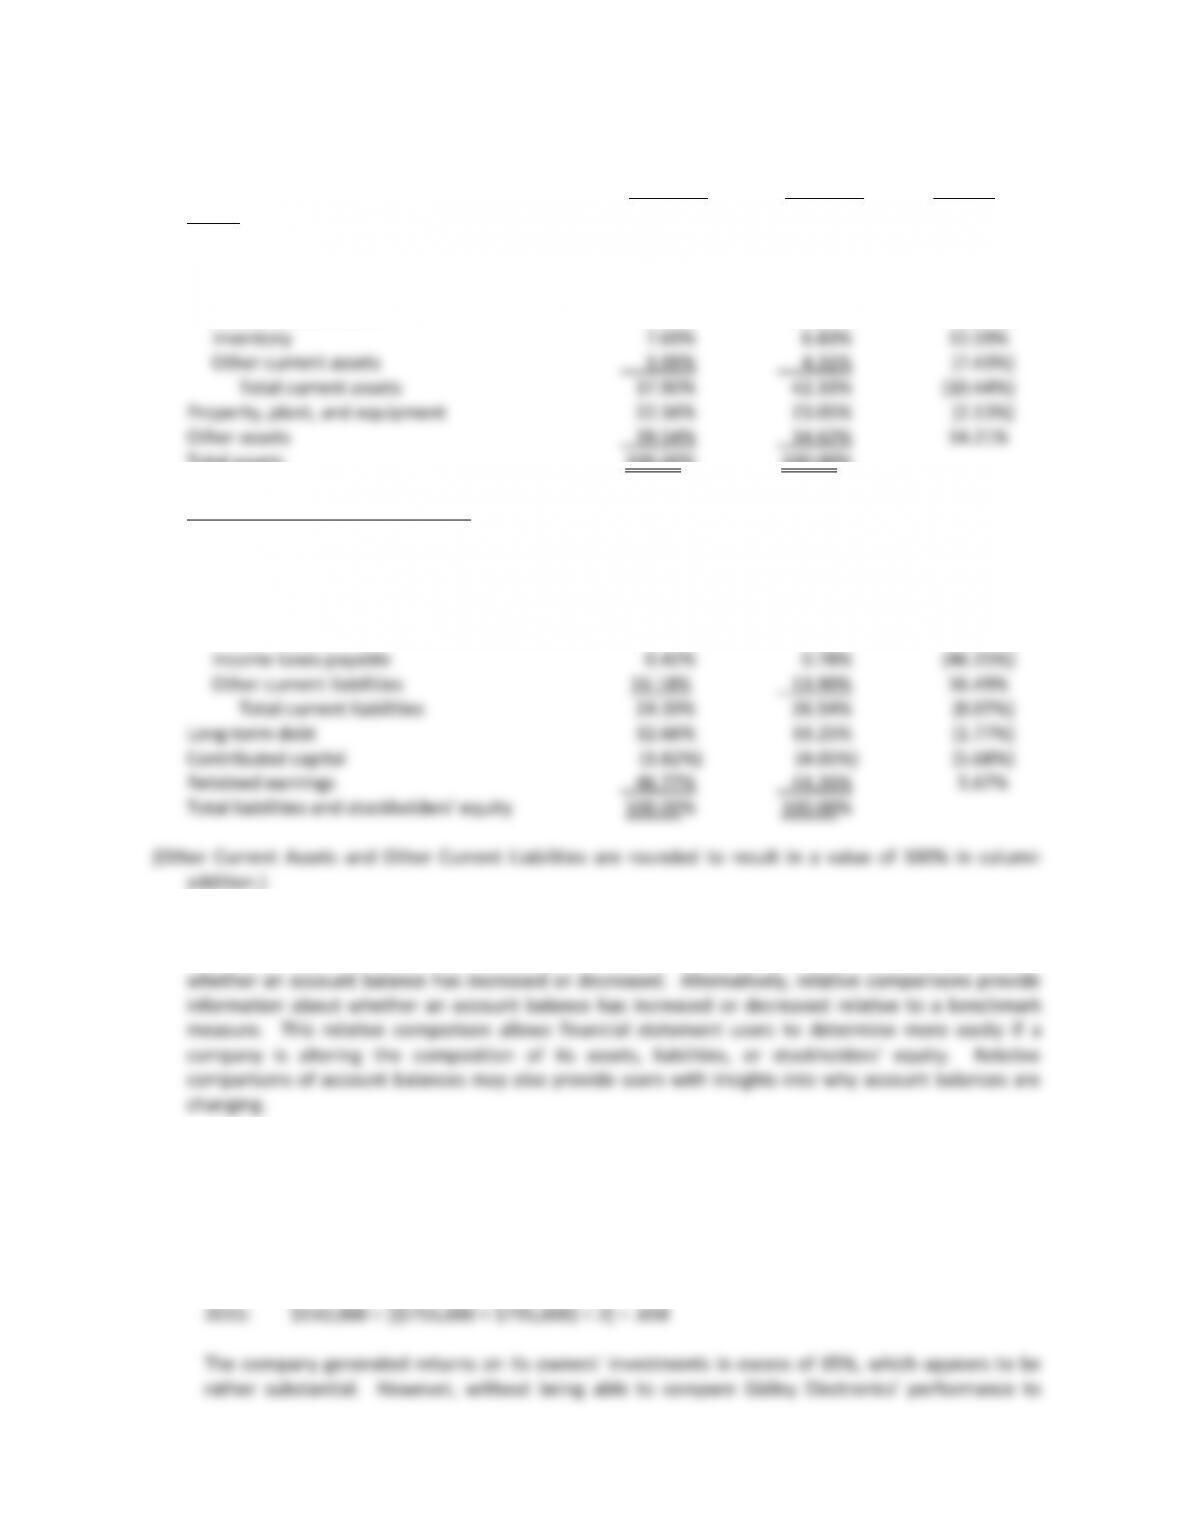
a. Dollar Percentage
Change Change
Assets
Current assets:
Cash $ (1,904) (32.2%)
Short-term marketable
securities 691 70.9%
Accounts receivable (262) (7.3%)
Liabilities and Stockholders’ Equity
Current liabilities:
Short-term borrowings $ (1,510) (99.2%)
Accounts payable 63 5.6%
Wages payable 135 16.8%
Dividend payable (1) (0.2%)
20
P5–3 Concluded
b. 2012 2011 Change
Assets
Current assets:
Cash 11.68% 17.60% (33.64%)
Short-term marketable securities 4.84% 2.90% 66.90%
Accounts receivable 9.70% 10.69% (9.26%)
Total assets 100.00% 100.00%
Liabilities and Stockholders’ Equity
Current liabilities:
Short-term borrowings 00.03% 4.52% (99.34%)
Accounts payable 3.45% 3.34% 3.29%
Wages payable 2.73% 2.39% 14.23%
Dividend payable 1.57% 1.61% (2.48%)
c. Common-size financial statements provide relative comparisons of account balances rather than
absolute comparisons of account balances. Absolute comparisons only provide information about
P5–4
(1) Return on equity measures a company’s effectiveness at managing equity investments. Return on
equity is calculated as net income divided by average stockholders‘ equity.
2014: $515,000 ÷ [($450,000 + $755,000) ÷ 2] = .855