Chapter 12 – Financial Statement Analysyis
Exercise 12–10
12–12
Abercrombie and Fitch. Therefore, American Eagle has a stronger
liquidity position than Abercrombie & Fitch.
b. Abercrombie and Fitch’s current ratio is lower than the industry
to 2011 when the industry average has decreased. Overall,
Abercrombie and Fitch’s liquidity position is not a strong as the
industry average.
better liquidity position than the industry average.
Chapter 12 – Financial Statement Analysyis
12–13
SOLUTIONS TO PROBLEMS
Problem 12–14
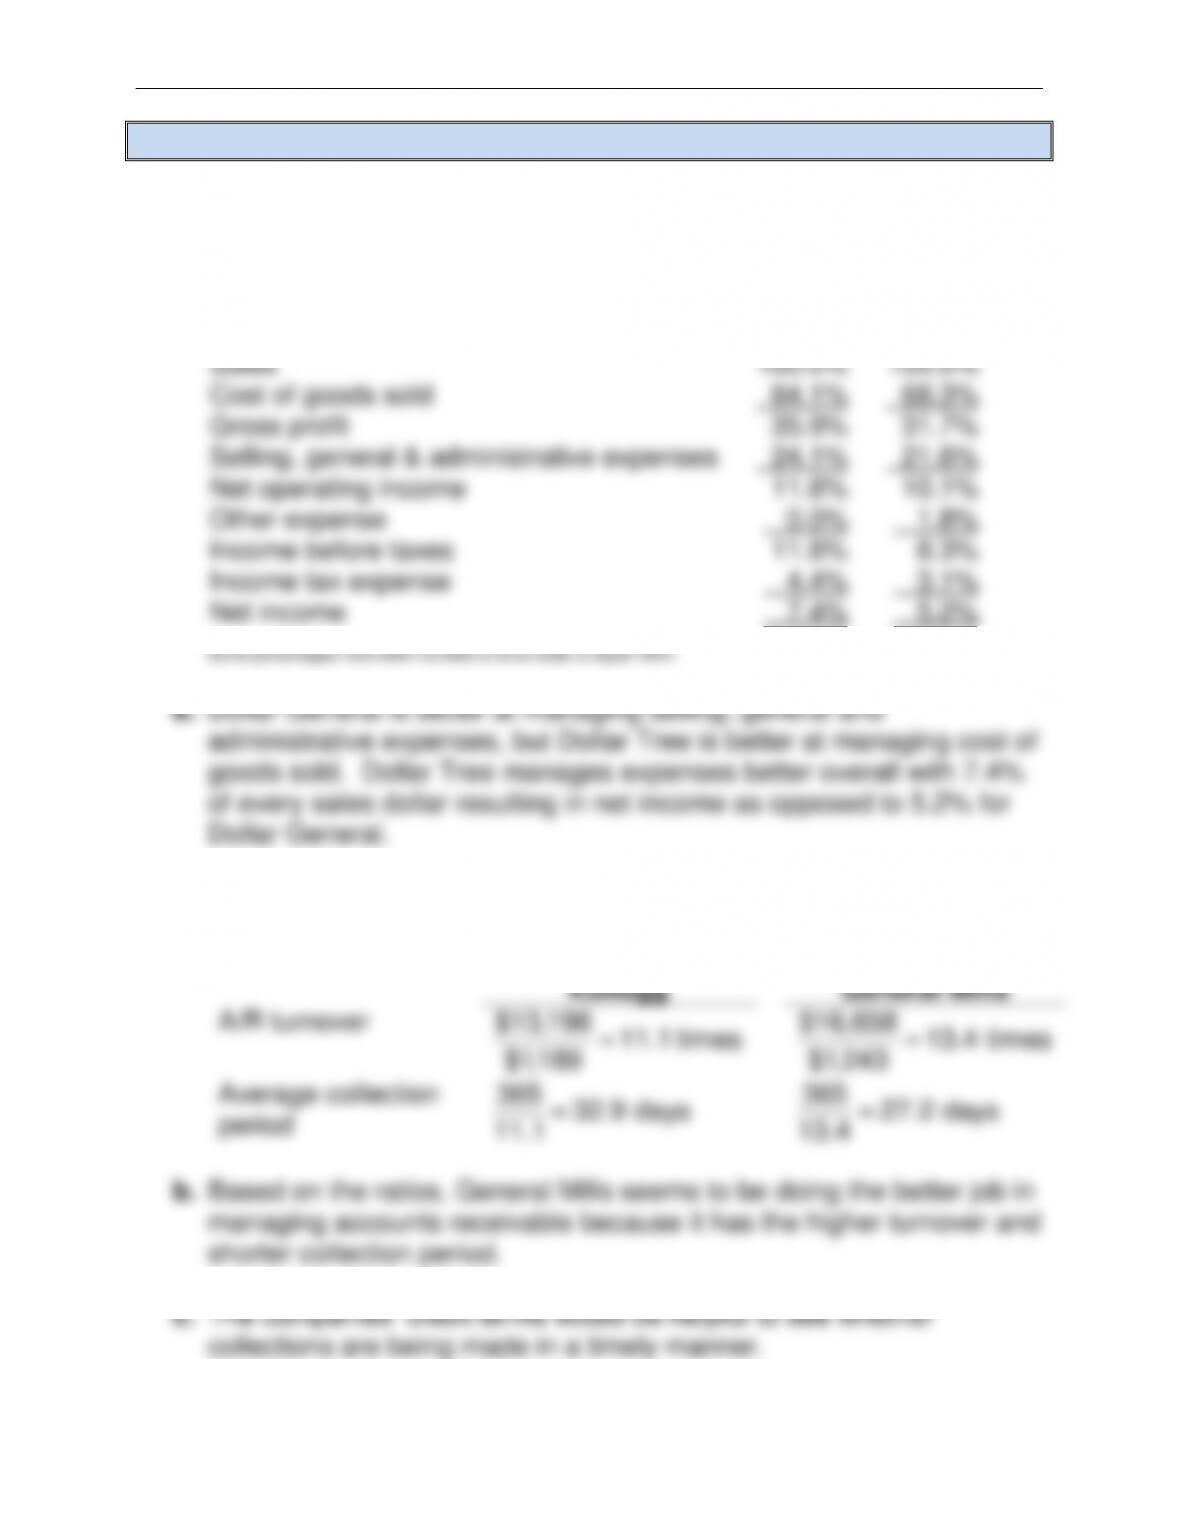
a.
Dollar
Tree
Dollar
General
Sales
100.0%
100.0%
Cost of goods sold
64.1%
68.3%
Gross profit
35.9%
31.7%
Selling, general & administrative expenses
24.1%
21.6%
Net operating income
11.8%
10.1%
Other expense
0.0%
1.8%
Income before taxes
11.8%
8.3%
Income tax expense
4.4%
3.1%
Net income
7.4%
5.2%
Problem 12–15
a.
Kellogg
General Mills
A/R turnover
$13,198 11.1 times
$1,189
$16,658 13.4 times
$1,243
Average collection
period
365 32.9 days
11.1
365 27.2 days
13.4
b. Based on the ratios, General Mills seems to be doing the better job in
managing accounts receivable because it has the higher turnover and
shorter collection period.
Solutions for Davis & Davis, Managerial Accounting, 2nd ed.
Problem 12–16
a.
Company A
Company B
Inventory
turnover
$27,303.1= 9.9 times
$2,758.1
times 37.5
5.949,4$
558,26$
Average days to
sell inventory
day s 9.36
9.9
365
day s 68
37.5
365
b. Company A is Safeway, Inc. and Company B is Caterpillar, Inc.
because Company A has the higher inventory turnover. Food is sold
quicker than construction equipment.
Problem 12–17
a.
Mercer, Inc.
Tivolian
Inventory
turnover
times 10
000,000,1$
000,000,10$
times 6.7
000,250,1$
000,500,9$
Mercer has the higher inventory turnover.
b. The inventory ratios differ because inventory is being valued
Problem 12–18
a.
( )
$2,929
Return on assets = = 6.5%
$46,630 + $43,705 /2
Chapter 12 – Financial Statement Analysyis
12–15
Problem 12–19
b. KayNet’s profitability is slightly better than the industry average. The
return on assets and gross margin of KayNet are increasing and are
a little better than the average.
d. With the P/E ratio decreasing and below the industry average, the
e. Based on the ratios, the positives seem to slightly outweigh the
12–16
Problem 12–20
Wendy’s.
b. Relatively, McDonald’s uses more debt because of its higher debt–to–
equity ratio of .98.
viewed as industry leaders.
d. As industry leaders, these companies should be reporting the kinds of
Chapter 12 – Financial Statement Analysyis
12–17
SOLUTIONS TO C&C CONTINUING CASES
Case 12–21
C&C also has a much higher level of property, plant, and equipment than
Looking at liabilities, C&C Sports carries higher levels of accounts payable,
C&C Sports’ income statement is not a strong as the industry average.
The industry average gross profit of 37.7% is much higher than C&C
gross profit.
C&C Sports’ current ratio and quick ratio are lower than the industry
While C&C Sports’ performance exceeds the industry average in some
areas, overall, its financial position is weaker than the industry average.
12–18
SOLUTIONS TO CASES
Case 12-22
a.
2013
2012
$ change
% change
Sales revenue
$576,600
$523,000
$53,600
10.2%
Cost of goods sold
291,000
259,200
31,800
12.3%
Gross profit
285,600
263,800
21,800
8.3%
Operating expenses
106,200
104,600
1,600
1.5%
Operating income
179,400
159,200
20,200
12.7%
Other revenue
22,500
15,900
6,600
41.5%
Interest expense
11,200
10,500
700
6.7%
Income before taxes
190,700
164,600
26,100
15.9%
Income tax expense
76,280
65,840
10,440
15.9%
Net income
$114,420
$98,760
$15,660
15.9%
Chapter 12 – Financial Statement Analysyis
12–19
Case 12-22, continued
2013
2012
$ change
% change
Assets
Cash
$32,000
$25,800
$6,200
24.0%
Accounts receivable, net
126,860
127,000
(140)
(0.1%)
Inventory
60,000
80,700
(20,700)
(25.7%)
Prepaid expenses
11,000
10,000
1,000
10.0%
Total current assets
229,860
243,500
(13,640)
(5.6%)
Property & equipment (net)
668,900
576,000
92,900
16.1%
Total assets
$898,760
$819,500
$79,260
9.7%
Liabilities & Stockholders’
Equity
Accounts payable
$53,120
$81,200
$(28,080)
(34.6%)
Accrued expenses
11,000
12,240
(1,240)
(10.1%)
Total current liabilities
64,120
93,440
(29,320)
(31.4%)
Long-term debt
170,000
160,000
10,000
6.3%
Total liabilities
234,120
253,440
(19,320)
(7.6%)
Stockholders’ equity:
Common stock
6,000
6,000
0
0.0%
Additional paid-in capital
99,000
99,000
0
0.0%
Retained earnings
559,640
461,060
98,580
21.4%
Total stockholders’ equity
664,640
566,060
98,580
17.4%
Total liabilities &
stockholders’ equity
$898,760
$819,500
$79,260
9.7%
increase in operating income.
While the change in total current assets is not that large, it is the
result of two significant changes – the increase in cash and the
12–20
Case 12-22, continued
the amount of inventory needed on hand. The increase in property
and equipment suggests that the company is expanding.
Stockholders’ equity increased due to net income, less the dividends
paid to shareholders.
b.
2013
2012
2011
Sales revenue
100.0%
100.0%
100.0%
Cost of goods sold
50.5%
49.6%
48.4%
Gross profit
49.5%
50.4%
51.6%
Operating expenses
18.4%
20.0%
21.5%
Operating income
31.1%
30.4%
30.1%
Other revenue
3.9%
3.0%
4.9%
Interest expense
1.9%
2.0%
2.5%
Income before taxes
33.1%
31.4%
32.5%
Income tax expense
13.2%
12.6%
13.0%
Net income
19.9%
18.8%
19.5%