Chapter 12 – Financial Statement Analysyis
12-1
Financial Statement Analysis
Learning Objectives
company’s performance. (Unit 12.1)
company’s performance. (Unit 12.2)
3. Calculate and interpret basic financial statement ratios. (Unit 12.3)
4. Explain how to use sources of industry information to draw conclusions about a company’s
performance. (Unit 12.4)
Summary of End of Chapter Material
Difficulty: E = Easy, M = Moderate, D = Difficult
Bloom: K = Knowledge, C = Comprehension, AP = Application, AN = Analysis, S = Synthesis, E = Evaluation
AACSB: A = Analytic, C = Communication, E = Ethics
AICPA FN: DM = Decision modeling, RA = Risk Analysis, M = Measurement, R = Reporting, RS = Research, T = Technology
AICPA PC: C = Communication, I = Interaction, L = Leadership, P = Professional Demeanor, PM = Project Management,
PS = Problem Solving and Decision Making, T = Technology
IMA: BA = Business Applications, BP = Budget Preparation, CM = Cost Management, DA = Decision Analysis,
FSA = Financial Statement Analysis, ID = Investment Decisions, PM = Performance Measurement, R = Reporting,
SP = Strategic Planning
Item
L. O.
Difficulty
Level
Minutes to
Complete
Bloom’s
Taxonomy
AACSB
AICPA
FN
AICPA
PC
IMA
Ethics
Coverage
GUIDED UNIT PREPARATION
Unit 12.1
1
1
M
5
K
A
M
PS
R
2
1
M
3
C
A
M
PS
R
3
1
D
3
C
A
M
PS
R
Unit 12.2
1
2
E
6
K
A
M
PS
R
2
2
M
4
C
A
M
PS
R
3
2
D
3
C, AN
A
M
PS
R
4
2
D
3
C, AN
A
M
PS
R
5
2
D
4
C, AN
A
M
PS
R
Unit 12.3
1
3
E
2
K
A
M
PS
R
2
3
M
3
C
A
M
PS
FSA
3
3
M
5
C, AN
A
M
PS
FSA
4
3
D
3
C, AN
A
M
PS
FSA
5
3
M
3
C
A
M
PS
FSA
6
3
E
3
K
A
M
PS
FSA
7
3
M
3
C
A
M
PS
FSA
8
3
M
2
C
A
M
PS
FSA
9
3
E
2
K
A
M
PS
FSA
10
3
M
2
C, AN
A
M
PS
FSA
11
3
M
3
C
A
M
PS
FSA
12
3
D
4
C, AN
A
M
PS
FSA
13
3
D
3
C, AN
A
M
PS
FSA
Item
L. O.
Difficulty
Minutes
Bloom’s
AACSB
AICPA
AICPA
IMA
Ethics
CHAPTER
12
photo: © jsnyderdesign / iStockphoto
Solutions for Davis & Davis, Managerial Accounting, 2nd ed.
12-2
Level
to
Complete
Taxonomy
FN
PC
Coverage
Unit 12.4
1
4
E
3
K
C
R
C
R
2
4
M
2
C
C
R
C
R
3
4
M
2
C
A
R
C
PM
EXERCISES
12-1
1
E
8-10
AP
A
M
PS
R
12-2
1
M
6-8
AP
A
M
PS
R
12-3
1
M
18–20
AP, AN
A
M
PS
R
12-4
2
E
15
AP
A
M
PS
R
12-5
2
E
18–20
AP, AN
A
M
PS
R
12-6
2
E
20
AP
A
M
PS
R
12-7
3
M
5
AN
A
M
PS
FSA
12-8
3
M
18–20
AP
A
M
PS
FSA
12-9
3
M
8-10
AP
A
M
PS
FSA
12–10
3
D
8-10
AP
A
M
PS
FSA
12–11
3
M
8
AP
A
M
PS
FSA
12–12
4
E
5-7
AP
C
M
PS
R
12–13
3, 4
M
10–15
AN
A
M
PS
R
PROBLEMS
12–14
2
E
10–15
AP, AN
A
M
PS
R
12–15
3
E
12
AP, AN, E
A
M
PS
FSA
12–16
3
M
12
AP, AN
A
M
PS
FSA
12–17
3
E
12
AP, AN
A
M
PS
FSA
12–18
3
E
12
AP, AN
A
M
PS
FSA
12–19
3
M
15–20
AN, E
A
M
PS
FSA
12–20
3, 4
D
20
AN, E
A
M
PS
R
C&C CONTINUING CASE
12–21
1, 2,
3, 4
D
20
AN, E
A
M
PS
FSA
CASES
12–22
1, 2,
3
M
60–70
AP, AN
A
M
PS
FSA
12–23
3
D
25–30
AP, AN, E
A
M
PS
FSA
12–24
1, 2,
3
M
60–70
AP, AN
A
M
PS
FSA, R
12–25
3
D
20–25
AP, AN, E
E
R
C
BA
Chapter 12 – Financial Statement Analysyis
12-3
SOLUTIONS TO GUIDED UNIT PREPARATION
Unit 12-1
1. Horizontal analysis involves examining the changes in the account
expressed as a dollar amount or as a percentage of the previous
year’s balance.
2. Trend analysis is a form of horizontal analysis where each year’s
account balance.
3. Trend analysis is used to evaluate changes in account balances over
Unit 12-2
1. Common-size financial statements show every account balance as
common-size income statements, all accounts are expressed as a
100% figure.
2. Common-size balance sheets will reveal trends in the composition
expenses and how much of sales is left in profit.
3. An increase in the common-size percentage for Bonds Payable
12-4
4. A higher common-size Accounts Receivable percentage for
5. Cost of Goods Sold increasing as a percentage of Sales might
well as it had been in the past.
Unit 12-3
1. Working capital is the difference between a firm’s current assets
and its current liabilities.
2. A current ratio of 2.0 means that there are $2.00 of current assets
as current liabilities.
3. The acid-test ratio is a more stringent measure of liquidity than the
guarantee that they will be converted to cash at their stated value.
4. If the company has a disproportionately large amount of inventory or
the acid-test ratio to be small.
5. A high accounts receivable turnover may indicate that the credit
customers who cannot qualify for credit.
Chapter 12 – Financial Statement Analysyis
12-5
6. A high inventory turnover indicates that a company’s inventory is
considered to be good.
7. A .60 debt ratio means that 60% of the company’s assets are
are funded by equity.
8. A low times-interest-earned ratio might indicate that a company will
9. A return is anything that is gained from a particular investment.
10. The return to shareholders is net income, and the return to creditors
is interest.
11. If the return on common stockholders’ equity is greater than the
12. A decrease in net income would result in lower earnings per share,
13. Investors would pay this type of premium because they believe the
Unit 12-4
1. The Risk Management Association publishes its Annual Studies:
12-6
2. Many companies, such as General Electric, operate in more than
one distinct industry.
3. Comparing a company’s performance to industry data will help you
understand how a company measures up to its competitors.
SOLUTIONS TO EXERCISES
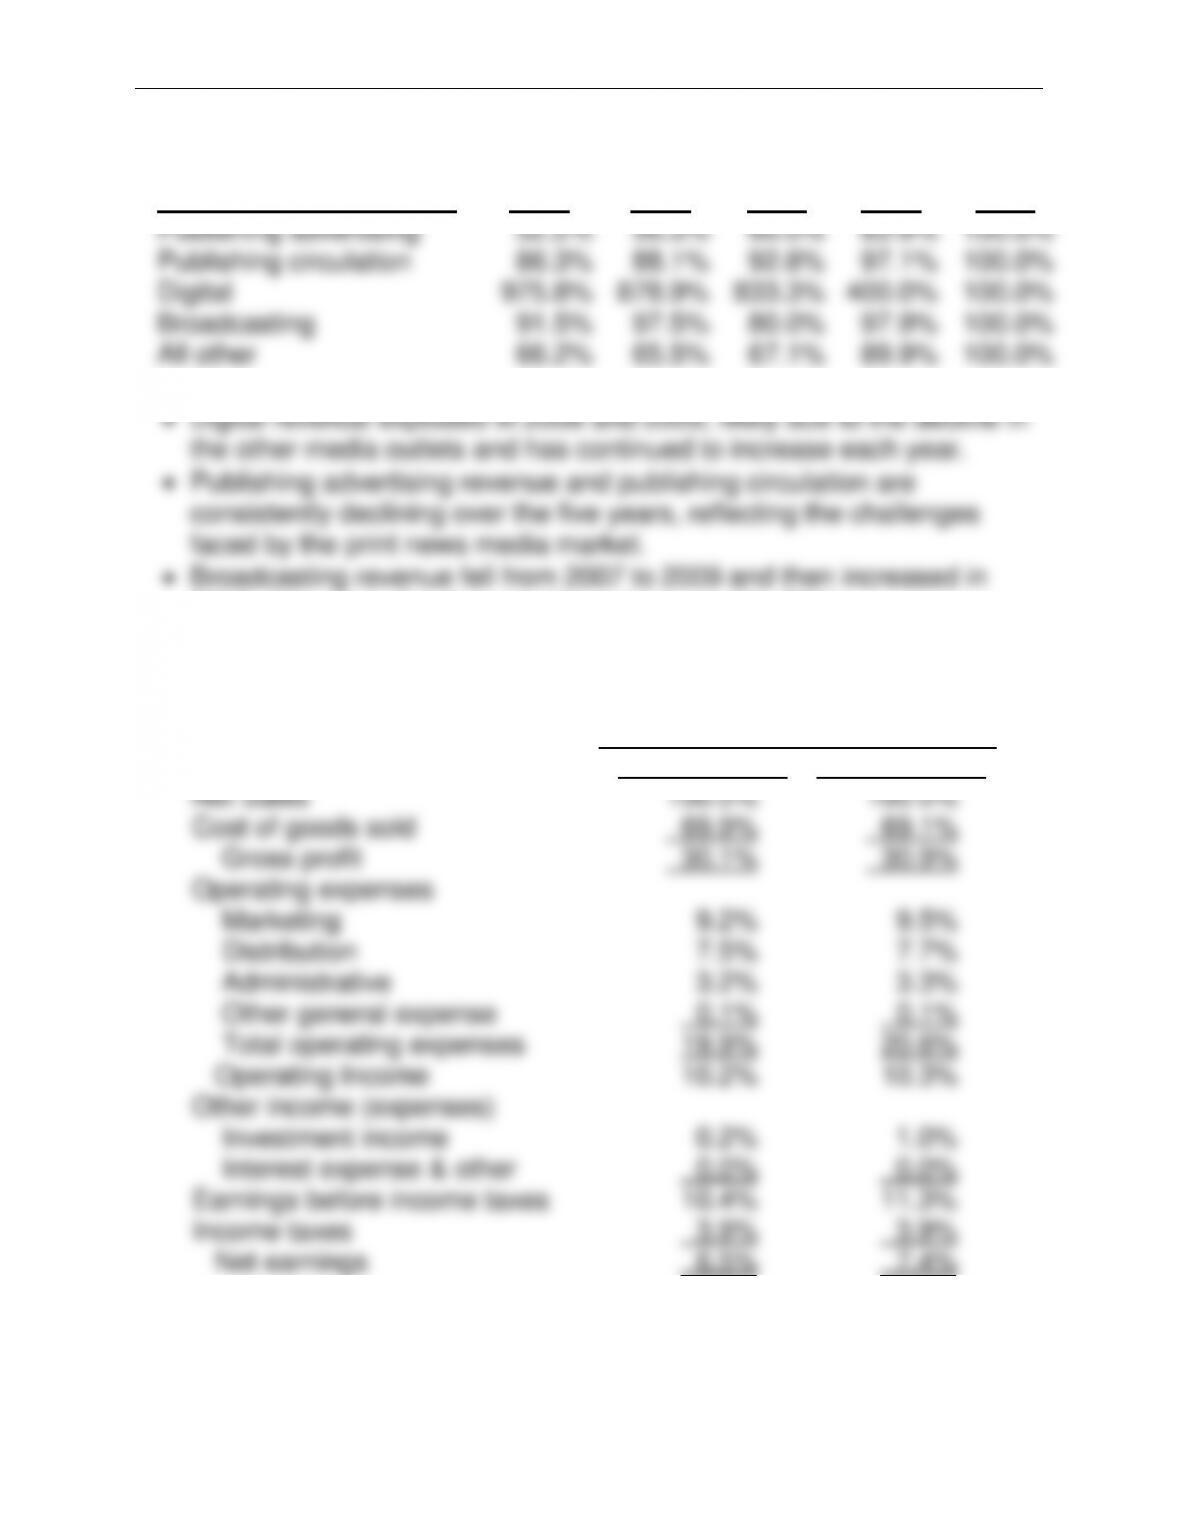
Exercise 12-1
Jan. 28,
2012
Jan. 29,
2011
$
Change
%
Change
Current Assets:
Cash and equivalents
$ 719,545
$ 667,593
$ 51,952
7.8%
Short-term investments
25,499
67,102
(41,603)
(62.0%)
Merchandise inventory
378,426
301,208
77,218
25.6%
Accounts receivable
40,310
36,721
3,589
9.8%
Prepaid expenses/other
74,947
53,727
21,220
39.5%
Deferred income taxes
48,761
48,059
702
1.5%
Total current assets
$1,287,488
$1,174,410
$113,078
9.6%
Exercise 12-2
$1,800,000,000 – x
x
= .21
$1,800,000,000 – x
= .21x
$1,800,000,000
= 1.21x
$1,487,603,306
= x
Chapter 12 – Financial Statement Analysyis
12-7
Exercise 12-3
Net operating revenues
2011
2010
2009
2008
2007
Publishing advertising
52.2%
56.3%
60.0%
83.9%
100.0%
Publishing circulation
86.3%
88.1%
92.8%
97.1%
100.0%
Digital
975.8%
878.9%
833.3%
400.0%
100.0%
Broadcasting
91.5%
97.5%
80.0%
97.9%
100.0%
All other
66.2%
65.5%
67.1%
89.9%
100.0%
2010. However, the downward trend resumed in 2011.
Exercise 12-4
Fiscal year ended
Sep. 29, 2012
Sep. 24, 2011
Net Sales
100.0%
100.0%
Cost of goods sold
69.9%
69.1%
Gross profit
30.1%
30.9%
Operating expenses
Marketing
9.2%
9.5%
Distribution
7.5%
7.7%
Administrative
3.2%
3.3%
Other general expense
0.1%
0.1%
Total operating expenses
19.9%
20.6%
Operating Income
10.2%
10.3%
Other income (expenses)
Investment income
0.2%
1.0%
Interest expense & other
0.0%
0.0%
Earnings before income taxes
10.4%
11.3%
Income taxes
3.9%
3.9%
Net earnings
6.5%
7.4%
12-8
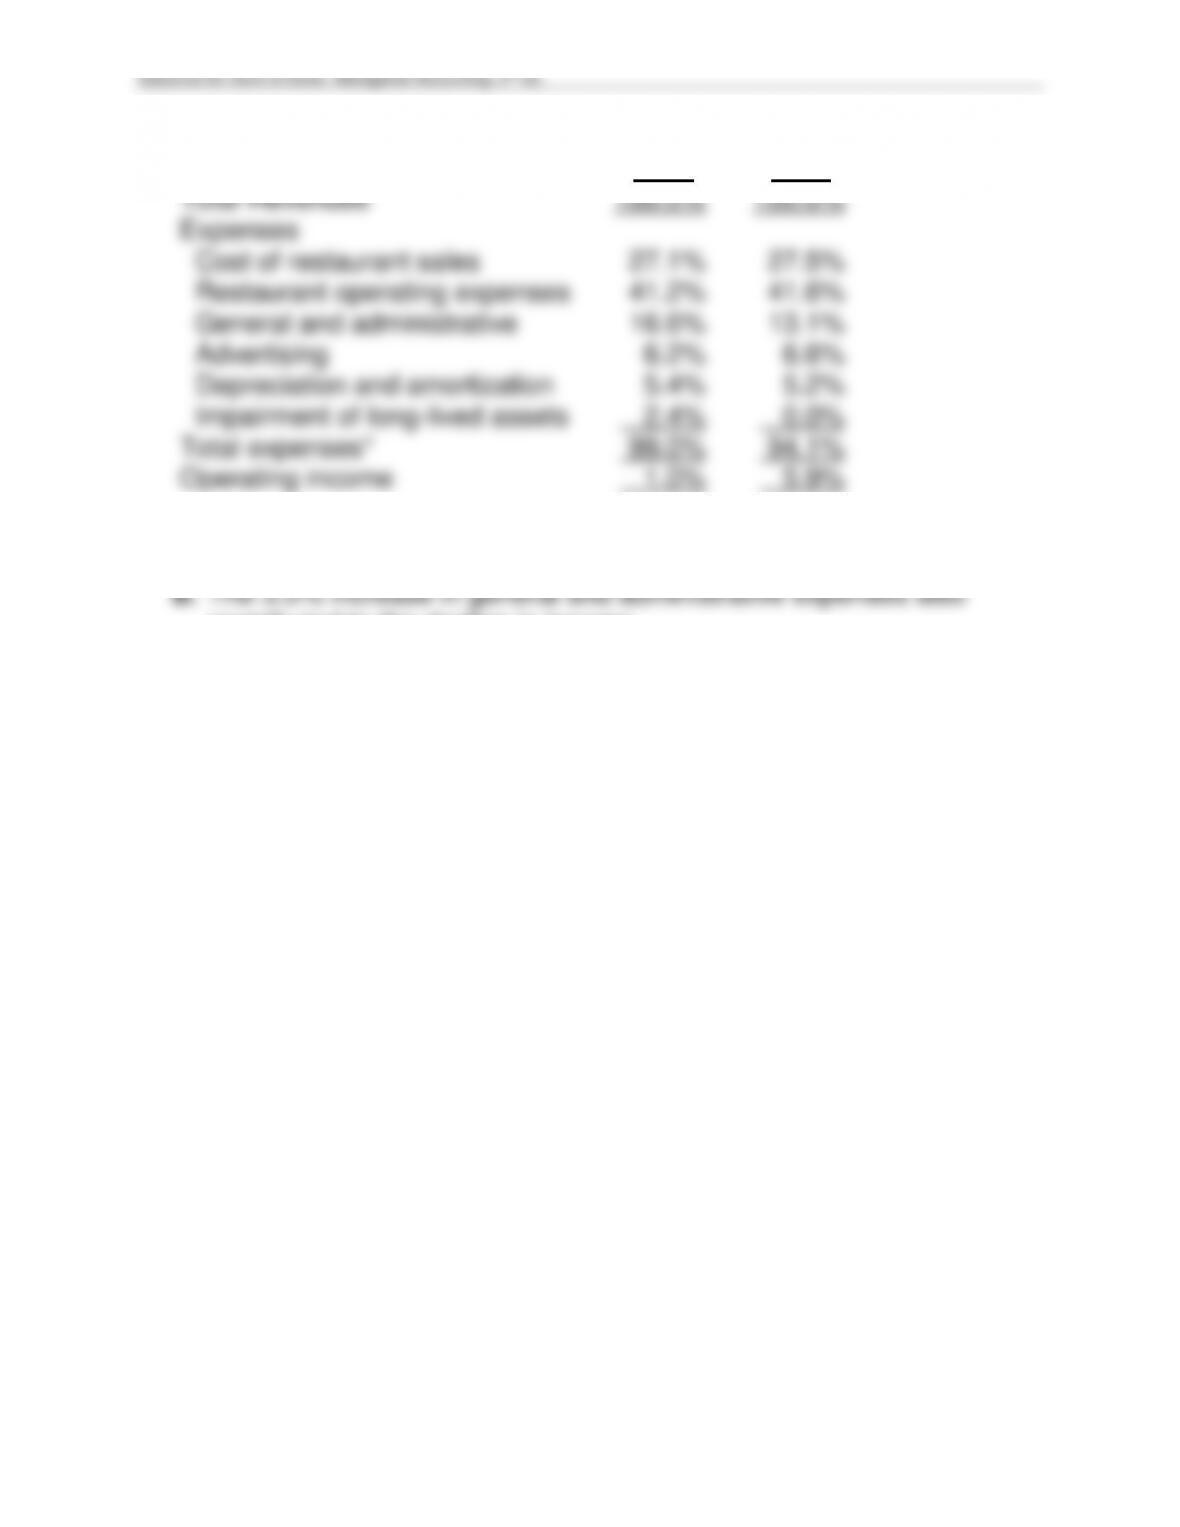
Exercise 12-5
a.
2013
2012
Total Revenues
100.0%
100.0%
Expenses
Cost of restaurant sales
27.1%
27.5%
Restaurant operating expenses
41.2%
41.6%
General and administrative
16.6%
13.1%
Advertising
6.2%
6.6%
Depreciation and amortization
5.4%
5.2%
Impairment of long-lived assets
2.4%
0.0%
Total expenses*
99.0%
94.1%
Operating income
1.0%
5.9%
*Columns off slightly due to rounding
contributed to the decline in income.
Chapter 12 – Financial Statement Analysyis
12-9
Exercise 12-6
8/25/2012
8/27/2011
Assets
Current assets:
Cash and cash equivalents
21.9%
28.9%
Accounts Receivable, net
7.9%
8.3%
Inventories
30.5%
28.8%
Other current assets
5.1%
2.7%
Total current assets
65.4%
68.7%
Property, plant and equipment, net
7.0%
9.4%
Other assets
27.6%
21.9%
Total assets
100.0%
100.0%
Liabilities and Stockholders’ Equity
Current liabilities:
Accounts payable
8.7%
9.0%
Income taxes payable
0.1%
0.0%
Accrued expenses:
12.5%
12.4%
Total current liabilities
21.3%
21.4%
Long-term liabilities
28.1%
33.3%
Total liabilities
49.4%
54.7%
Stockholders’ equity:
Common stock
9.1%
10.8%
Additional paid-in capital
10.0%
12.5%
Retained earnings
165.6%
180.1%
Treasury stock
(134.1%)
(158.1%)
Total stockholders’ equity
50.6%
45.3%
Total liabilities and stockholders’ equity
100.0%
100.0%
Solutions for Davis & Davis, Managerial Accounting, 2nd ed.
Exercise 12-7
Exercise 12-8