Chapter 11 – Performance Evaluations Revisited: A Balanced Approach
11-1
Performance Evaluation Revisited:
A Balanced Approach
Learning Objectives
1. Identify the desirable characteristics of performance measures. (Unit 11.1)
2. Explain how to use a balanced scorecard to improve an organization’s performance. (Unit 11.2)
3. Explain how to use benchmarking to improve an organization’s performance. (Unit 11.3)
4. Calculate delivery cycle time, manufacturing cycle time, and manufacturing cycle efficiency.
(Appendix)
Summary of End of Chapter Material
Difficulty: E = Easy, M = Moderate, D = Difficult
Bloom: K = Knowledge, C = Comprehension, AP = Application, AN = Analysis, S = Synthesis, E = Evaluation
AACSB: A = Analytic, C = Communication, E = Ethics
AICPA FN: DM = Decision modeling, RA = Risk Analysis, M = Measurement, R = Reporting, RS = Research, T = Technology
AICPA PC: C = Communication, I = Interaction, L = Leadership, P = Professional demeanor, PM = Project Management,
PS = Problem Solving and Decision Making, T = Technology
IMA: BA = Business applications, BP = Budget Preparation, CM = Cost Management, DA = Decision Analysis,
PM = Performance Measurement, R = Reporting, SP = Strategic Planning
Item
L. O.
Difficulty
Level
Minutes to
Complete
Bloom’s
Taxonomy
AACSB
AICPA
FN
AICPA
PC
IMA
Ethics
Coverage
GUIDED UNIT PREPARATION
Unit 11.1
1
1
M
10
K, C
A
M
PS
PM
2
1
M
3
C
A
M
PS
PM
3
1
E
6
K, C
A
M
PS
PM
4
1
E
2
K
A
M
PS
PM
5
1
M
4
K
A
M
PS
PM
Unit 11.2
1
2
M
3
C
A
M
PS
PM
2
2
E
2
K
A
M
PS
PM
3
2
D
3
C
A
M
PS
PM
4
2
M
3
C
A
M
PS
PM
5
2
E
2
K
A
M
PS
PM
6
2
D
6
C
A
M
PS
PM
Unit 11.3
1
3
E
3
K
A
M
PS
SP, PM
2
3
M
3
C
A
M
PS
SP, PM
3
3
E
2
K
A
M
PS
SP, PM
4
3
D
6
C
A
M
PS
SP, PM
Appendix
1
4
E
2
K
A
M
PS
PM
2
4
M
3
C
A
M
PS
PM
3
4
E
2
K
A
M
PS
PM
4
4
M
4
C
A
M
PS
PM
5
4
M
2
K
A
M
PS
PM
6
4
M
3
C
A
M
PS
PM
CHAPTER
11
photo: © jsnyderdesign / iStockphoto
Solutions for Davis & Davis, Managerial Accounting, 2nd ed.
11-2
Item
L. O.
Difficulty
Level
Minutes to
Complete
Bloom’s
Taxonomy
AACSB
AICPA
FN
AICPA
PC
IMA
Ethics
Coverage
EXERCISES
11-1
1
M
5-7
AP
A
DM
PS
PM
11-2
1
M
10–12
C
A
DM
PS
PM
11-3
1
M
10
AP, AN
A
DM
PS
PM
11-4
1
D
8-10
AP, AN
A
DM
PS
PM
11-5
2
E
8-10
C
A
DM
PS
PM
11-6
2
M
10–12
C
A
DM
PS
PM
11-7
2
D
10–12
C
A
DM
PS
PM
11-8
2
M
10–12
C
A
DM
PS
PM
11-9
1, 2
E
5
C
A
DM
PS
PM
11–10
3
E
8-10
AP, E
A
DM
PS
PM, SP
11–11
4
M
10
AP
A
DM
PS
PM, SP
11–12
4
M
4
AP
A
DM
PS
PM, SP
11–13
4
D
15
AP
A
DM
PS
PM
PROBLEMS
11–14
1
D
10–15
C, AN
A
DM
PS
PM
11–15
2
D
20–25
AN
A
DM
PS
PM
11–16
1, 2
M
15–20
C
A
DM
PS
PM
11–17
1, 2
D
25–30
AP, AN
A
DM
PS
PM
11–18
4
D
25–30
AP, AN, E
A
DM
PS
PM
C&C CONTINUING CASE
11–19
2
D
10–15
C, AN
A
DM
PS
PM
CASES
11–20
1, 2
D
45–50
AP, AN, E
A
DM
PS
PM
Chapter 11 – Performance Evaluations Revisited: A Balanced Approach
11-3
SOLUTIONS TO QUESTIONS
Unit 11.1
1. Lagging indicators are measures of outcomes that answer the
questions “How did (fill in the blank) do?” and “What did (fill in the
income, EVA, and market share.
Leading indicators are measures of inputs and help to predict a future
Depending on what is being examined, a measure can be both a
leading and lagging indicator. For example, defect rate is a lagging
customer satisfaction.
2. Managers need to use leading indicators to help predict future
success of prior decisions or actions.
3. A financial measure of performance is one denominated in dollars.
defect rates, employee turnover, and customer satisfaction.
4. SMART measures are those that are specific, measurable,
actionable, relevant, and timely.
5. Key performance indicators (KPIs) reflect critical success factors and
measure successful progression toward the organization’s goals.
selecting KPIs.
11-4
Unit 11.2
1. The balanced scorecard integrates measures across four distinct
cause-and-effect relationships between the measures and the
strategy.
2. The four areas of the balanced scorecard are learning and growth,
internal business processes, customer, and financial.
3. Financial data are lagging indicators of performance, and leading
4. An organization’s strategy is at the heart of the balanced scorecard.
5. A strategy map is a pictorial representation of an organization’s
strategy.
6. An organization can spend significant financial resources attempting
to improve customer satisfaction and market share. However, the
increased.
Unit 11.3
1. Benchmarking is the practice of using data from other organizations
led to their outstanding metrics.
Chapter 11 – Performance Evaluations Revisited: A Balanced Approach
11-5
2. Companies have many of the same processes, such as processing
industry still yields helpful benchmarks.
3. Best practices are processes and practices associated with world-
class performance.
4. Companies should follow common-sense practices when
benchmarking. Participants should adhere to the Benchmarking
Code of Conduct, which provides general principles to follow during
the benchmarking process. Benchmarking does not require an
Benchmarking CollaborativeSM
.
Appendix
2. Managers must make a trade-off between the reduced delivery cycle
time and the cost to implement process changes needed to achieve
that reduction.
product to the customer.
4. Value-added activities: conversion of raw materials into finished
products, i.e., the actual making of the product units.
Non-value-added activities: inspection, moving, waiting
5.
Value–added processing time
Manufacturing Cycle Efficiency = Total manufacturing cycle time
11-6
6. Perfect manufacturing efficiency is 1.0. That number is not attainable
since there is no way to remove all non-value-added activities from
the production process.
SOLUTIONS TO EXERCISES
Exercise 11-1
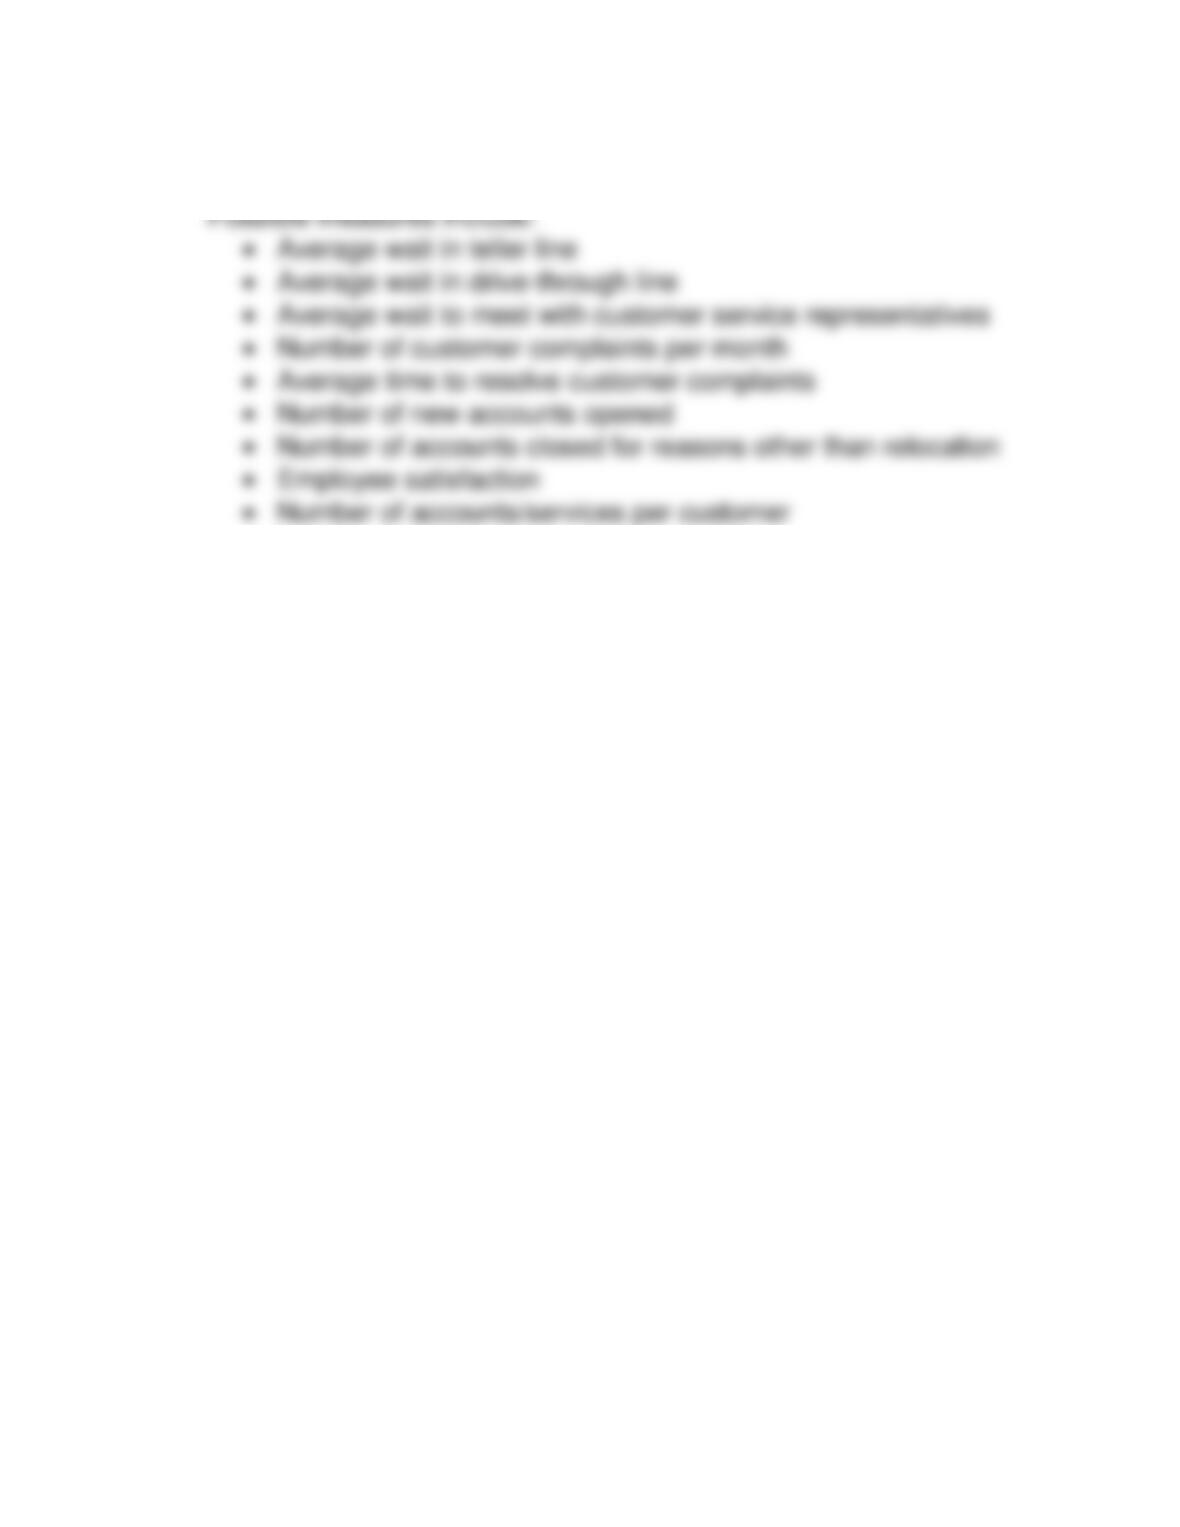
Exercise 11-2
Leading
Lagging
Qualitative
Quantitative
a. Customer satisfaction
score
x
x
b. Guest room cleanliness
score
x
x
c. Annual investment in
linens
x
x
d. Employee retention
x
x
e. Return visits per year
x
x
f. Time to respond to
reservation requests
x
x
g. Percentage of guest
rooms ready at check–in
x
x
h. Employee satisfaction
x
x
i. Customer referrals per
year
x
x
Chapter 11 – Performance Evaluations Revisited: A Balanced Approach
11-7
Exercise 11-3
11-8
Exercise 11-4
a. Inexpensive/low quality packing materials could be used to reduce
satisfaction.
b. Leaving the gate before passengers are secure could affect safety;
downtime in the future.
d. Accounts could be opened for customers who have no legitimate
organization.
Chapter 11 – Performance Evaluations Revisited: A Balanced Approach
11-9
Exercise 11-5
terms of the revenues generated and costs incurred.
Internal business processes: On-time departure % –
Businesspeople who travel just for the day need to arrive at their
destinations for a specific purpose at a specific time. They need
the airline to be reliable on this measure.
limited delays.
11–10
Exercise 11-6
Student answers will vary; however, here are some measures they
may provide.
Average time from product concept to market: New products have to
be designed, tested and brought to market quickly to keep
demand for new technologies.
Number of patents held: New technological innovations are needed
to support product development.
are needed to support product development.