Chapter 5 – Planning and Forecasting
5-39, continued
collection pattern changed
Affected budget components
sales budget, selling and administrative expense budget, cash
receipts budget, cash budget, pro-forma financial statements
Net income impact
Income increases by $2,604 ($78,386 – $75,782) due to increase
in net sales and decrease in interest expense.
Balance sheet impact
Cash increased by almost $40,000 due to decrease in accounts
receivable. By the end of the quarter, no short-term payable is
outstanding.
Recommendation
While this strategy has a good result, Klandon has made no
prediction about the change in unit sales. Customers may not
respond favorably to the change, and if it is easy to switch to
another vendor, Klandon may lose sales. She needs to investigate
what her competitors are doing and have her sales reps visit with
customers before implementing this strategy.
Sales Budget
April
May
June
Quarter
Budgeted units sold
20,000
50,000
30,000
100,000
Budgeted sales price
× $ 10.20
× $ 10.20
× $ 10.20
× $ 10.20
Budgeted sales revenue
$204,000
$510,000
$306,000
$1,020,000
5-72
5-39d, continued
Selling and Administrative Expense Budget
April
May
June
Quarter
Depreciation
$10,000
$10,000
$10,800
$30,800
Sales personnel compensation
35,200
50,500
40,300
126,000
Advertising
1,000
1,000
1,000
3,000
Management salaries
10,000
10,000
10,000
30,000
Miscellaneous
500
500
500
1,500
Bad debts
10,200
25,500
15,300
51,000
Total budgeted expenses
$66,900
$97,500
$77,900
$242,300
Less non-cash expenses
Depreciation
$10,000
$10,000
$10,800
$30,800
Bad debts
10,200
25,500
15,300
51,000
Total cash costs
$46,700
$62,000
$51,800
$160,500
Chapter 5 – Planning and Forecasting
5-73
5-39d, continued
Cash Receipts Budget
April
May
June
Total
Cash Receipts
Bad
Debts
Accounts
Receivable
Sales
Discounts
March A/R
$30,000
$30,000
April sales
Cash
149,940
149,940
$3,060a
Credit
20,400
$20,400
40,800
$10,200
May sales
Cash
374,850
374,850
7,650b
Credit
51,000
$51,000
102,000
25,500
June sales
Cash
224,910
224,910
4,590c
Credit
30,600
30,600
15,300
$30,600
Totals
$200,340
$446,250
$306,510
$953,100
$51,000
$30,600
$15,300
a $204,000 × 0.75 × 0.02
b $510,000 × 0.75 × 0.02
c $306,000 × 0.75 × 0.02
5-74
5-39d, continued
Cash Budget
April
May
June
Quarter
Beginning cash balance
$40,000
$30,640
$64,670
$40,000
Collections from sales
200,340
446,250
306,510
953,100
Total cash available to spend
240,340
476,890
371,180
993,100
Less disbursements
Materials purchases
40,000
72,300
72,700
185,000
Direct labor
65,000
115,000
72,500
252,500
Manufacturing overhead
55,000
65,000
56,500
176,500
Selling & administrative expenses
46,700
62,000
51,800
160,500
Income taxes
50,000
50,000
Equipment purchase
48,000
48,000
Dividends
49,000
49,000
Total cash disbursements
305,700
314,300
301,500
921,500
Cash excess (deficiency)
(65,360)
162,590
69,680
71,600
Minimum cash balance
30,000
30,000
30,000
30,000
Cash excess (needed)
(95,360)
132,590
39,680
41,600
Financing:
Borrowings
96,000
96,000
Repayments
(96,000)
(96,000)
Interest
(1,920)a
(1,920)
Total financing
96,000
(97,920)
(1,920)
Ending cash balance
$30,640
$64,670
$69,680
$69,680
a$96,000 × 12% × 2
12 = $1,920
Chapter 5 – Planning and Forecasting
5-75
5-39d, continued
Income Statement for the quarter ended June 30
Sales
$1,020,000
Sales discounts
15,300
Net sales
1,004,700
Cost of goods sold
648,500
Gross profit
356,200
Selling and administrative expense
242,300
Operating income
113,900
Interest expense
1,920
Income before taxes
111,980
Income tax expense (30%)
33,594
Net income
$78,386
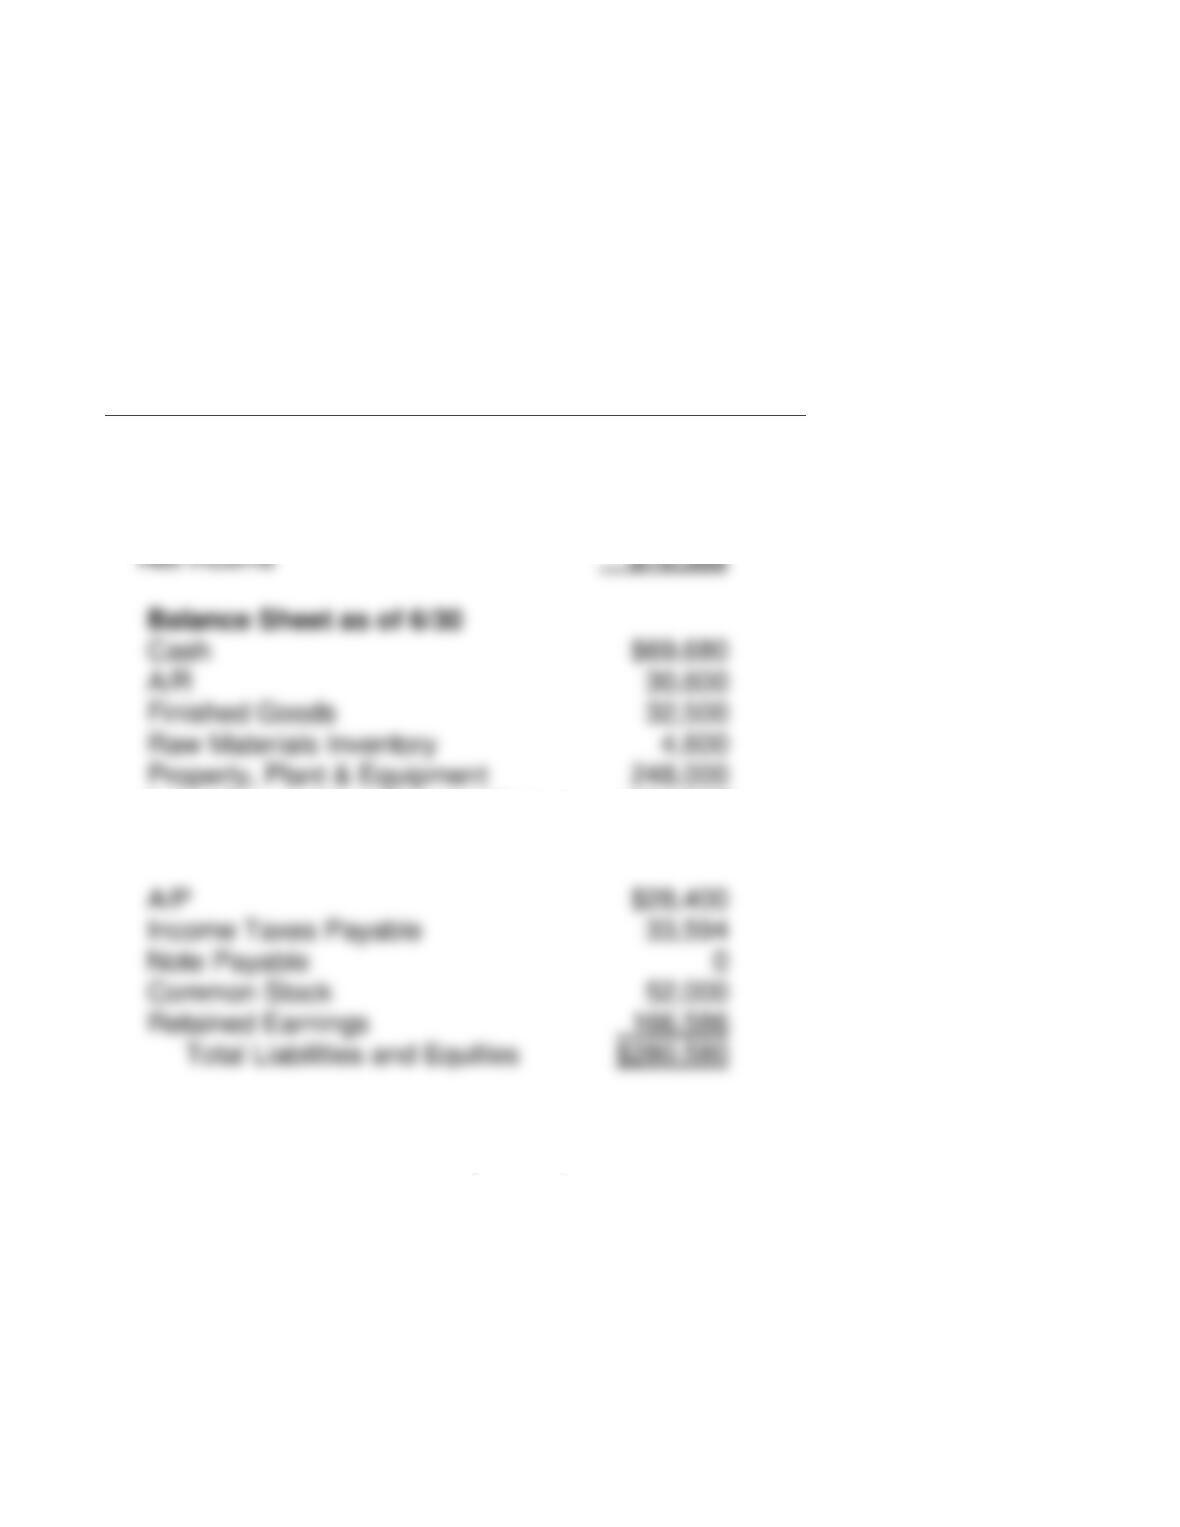
Balance Sheet as of 6/30
Cash
$69,680
A/R
30,600
Finished Goods
32,500
Raw Materials Inventory
4,600
Property, Plant & Equipment
248,000
Less: Accumulated Depreciation
(104,800)
Total Assets
$280,580
A/P
$28,400
Income Taxes Payable
33,594
Note Payable
0
Common Stock
52,000
Retained Earnings
166,586
Total Liabilities and Equities
$280,580
5-76
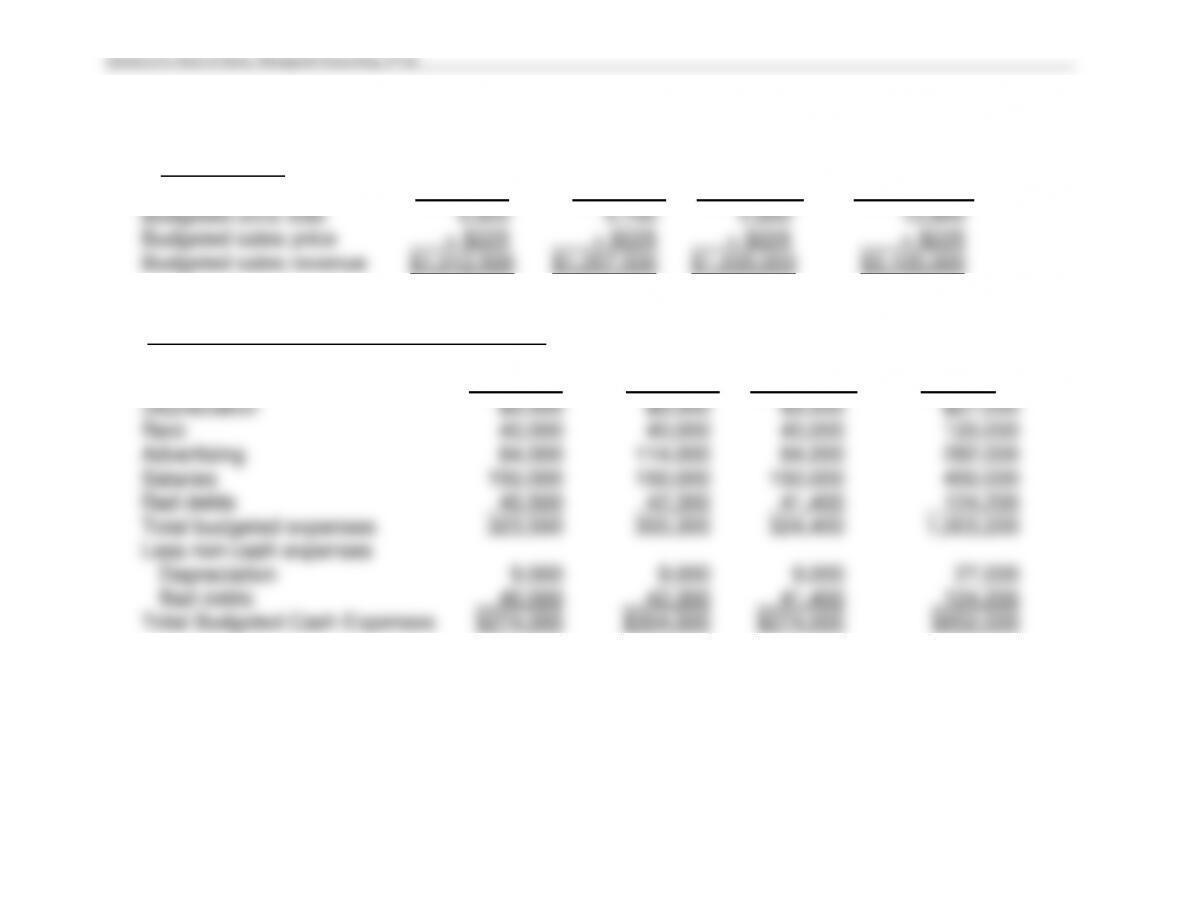
Case 5-40
a. Sales Budget
July
August
September
Quarter
Budgeted units sold
4,500
4,700
4,600
13,800
Budgeted sales price
× $225
× $225
× $225
× $225
Budgeted sales revenue
$1,012,500
$1,057,500
$1,035,000
$3,105,000
Selling and Administrative Expense Budget
July
August
September
Quarter
Depreciation
$9,000
$9,000
$9,000
$27,000
Rent
40,000
40,000
40,000
120,000
Advertising
84,000
114,000
84,000
282,000
Salaries
150,000
150,000
150,000
450,000
Bad debts
40,500
42,300
41,400
124,200
Total budgeted expenses
323,500
355,300
324,400
1,003,200
Less non-cash expenses
Depreciation
9,000
9,000
9,000
27,000
Bad debts
40,500
42,300
41,400
124,200
Total Budgeted Cash Expenses
$274,000
$304,000
$274,000
$852,000