Chapter 3 – Cost-Volume-Profit Analysis and Pricing Decisions
3-1
Cost-Volume–Profit Analysis and
Pricing Decisions
Learning Objectives
1. Calculate the breakeven point in units and sales dollars. (Unit 3.1)
2. Calculate the level of activity required to meet a target income. (Unit 3.2)
3. Determine the effects of changes in sales price, cost, and volume on operating income. (Unit 3.2)
fixed costs. (Unit 3.2)
(Unit 3.3)
6. Define markup and explain cost-plus pricing. (Unit 3.4)
7. Explain target costing and calculate a target cost. (Unit 3.4)
Summary of End of Chapter Material
Difficulty: E = Easy, M = Moderate, D = Difficult
Bloom: K = Knowledge, C = Comprehension, AP = Application, AN = Analysis, S = Synthesis, E = Evaluation
AACSB: A = Analytic, C = Communication, E = Ethics
AICPA FN: DM = Decision modeling, RA = Risk Analysis, M = Measurement, R = Reporting, RS = Research, T = Technology
AICPA PC: C = Communication, I = Interaction, L = Leadership, P = Professional demeanor, PM = Project Management,
PS = Problem Solving and Decision Making, T = Technology
IMA: BA = Business applications, BP = Budget Preparation, CM = Cost Management, DA = Decision Analysis,
PM = Performance Measurement, R = Reporting, SP = Strategic Planning
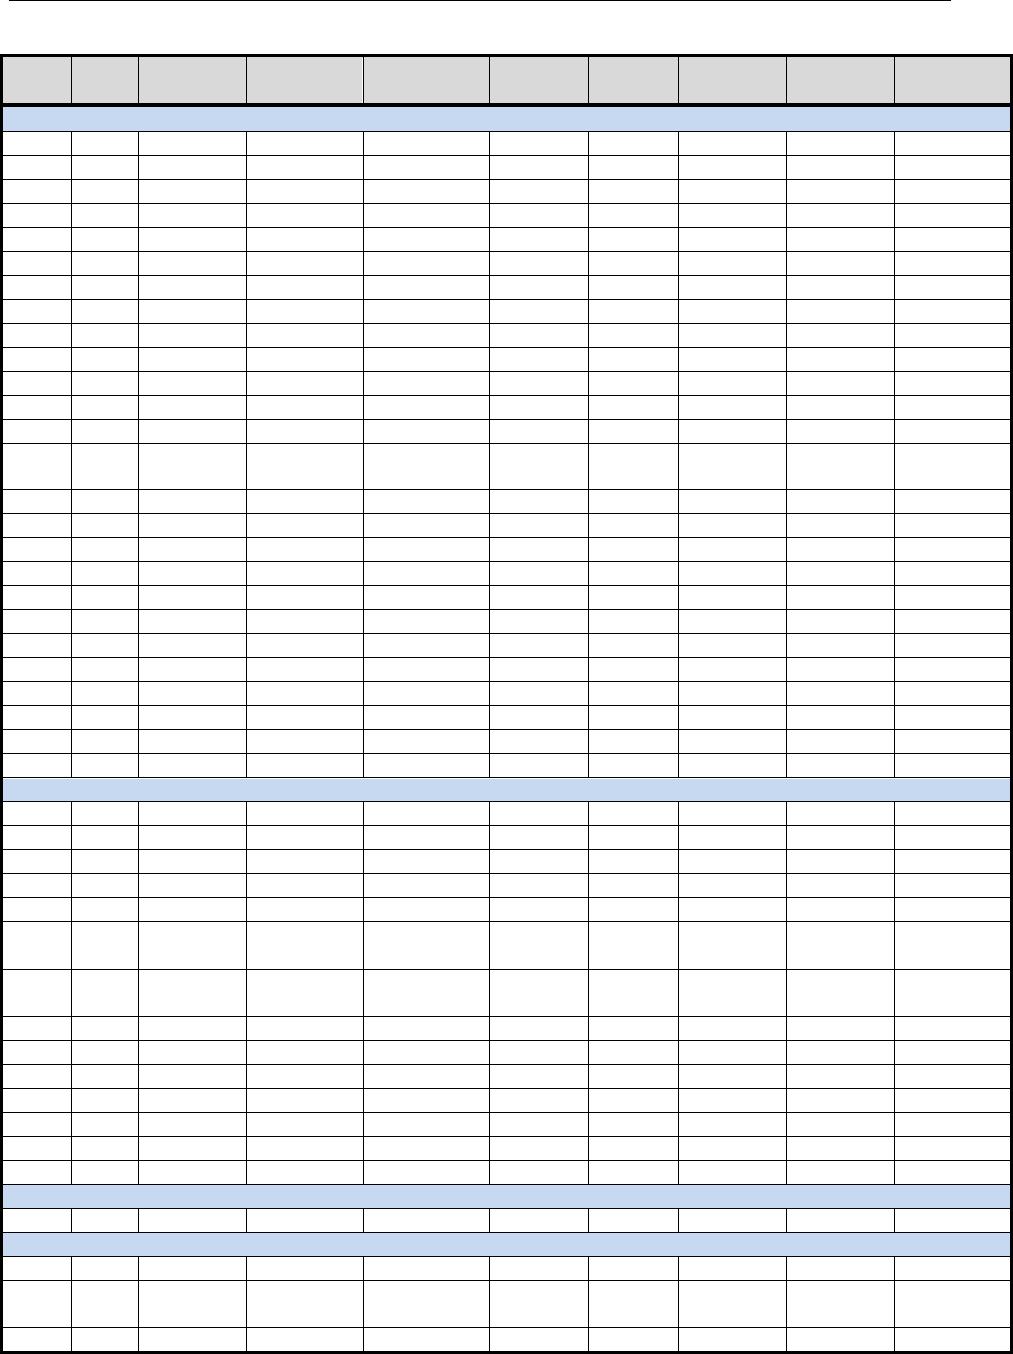
Item
L. O.
Difficulty
Level
Minutes to
Complete
Bloom’s
Taxonomy
AACSB
AICPA
FN
AICPA
PC
IMA
Ethics
Coverage
GUIDED UNIT PREPARATION
Unit 3.1
1
1
E
2
C
A
DM
PS
DA
2
1
D
2
C
A
DM
PS
DA
3
1
M
2
K
A
DM
PS
DA
4
1
M
2
C
A
DM
PS
DA
5
1
E
2
C
A
DM
PS
DA
Unit 3.2
1
2
M
3
K
A
DM
PS
DA
2
3
M
3
K
A
DM
PS
DA
3
3
E
4
K
A
DM
PS
DA
4
4
M
4
C
A
DM
PS
DA
Unit 3.3
1
5
E
2
K
A
DM
PS
DA
2
5
M
3
C
A
DM
PS
DA
3
5
M
2
C
A
DM
PS
DA
Unit 3.4
1
6
M
3
K
A
DM
PS
DA
2
6
M
3
K
A
DM
PS
DA
3
6
M
3
C
A
DM
PS
DA
4
7
E
3
K
A
DM
PS
DA
3
CHAPTER
photo: © Tischenko Irina/Shutterstock
Solutions for Davis & Davis, Managerial Accounting, 2nd ed.
3-2
Item
L. O.
Difficulty
Level
Minutes to
Complete
Bloom’s
Taxonomy
AACSB
AICPA
FN
AICPA
PC
IMA
Ethics
Coverage
EXERCISES
3-1
1
E
8
AN, AP
A
DM
PS
DA
3-2
1
M
10
AP
A
DM
PS
DA
3-3
1
M
10
AP
A
DM
PS
DA
3-4
2
E
5
AN, AP
A
DM
PS
DA
3-5
2
D
15
AP
A
DM
PS
DA
3-6
2
E
5
AP
A
DM
PS
DA
3-7
2
M
8
AP
A
DM
PS
DA
3-8
1, 2
M
10
AP
A
DM
PS
DA
3-9
1, 2
M
12
AP
A
DM
PS
DA
3-10
3
D
15
AP
A
DM
PS
DA
3-11
3
D
15
AN, AP
A
DM
PS
DA
3-12
1, 3
D
20
AP
A
DM
PS
DA
3-13
1, 3
D
20
AN, AP
A
DM
PS
DA
3-14
1, 2,
3
M
15
AN, AP
A
DM
PS
DA
3-15
4
M
15
AN,AP
A
DM
PS
DA
3-16
4
M
15
AP
A
DM
PS
DA
3-17
1, 4
M
10
C
A
DM
PS
DA
3-18
5
D
20
AP
A
DM
PS
DA
3-19
5
D
15
AN,AP
A
DM
PS
DA
3-20
1, 5
D
20
AP, C
A
DM
PS
DA
3-21
1, 5
M
10
AP
A
DM
PS
DA
3-22
6
M
15
AP
A
DM
PS
DA
3-23
6
M
15
AP
A
DM
PS
DA
3-24
6
M
15
AP, C
A
DM
PS
DA
3-25
7
E
8
AP, C
A
DM
PS
DA
3-26
6, 7
M
8
AP, C
A
DM
PS
DA
PROBLEMS
3-27
1
M
15
AP
A
DM
PS
DA
3-28
1, 2
M
20–25
AP
A
DM
PS
DA
3-29
3
D
20–25
AP
A
DM
PS
DA
3-30
3
D
25–30
AP
A
DM
PS
DA
3-31
1, 3
D
20–25
AP
A
DM
PS
DA
3-32
1, 2,
3
M
30–40
AP, C
A
DM
PS
DA
3-33
1, 2,
3
M
25–30
AP, C
A
DM
PS
DA
3-34
2, 3
M
15
AP
A
DM
PS
DA
3-35
4
E
12
AP, AN
A
DM
PS
DA
3-36
5
D
20–25
AP, AN
A
DM
PS
DA
3-37
1, 4
D
20–25
AP, C
A
DM
PS
DA
3-38
1, 5
D
25–30
AP, C
A
DM
PS
DA
3-39
6
M
20–25
AP, E
A
DM
PS
DA
3-40
6, 7
E
15–20
AP, C
A
DM
PS
DA
C&C RUNNING CASE
3-41
3
D
20–25
AP, C
A
DM
PS
DA
CASES
3-42
4
M
20–25
AN
A
DM
PS
DA
3-43
1, 2,
3, 5
D
35–40
AN, AP
A
DM
PS
DA
3-44
3
M
20–25
AN
E
DM
PS
DA
Chapter 3 – Cost-Volume-Profit Analysis and Pricing Decisions
3-3
SOLUTIONS TO GUIDED UNIT PREPARATION
Unit 3.1
1. A company breaks even when total revenues equal total costs. No
income or loss is generated.
2. If variable costs per unit increase, all other things equal, then the
to cover the increase in costs.
3. Let x equal the number of units needed to break even. Solve for x in
units required to breakeven.
4. In order to reduce the breakeven point, a company must reduce
selling price per unit.
5. Margin of safety is the difference between a company’s current level
dollars.
Unit 3.2
1. Let x equal the number of units needed to achieve the target income.
number of units required to achieve the target operating income.
2. CVP analysis allows managers to predict the financial implications of
their decisions. While the expected financial outcome is not the only
3-4
3. The assumptions are:
All costs can be easily and accurately separated into fixed and
variable categories.
across all sales volume levels.
Inventory is sold during the same period it is purchased or
produced.
for decision making.
4. Operating leverage is the change in operating income relative to a
change in sales, and is calculated as contribution margin divided by
relatively high degree of operating leverage and risk for the company.
Unit 3.3
1. The sales mix is the relative sales of all of a company’s products or
services.
2. Holding the sales mix constant for n products, the breakeven point
income
3. The sales mix will remain constant.
Unit 3.4
Chapter 3 – Cost-Volume-Profit Analysis and Pricing Decisions
3-5
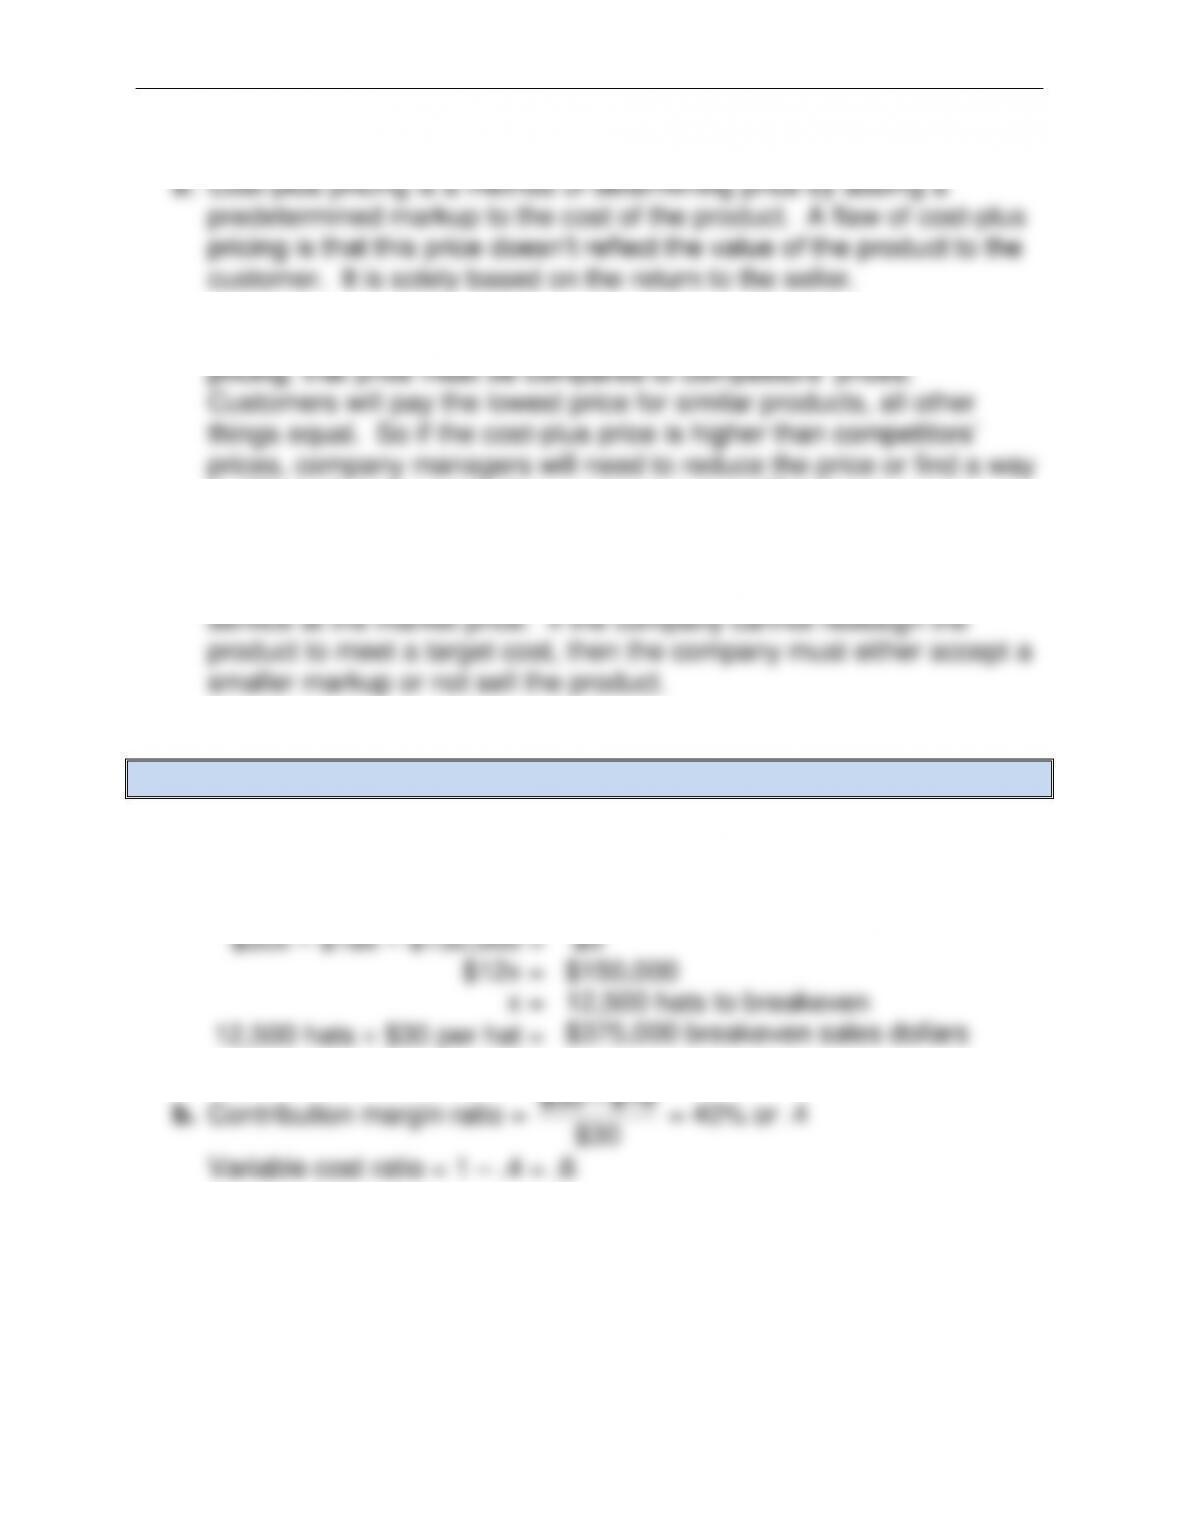
3. Once company managers have calculated a price using cost-plus
to differentiate the product so customers are willing to pay more.
4. Target costing is a pricing strategy that computes the desired markup
and maximum cost that can be incurred to deliver a product or
SOLUTIONS TO EXERCISES
Exercise 3-1
a.
$30x – $18x – $150,000 =
$0
$12x =
$150,000
x =
12,500 hats to breakeven
12,500 hats $30 per hat =
$375,000 breakeven sales dollars
b. Contribution margin ratio =
$30 $18
$30
= 40% or .4
Variable cost ratio = 1 – .4 = .6
c. Managers could decrease fixed costs, increase the selling price, or
purchase the hats from another distributor at a lower cost.
3-6
Exercise 3-2
$0.35
$0.80
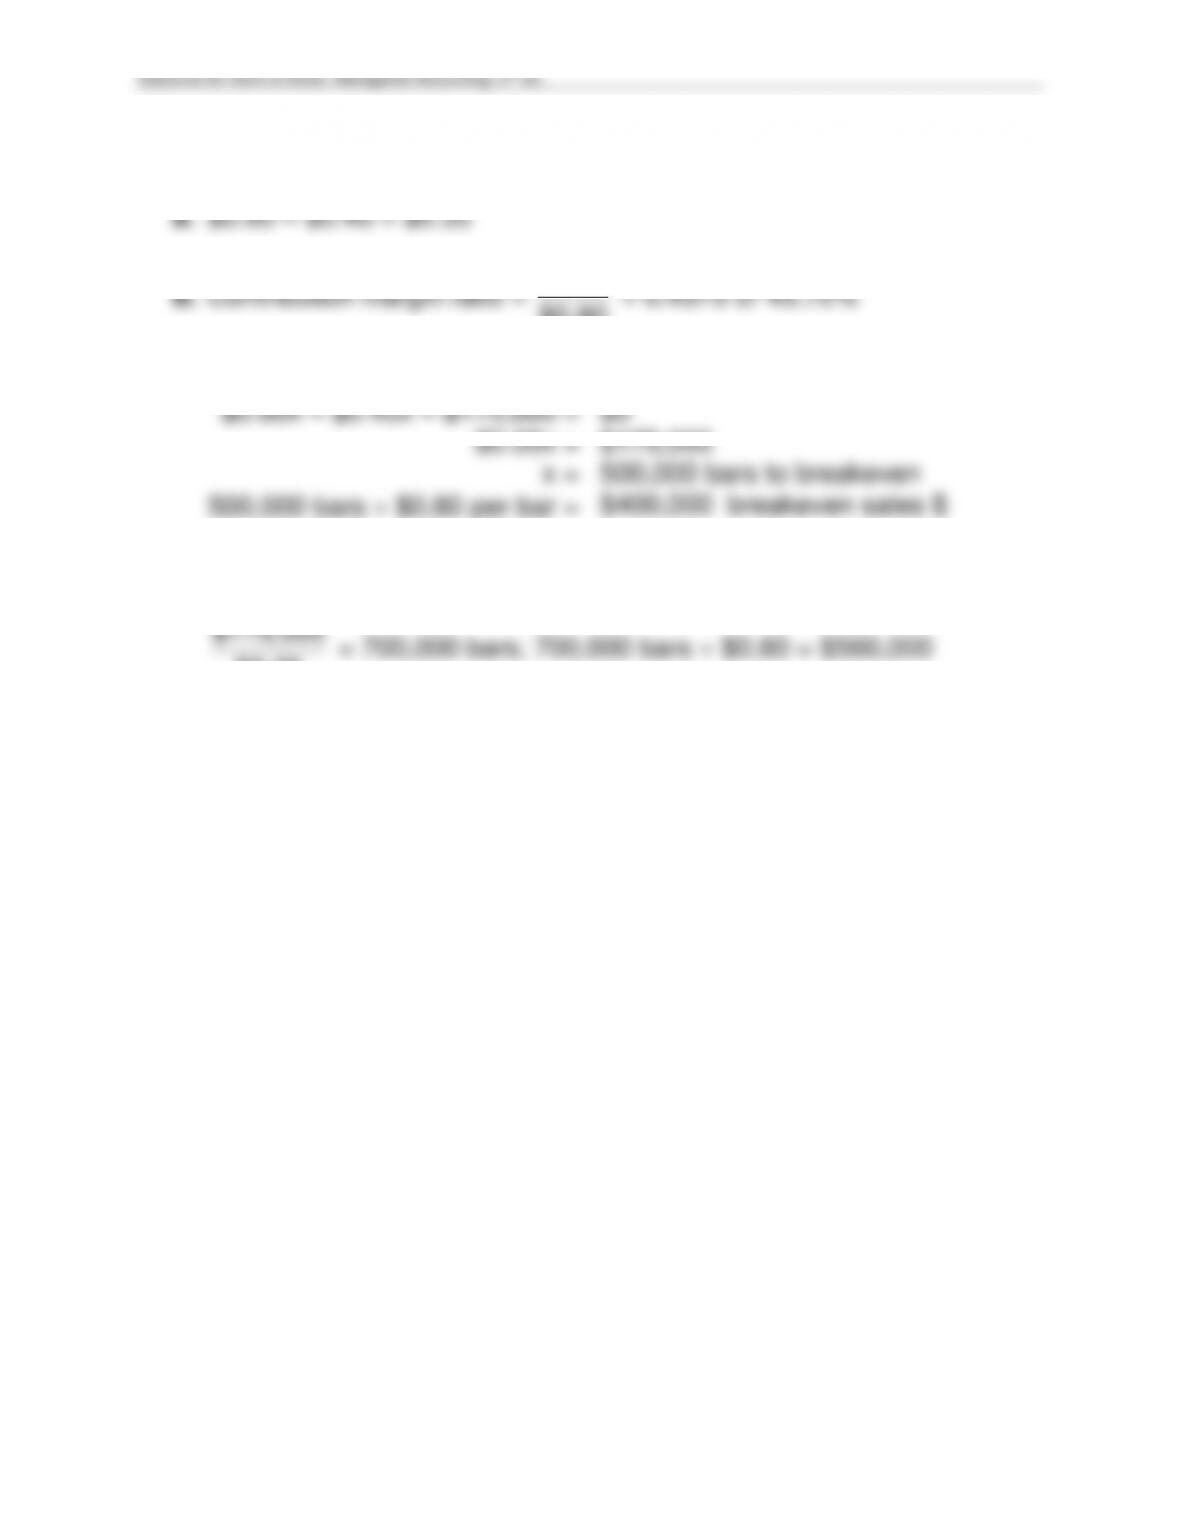
c.
$0.80x – $0.45x – $175,000 =
$0
$0.35x =
$175,000
x =
500,000 bars to breakeven
500,000 bars $0.80 per bar =
$400,000 breakeven sales $
d. The breakeven point will increase to
$175,000
$0.25
= 700,000 bars; 700,000 bars $0.80 = $560,000
3-7
Exercise 3-3
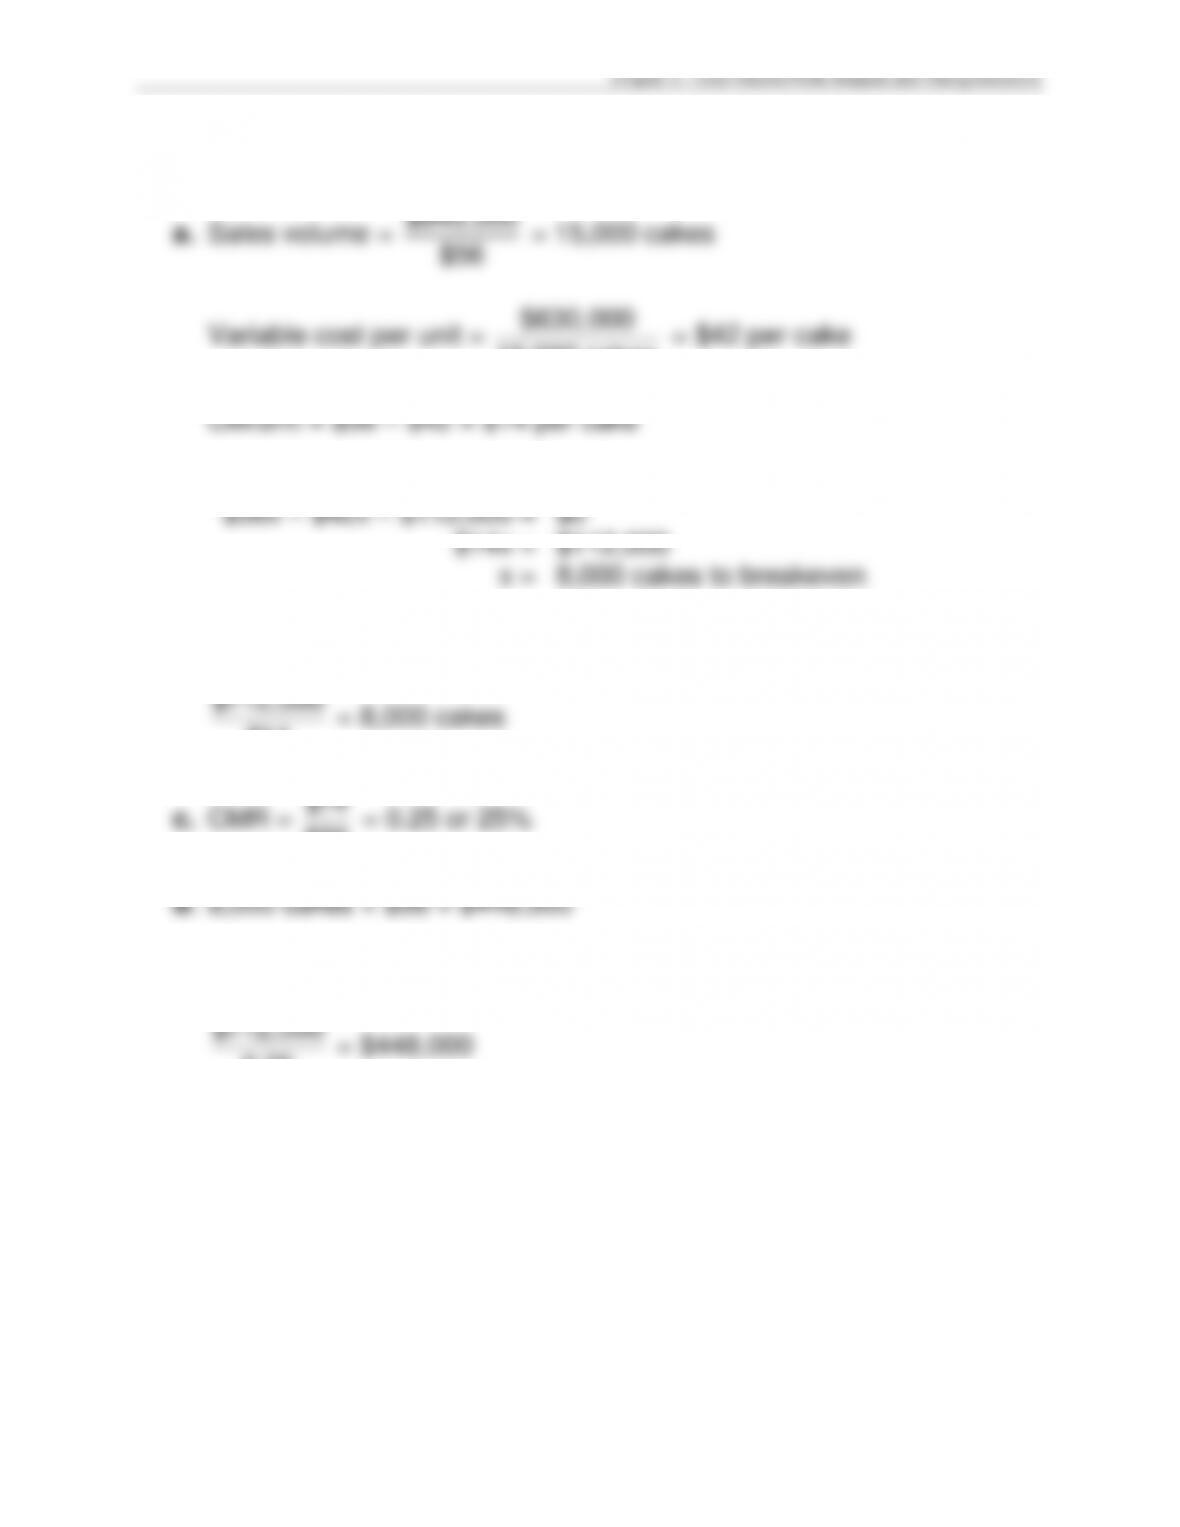
a. Sales volume =
,$840 000
$56
= 15,000 cakes
Variable cost per unit =
,$630 000
15,000 cakes
= $42 per cake
b.
$56x – $42x – $112,000 =
$0
$14x =
$112,000
x =
8,000 cakes to breakeven
or
,$112 000
$14
= 8,000 cakes
c. CMR =
$14
$56
= 0.25 or 25%
or
,
.
$112 000
0 25
= $448,000
3-8
Exercise 3-4
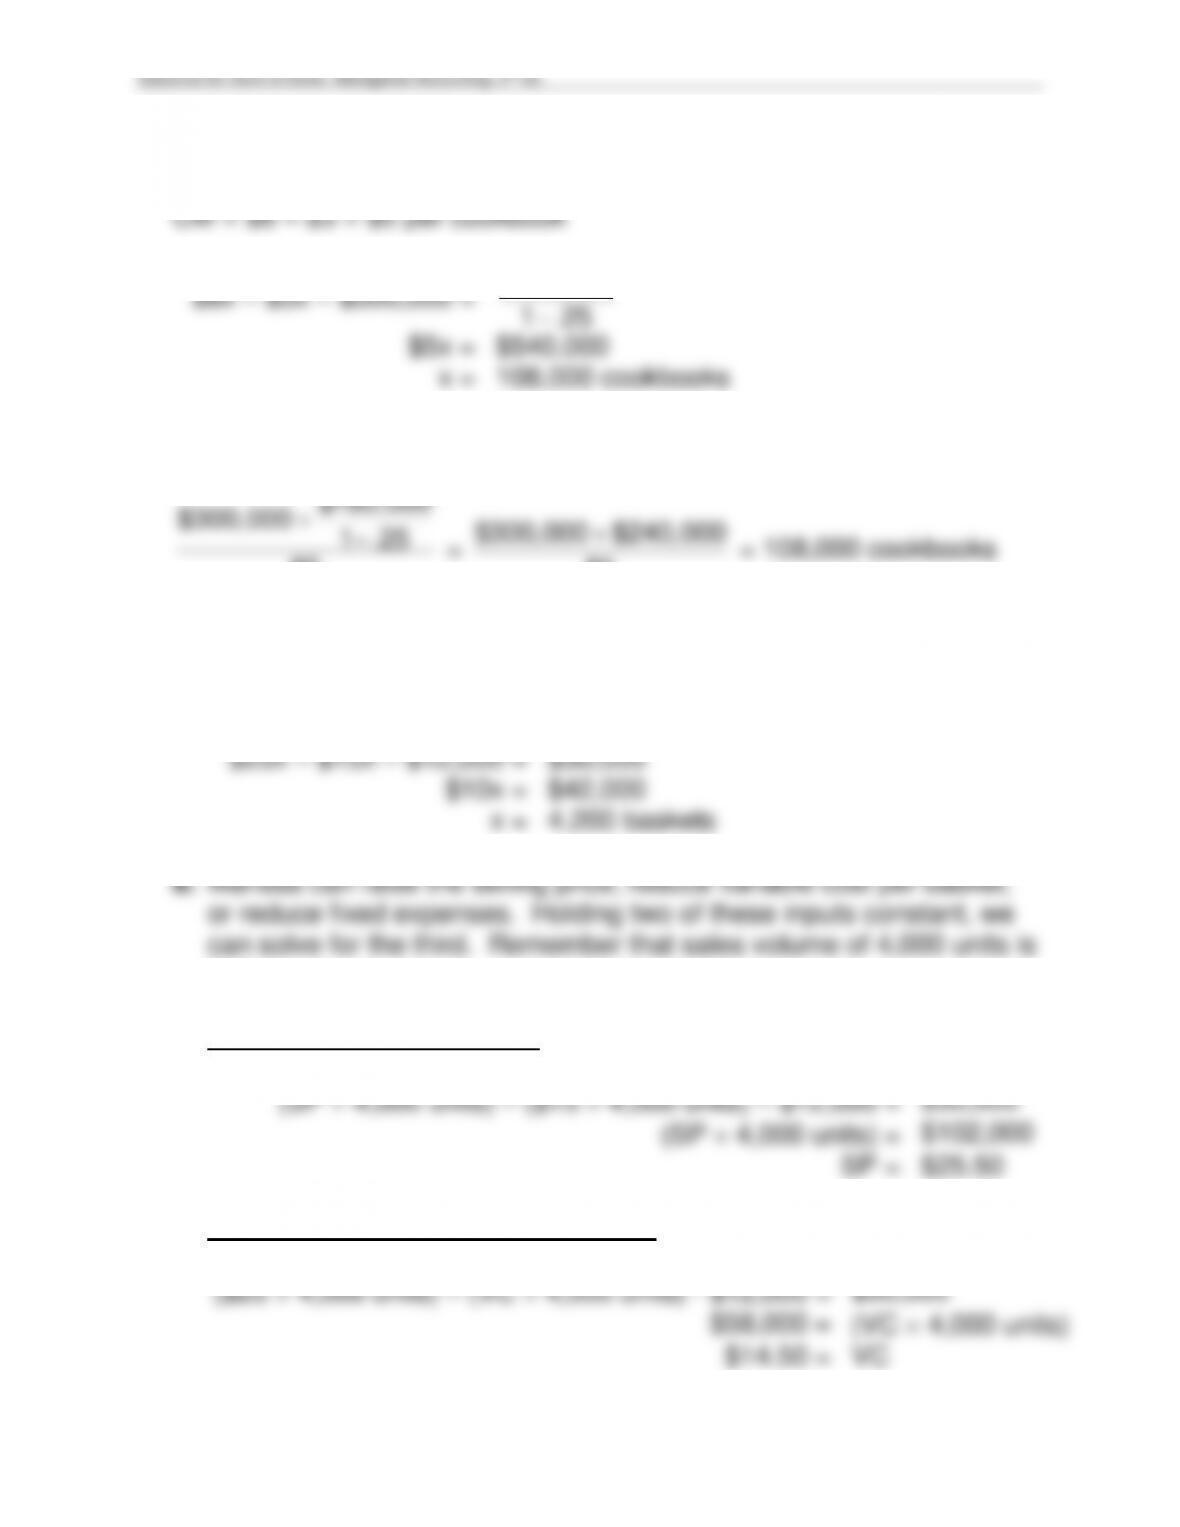
$8x – $3x – $300,000 =
$180,000
1 .25
$5x =
$540,000
x =
108,000 cookbooks
or
,
,
.
$180 000
$300 000 1 25
$5
=
,,$300 000 $240 000
$5
= 108,000 cookbooks
Exercise 3-5
a.
$25x – $15x – $12,000 =
$30,000
$10x =
$42,000
x =
4,200 baskets
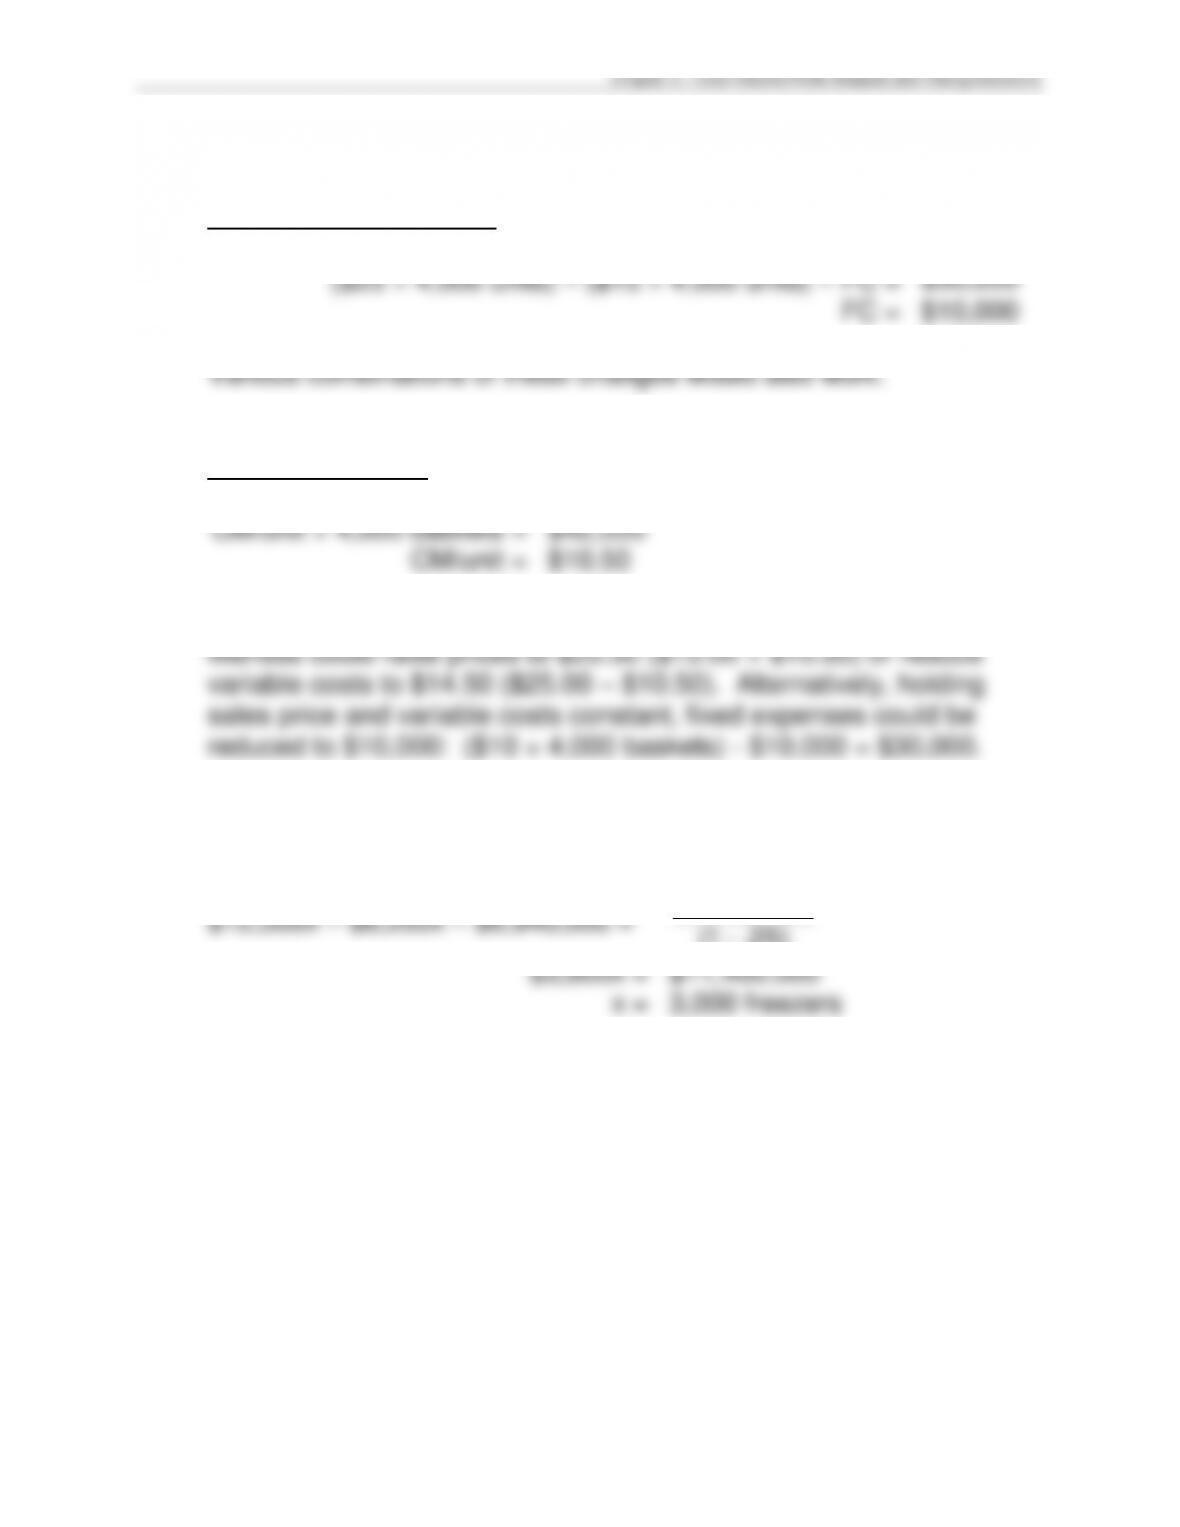
known.
Raise the selling price (SP):
(SP 4,000 units) – ($15 4,000 units) – $12,000 =
$30,000
(SP 4,000 units) =
$102,000
SP =
$25.50
Reduce variable cost per basket (VC)
($25 4,000 units) – (VC 4,000 units) – $12,000 =
$30,000
$58,000 =
(VC 4,000 units)
$14.50 =
VC
3-9
Exercise 3-5, continued
Reduce fixed costs (FC)
($25 4,000 units) – ($15 4,000 units) – FC =
$30,000
FC =
$10,000
Alternate Solution:
CM/unit × 4,000 baskets =
$42,000
CM/unit =
$10.50
The contribution margin on each basket needs to be $10.50, so
Exercise 3-6
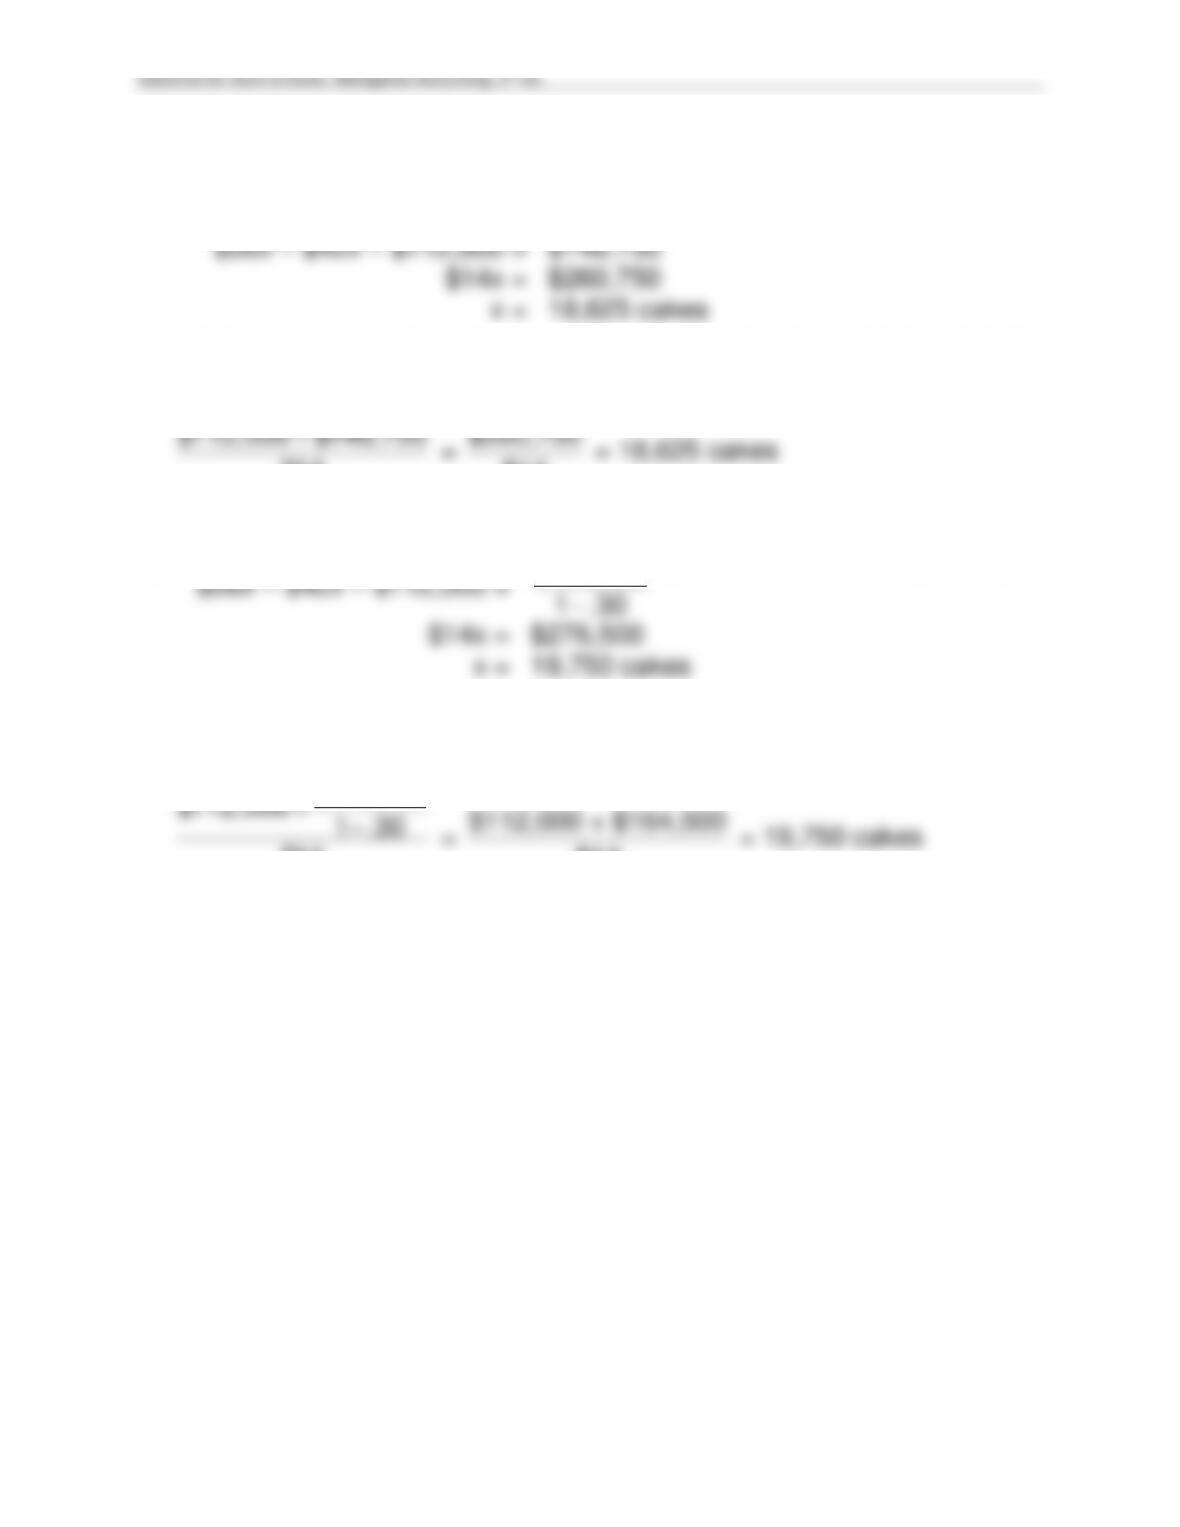
$12,000x – $8,200x – $6,840,000 =
$3,420,000
(1 .25)
$3,800x =
$11,400,000
x =
3,000 freezers
3-10
Exercise 3-7
a.
$56x – $42x – $112,000 =
$148,750
$14x =
$260,750
x =
18,625 cakes
or
,,$112 000 $148 750
$14
=
$260,750
$14
= 18,625 cakes
b.
$56x – $42x – $112,000 =
$115,150
1 .30
$14x =
$276,500
x =
19,750 cakes
or
,
,
.
$115 150
$112 000 1 30
$14
=
$112,000 + $164,500
$14
= 19,750 cakes