Unlock document.
This document is partially blurred.
Unlock all pages and 1 million more documents.
Get Access
COMPREHENSIVE PROBLEM (Continued)
(b) HASSELLHOUF COMPANY
Trial Balance
December 31, 2015
Debits
Credits
Cash ....................................................................
Accounts Receivable .........................................
Notes Receivable ...............................................
Interest Receivable ............................................
Inventory .............................................................
Prepaid Insurance ..............................................
Land ....................................................................
Buildings ............................................................
Equipment ..........................................................
$ 8,700
45,800
10,000
600
29,900
1,200
20,000
150,000
77,800
COMPREHENSIVE PROBLEM (Continued)
(c) HASSELLHOUF COMPANY
Income Statement
For the Year Ended December 31, 2015
Sales Revenue ...................................................
Cost of Goods Sold ...........................................
Gross Profit .......................................................
Operating Expenses
Salaries and Wages Expense ......................
Other Operating Expenses ..........................
Depreciation Expense ..................................
Bad Debt Expense ........................................
Insurance Expense .......................................
Amortization Expense ..................................
Total Operating Expenses ................................
Income From Operations ..................................
Other Revenues and Gains
Rent Revenue ...............................................
Gain on Disposal of Plant Assets ...............
Interest Revenue ..........................................
Other Expenses and Losses
Interest Expense ...........................................
Net Income .........................................................
$115,200
61,800
17,150
3,500
2,400
900
2,000
750
600
3,350
3,690
$914,000
636,300
277,700
200,950
76,750
(340)
$ 76,410
HASSELLHOUF COMPANY
Retained Earnings Statement
For the Year Ended December 31, 2015
COMPREHENSIVE PROBLEM (Continued)
(d) HASSELLHOUF COMPANY
Balance Sheet
December 31, 2015
Assets
Current Assets
Cash ..........................................................
Accounts Receivable ...............................
Allowance for Doubtful Accounts ...........
Notes Receivable .....................................
Interest Receivable ..................................
Inventory ...................................................
Prepaid Insurance ....................................
Total Current Assets .........................
Property, Plant, and Equipment
Land ..........................................................
Buildings ...................................................
Less Accum. Depr.—Buildings ...............
Equipment ................................................
Less Accum. Depr.—Equipment .............
Total Plant Assets ..............................
Intangible Assets
Patents ......................................................
Total Assets ...................................................
$ 45,800
4,000
150,000
54,000
77,800
34,900
$ 8,700
41,800
10,000
600
29,900
1,200
20,000
96,000
42,900
$92,200
158,900
8,100
$259,200
Liabilities and Stockholders’ Equity
BYP 9-1 FINANCIAL REPORTING PROBLEM
(a) Property, plant, and equipment is reported net, book value, on the
(b) Depreciation and amortization expense was:
2011: $1,814,000,000.
(c) Apple’s capital spending was:
(d) Apple reports (in Note 4) amortizable intangible assets, net of
BYP 9-2 COMPARATIVE ANALYSIS PROBLEM
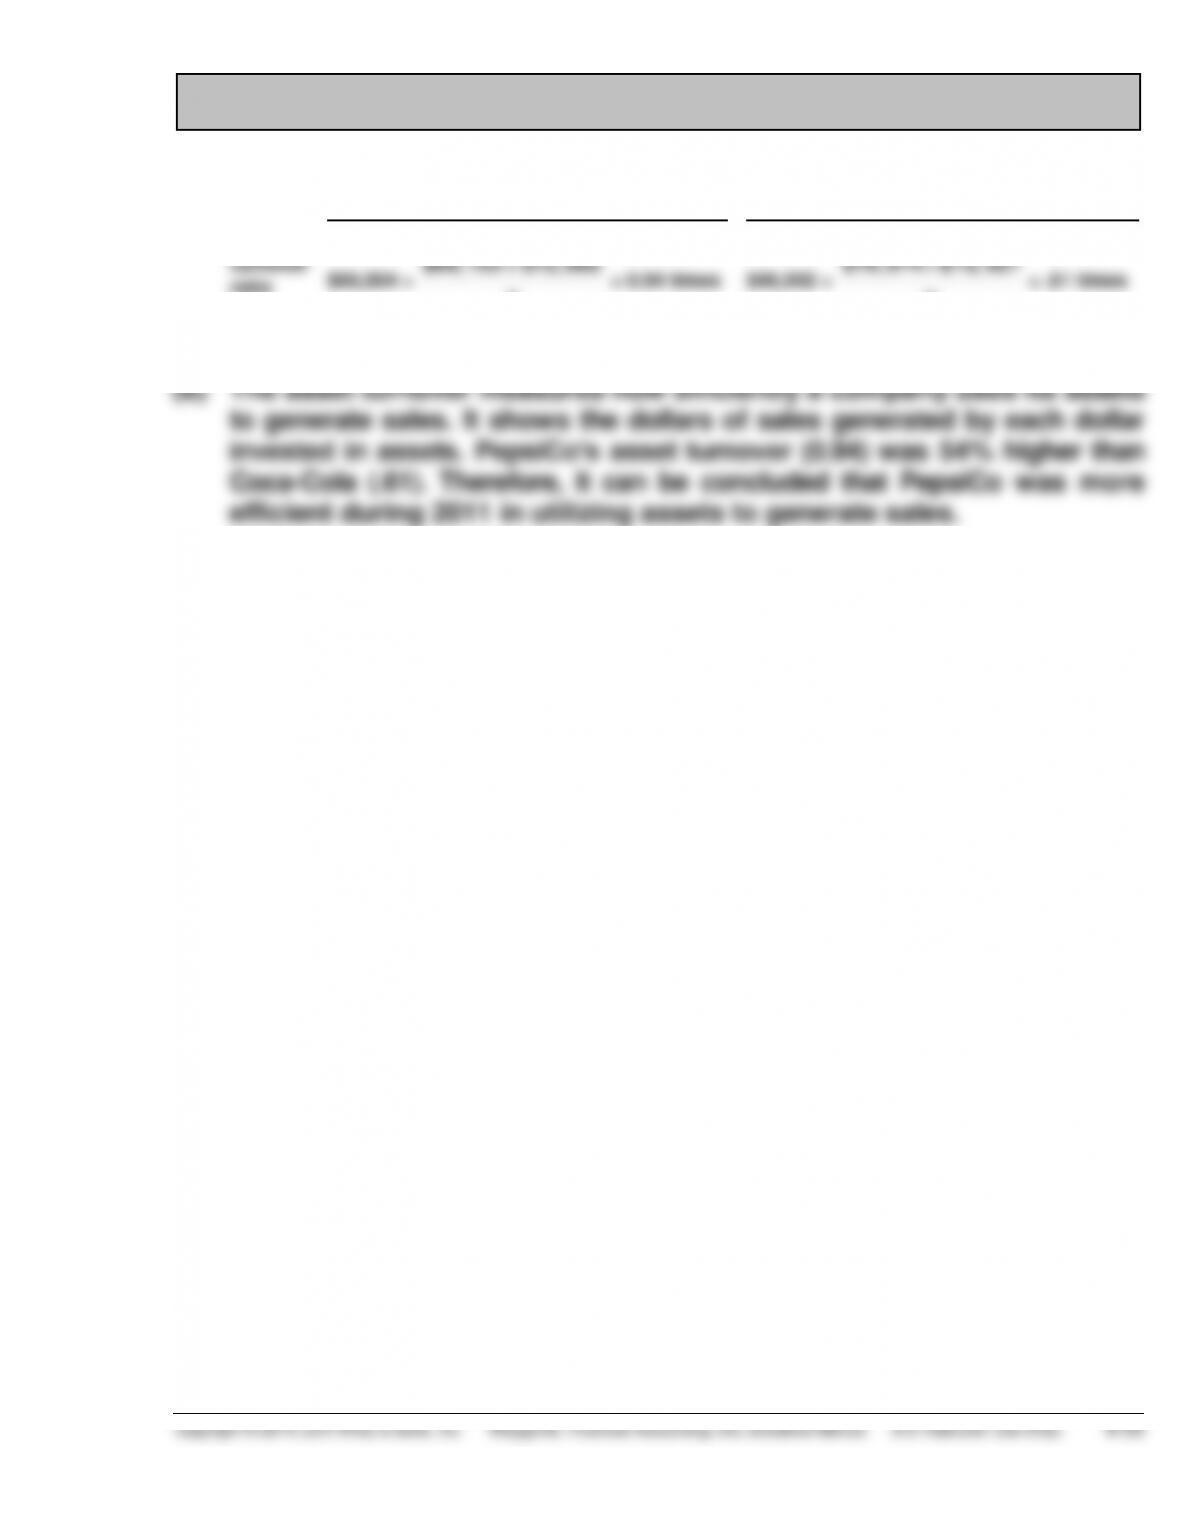
(a)
PepsiCo
Coca-Cola
Asset
turnover
ratio
$66,504 ÷
$68,153 + $72,882
2
= 0.94 times
$46,542 ÷
$79,974+ $72, 921
2
= .61 times
BYP 9-3 COMPARATIVE ANALYSIS PROBLEM
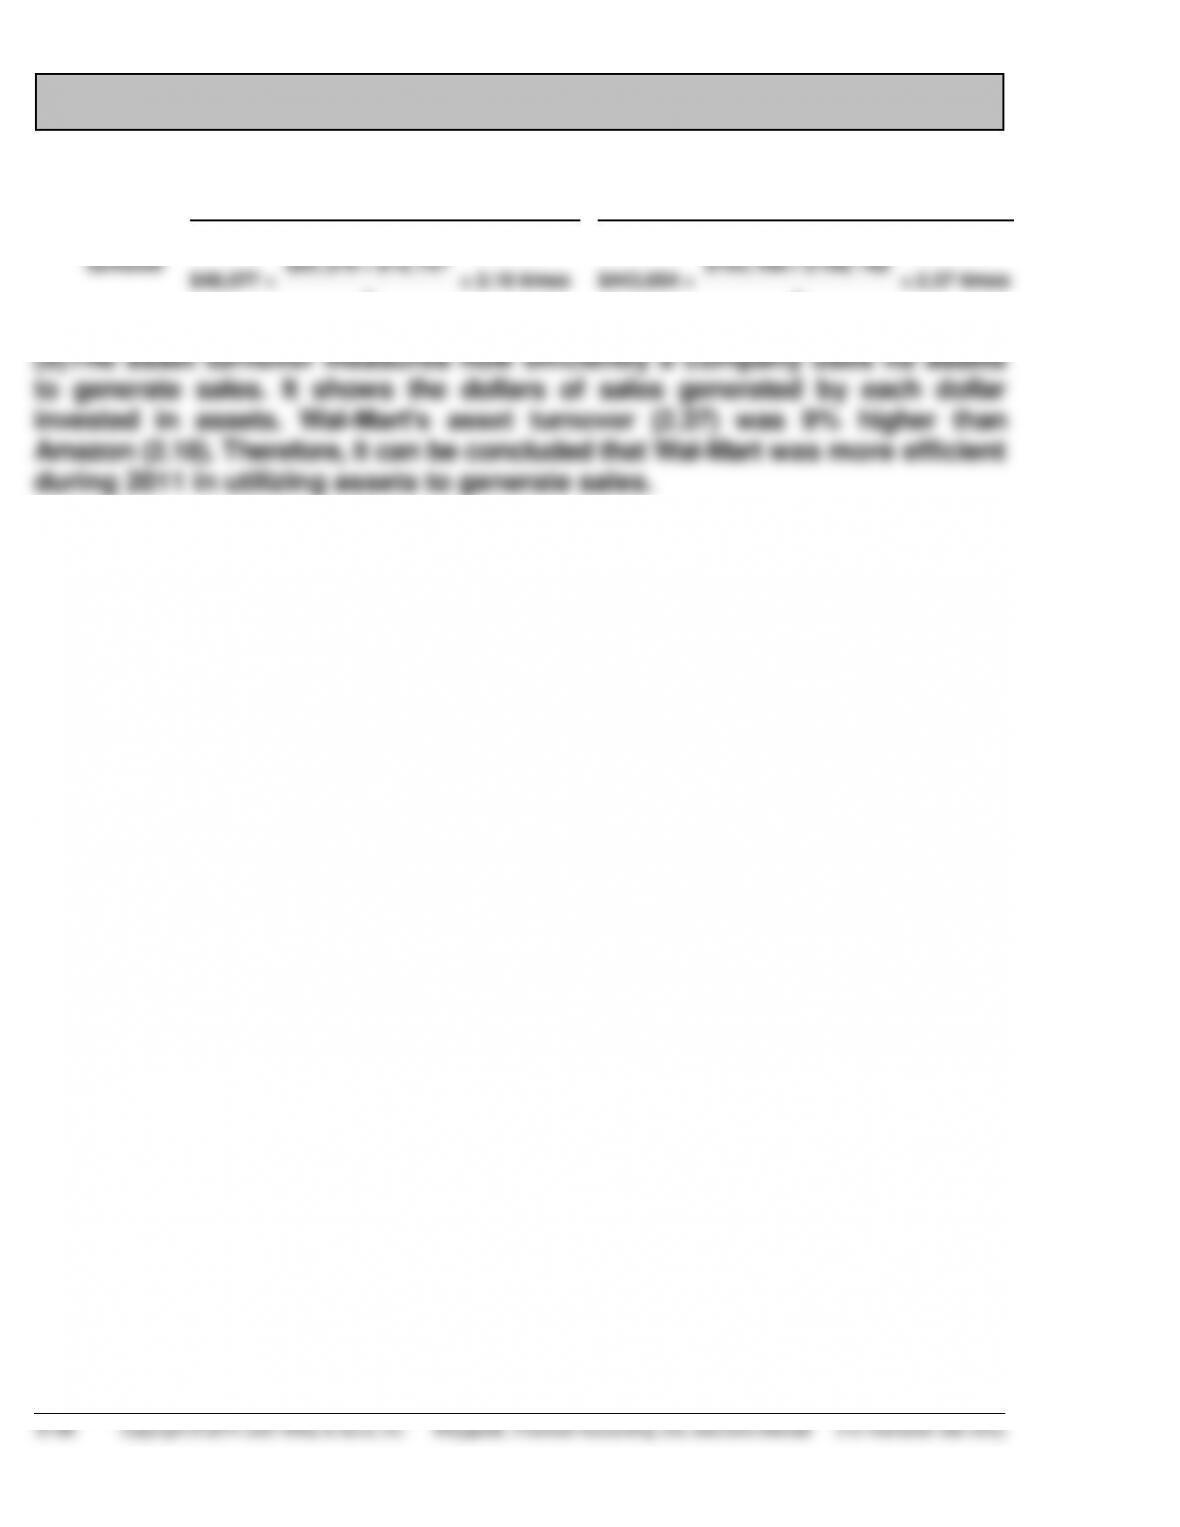
(a)
Amazon
Wal-Mart
Asset
turnover
$48,077 ÷
$25, 278 + $18, 797
2
= 2.18 times
$443,854 ÷
$193, 406 + $ 180, 782
2
= 2.37 times

BYP 9-4 REAL-WORLD FOCUS
BYP 9-5 DECISION MAKING ACROSS THE ORGANIZATION
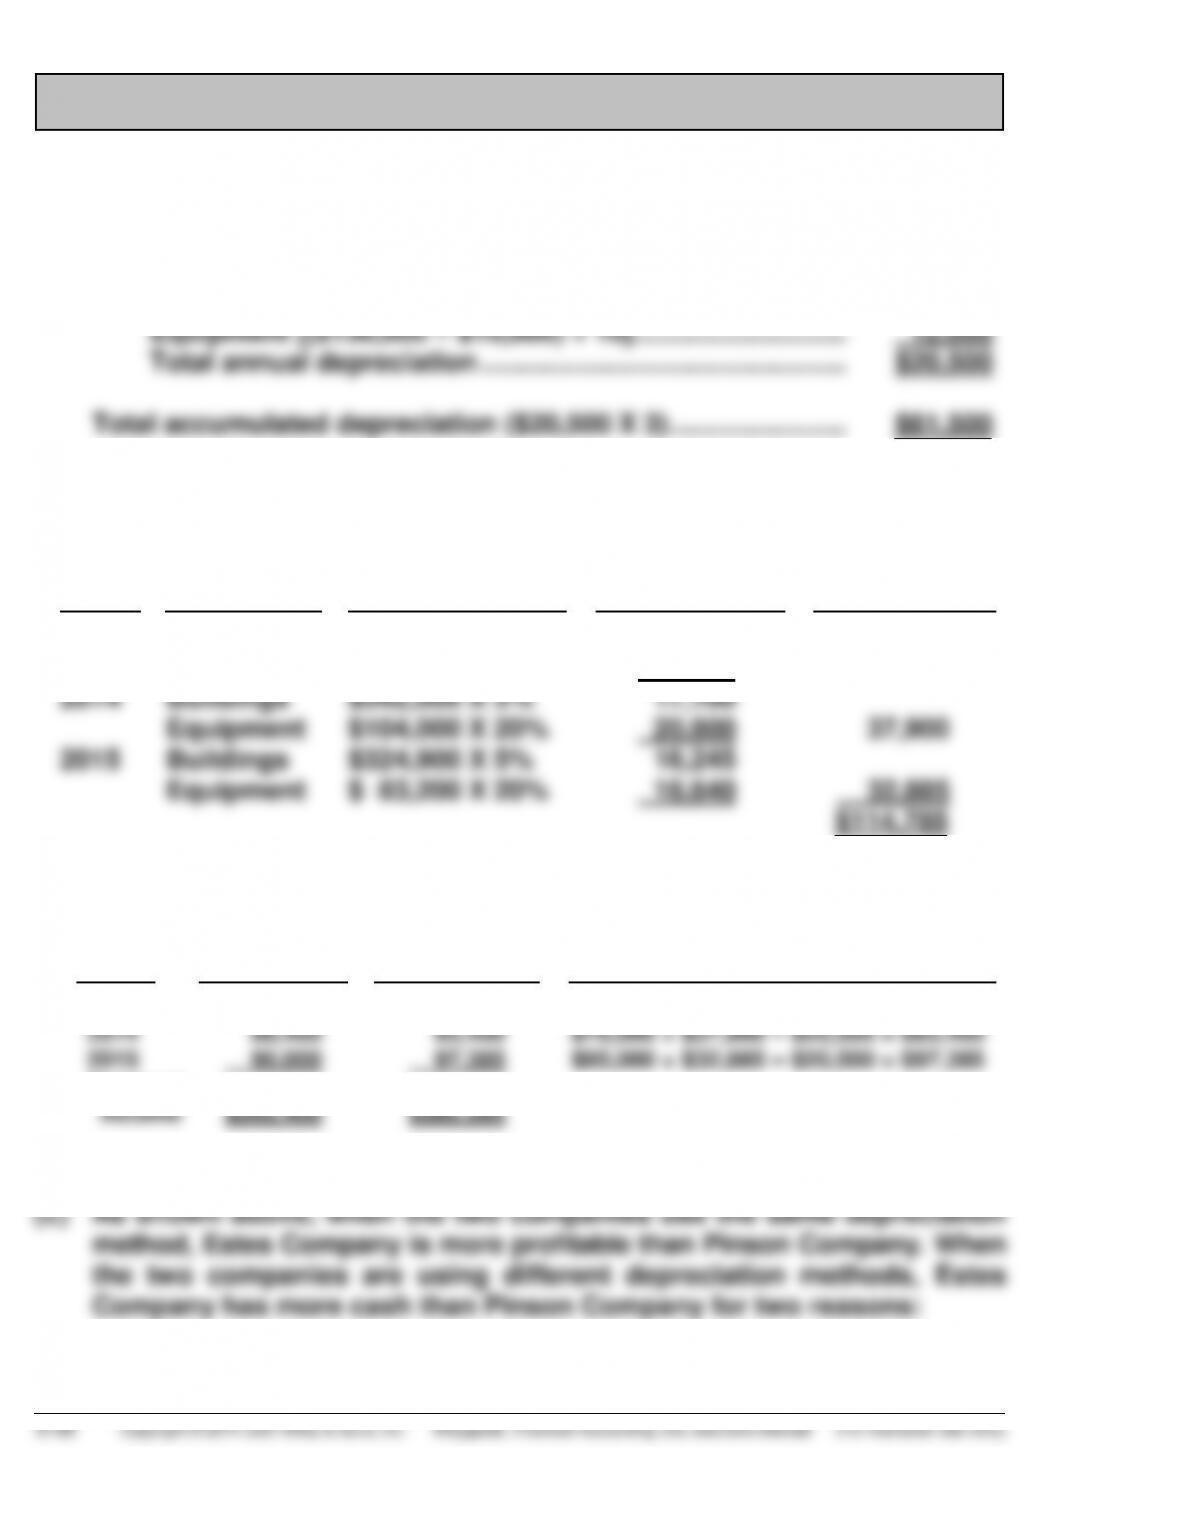
(a) Pinson Company—Straight-line method
Annual Depreciation
Buildings [($360,000 – $20,000) ÷ 40] .............................. $ 8,500
Estes Company—Double-declining-balance method
Year
Asset
Computation
Annual
Depreciation
Accumulated
Depreciation
2013
2014
2015
Buildings
Equipment
Buildings
Equipment
Buildings
Equipment
$360,000 X 5%
$130,000 X 20%
$342,000 X 5%
$104,000 X 20%
$324,900 X 5%
$ 83,200 X 20%
$18,000
26,000
17,100
20,800
16,245
16,640
$44,000
37,900
32,885
$114,785
(b)
Year
Pinson
Company
Net Income
Estes
Company
Net Income
As Adjusted
Computations for Estes Company
2013
2014
2015
$ 84,000
88,400
90,000
$ 91,500
93,400
97,385
$68,000 + $44,000 – $20,500 = $91,500
$76,000 + $37,900 – $20,500 = $93,400
$85,000 + $32,885 – $20,500 = $97,385
Total net
income
$262,400
$282,285


