COMPREHENSIVE PROBLEM SOLUTION (Continued)
WINTER COMPANY
Retained Earnings Statement
For the Month Ending January 31, 2015
Retained Earnings, January 1 …………………………………….
$12,730
Add: Net income ……………………………………………………….
3,093
Retained Earnings, January 31 …………………………………..
$15,823
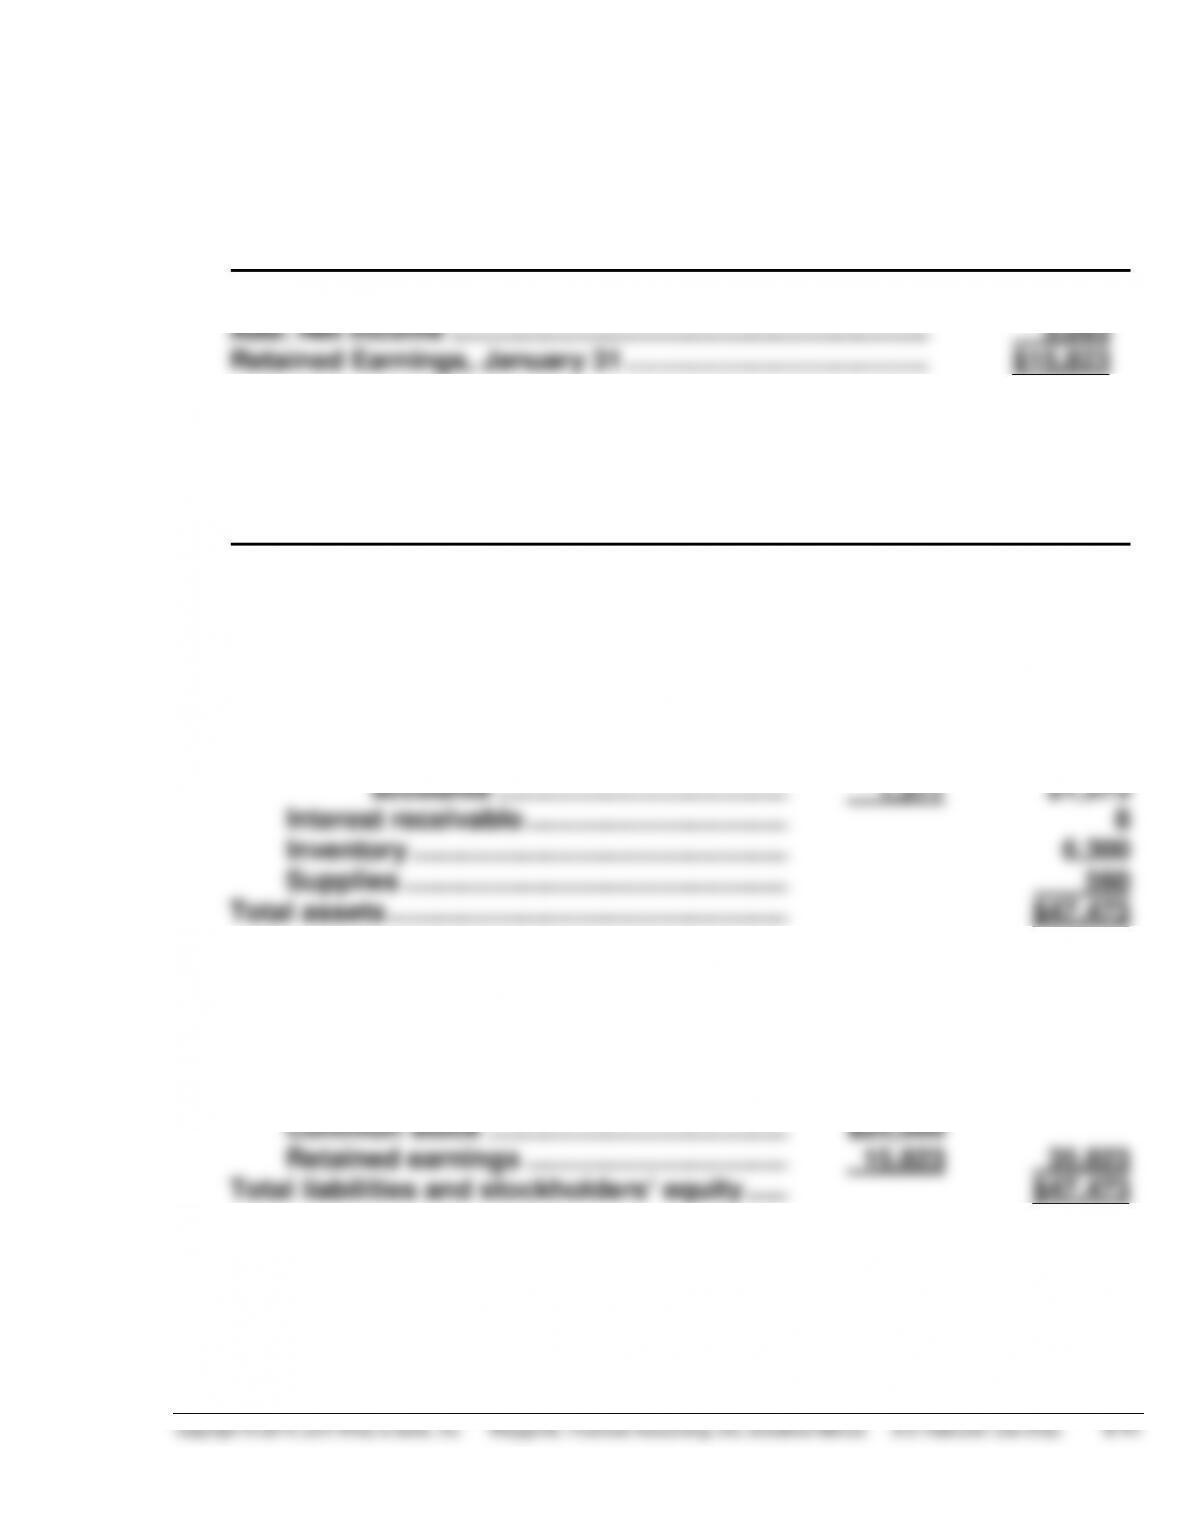
WINTER COMPANY
Balance Sheet
January 31, 2015
Assets
Current assets
Cash …………………………………………………..
$17,832
Notes receivable ………………………………....
1,200
Accounts receivable …………………………..
$22,950
Less: Allowance for doubtful
accounts …………………………………..
1,377
21,573
Interest receivable …………………………..…..
8
Inventory …………………………………………....
6,300
Supplies ……………………………………………..
560
Total assets ……………………………………………....
$47,473
Liabilities and Stockholders’ Equity
Current liabilities
Accounts payable ………………………………..
$11,650
Stockholders’ equity
Common stock …………………………………...
$20,000
Retained earnings ……………………………....
15,823
35,823
Total liabilities and stockholders’ equity ……..
$47,473
BYP 8-1 FINANCIAL REPORTING PROBLEM
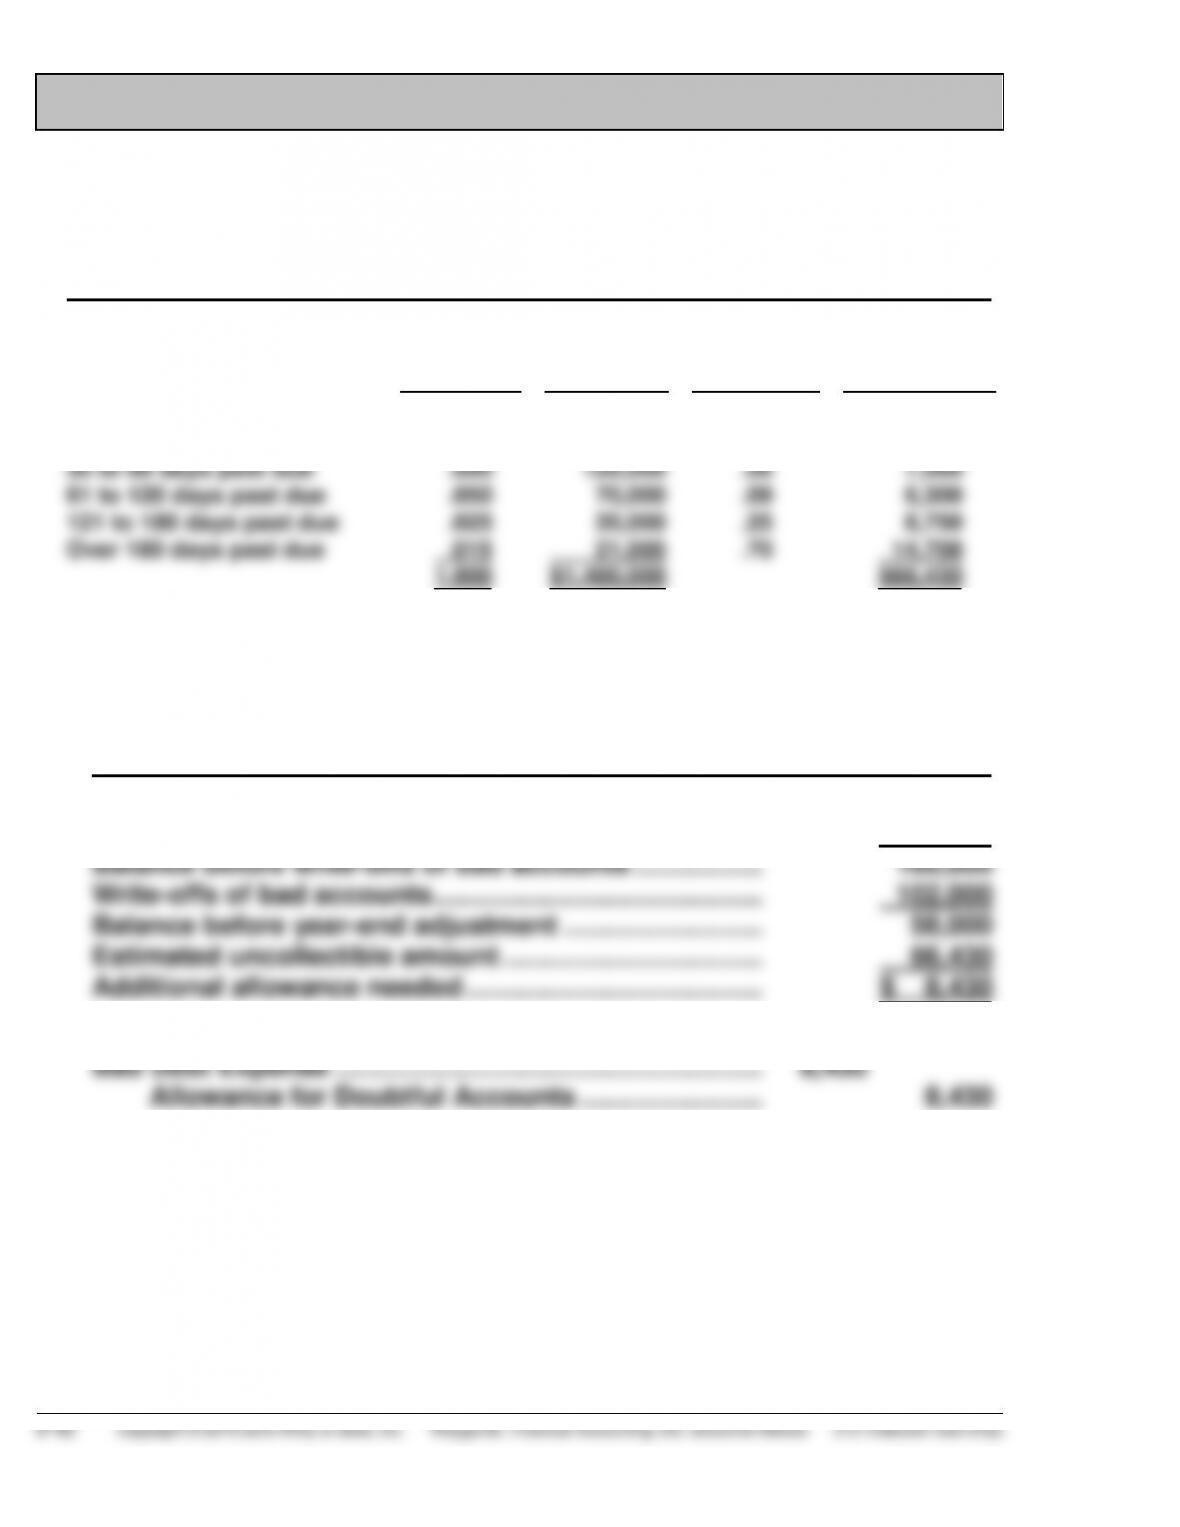
(a) RLF COMPANY
Accounts Receivable Aging Schedule
May 31, 2015
Proportion
of
Total
Amount
in
Category
Probability
of Non-
Collection
Estimated
Uncollectible
Amount
Not yet due
Less than 30 days past due
30 to 60 days past due
61 to 120 days past due
121 to 180 days past due
Over 180 days past due
.600
.220
.090
.050
.025
.015
1.000
$ 840,000
308,000
126,000
70,000
35,000
21,000
$1,400,000
.02
.04
.06
.09
.25
.70
$16,800
12,320
7,560
6,300
8,750
14,700
$66,430
(b) RLF COMPANY
Analysis of Allowance for Doubtful Accounts
May 31, 2015
June 1, 2014 balance ……………………………………………. $ 29,500
Bad debt expense accrual ($2,900,000 X .045)………… 130,500
BYP 8-1 (Continued)
(c)
1.
Steps to Improve the
Accounts Receivable Situation
2.
Risks and
Costs Involved
Establish more selective credit–
granting policies, such as more
restrictive credit requirements or
more thorough credit investigations.
This policy could result in lost sales
and increased costs of credit
evaluation. The company may be all
but forced to adhere to the pre-
vailing credit-granting policies of
the office equipment and supplies
industry.
Establish a more rigorous collec-
tion policy either through external
collection agencies or by its own
personnel.
This policy may offend current
customers and thus risk future
sales. Increased collection costs
could result from this policy.
Charge interest on overdue accounts.
Insist on cash on delivery (cod) or
cash on order (coo) for new cus-
tomers or poor credit risks.
This policy could result in lost sales
and increased administrative costs.
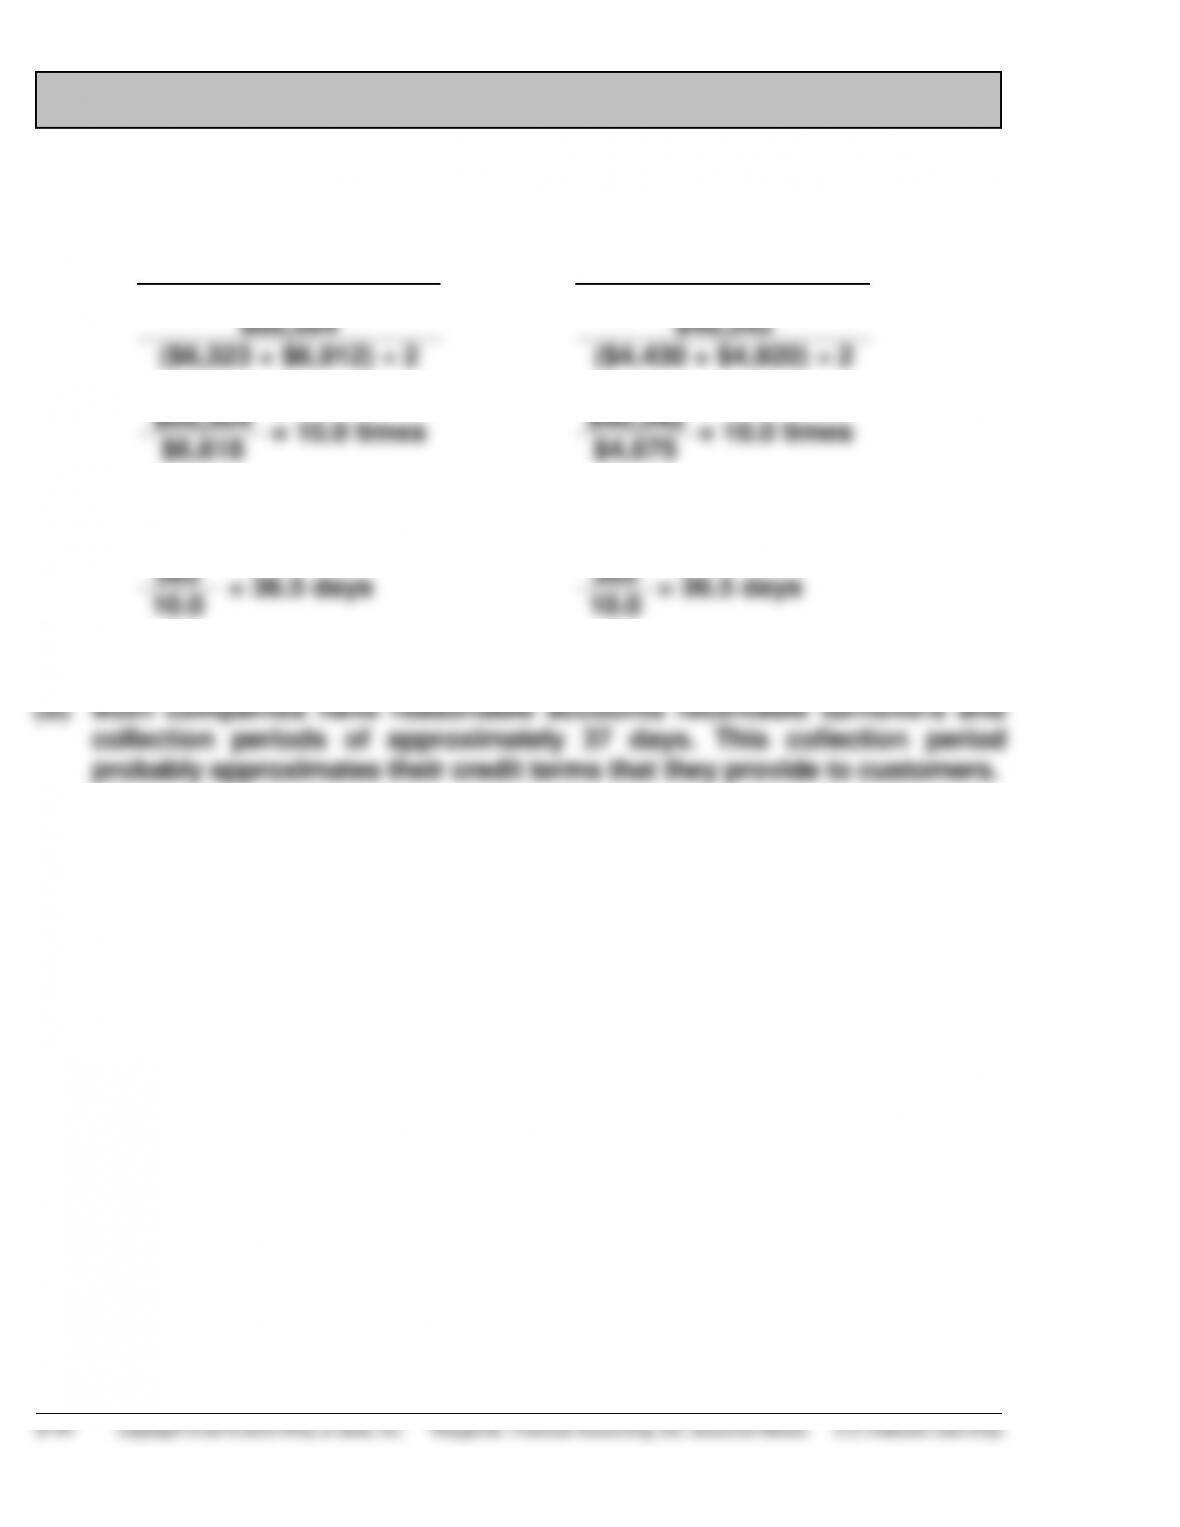
BYP 8-2 COMPARATIVE ANALYSIS PROBLEM
(a)
(1)
Accounts receivable turnover
PepsiCo
Coca-Cola
$66,504
$46,542
($6,323 + $6,912) ÷ 2
($4,430 + $4,920) ÷ 2
$66,504
= 10.0 times
$46,542
= 10.0 times
$6,618
$4,675
(2)
Average collection period
365
= 36.5 days
365
= 36.5 days
10.0
10.0
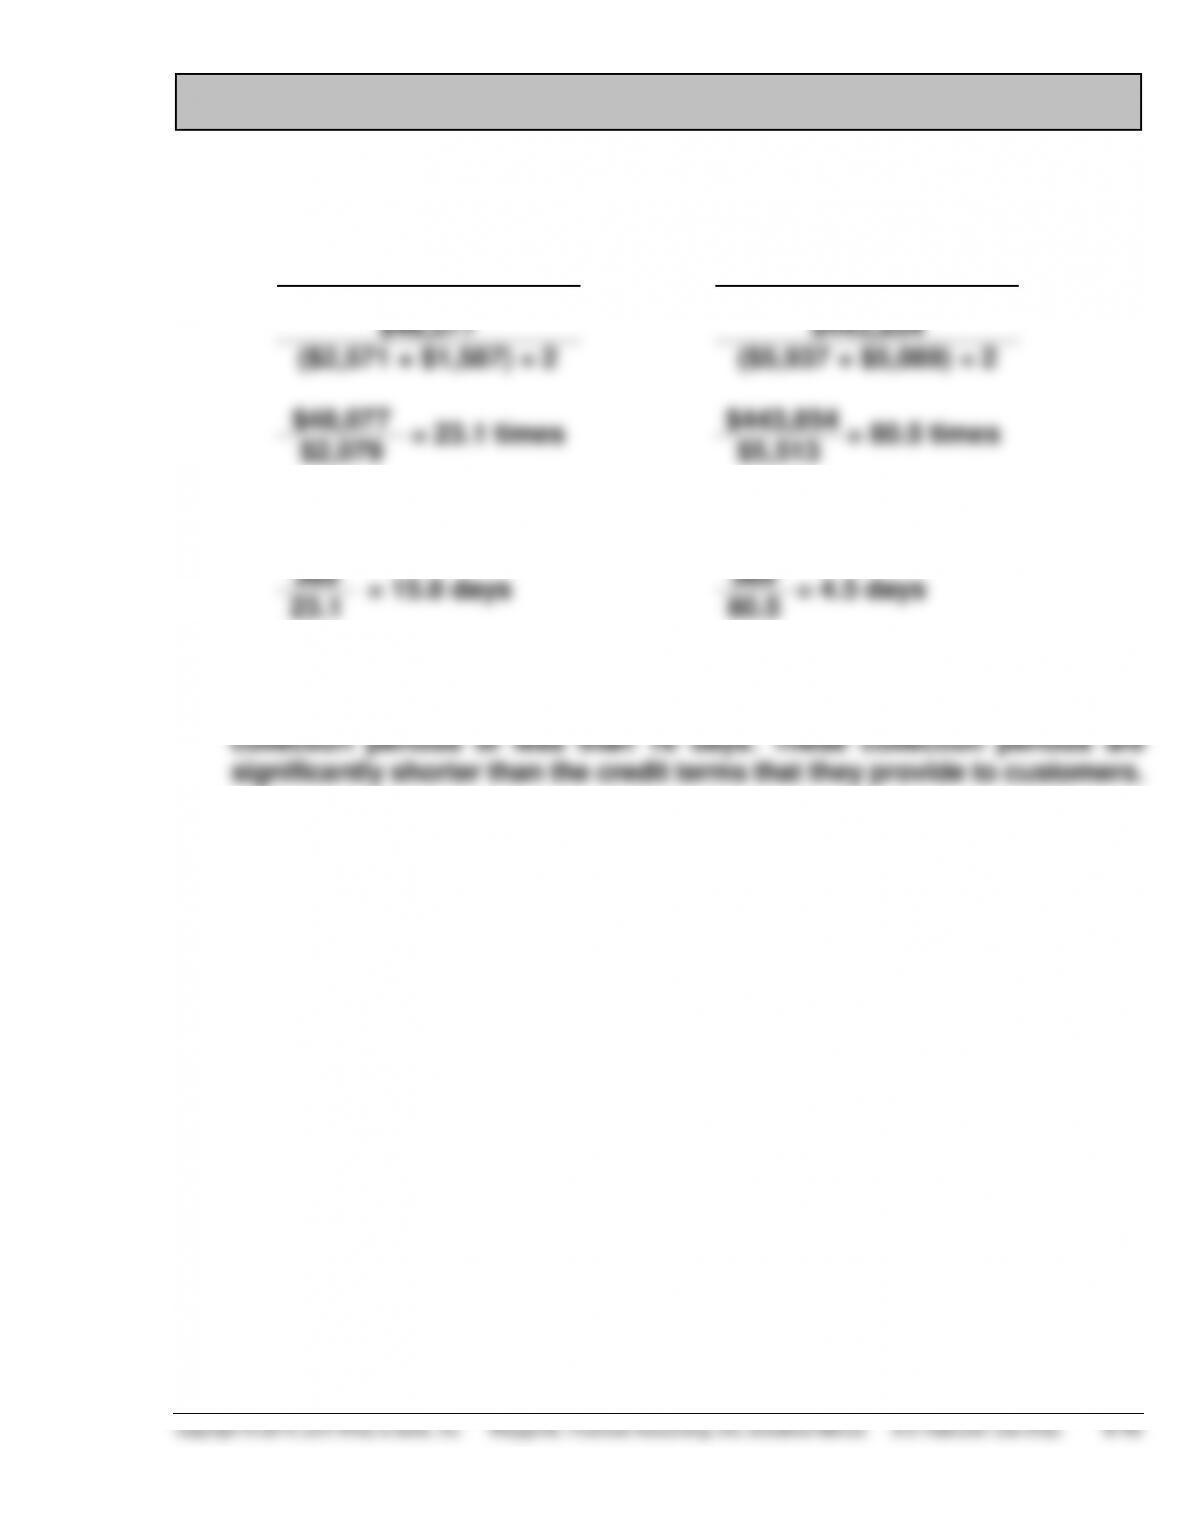
BYP 8-3 COMPARATIVE ANALYSIS PROBLEM
(a)
(1)
Accounts receivable turnover
Amazon
Wal-Mart
$48,077
$443,854
($2,571 + $1,587) ÷ 2
($5,937 + $5,089) ÷ 2
$48,077
= 23.1 times
$443,854
= 80.5 times
$2,079
$5,513
(2)
Average collection period
365
= 15.8 days
365
= 4.5 days
23.1
80.5
(b) Both companies have outstanding accounts receivable turnovers and
BYP 8-4 REAL-WORLD FOCUS
(a) Factoring invoices enhances cash flow and allows a company to meet
business expenses and take on new opportunities. The benefits of
factoring include:
Predictable cash flow and elimination of slow payments
(b) Factoring rates range between 1.5% and 3.5% per month. The two
(c) The first installment is paid within a couple of days and is typically
transaction.
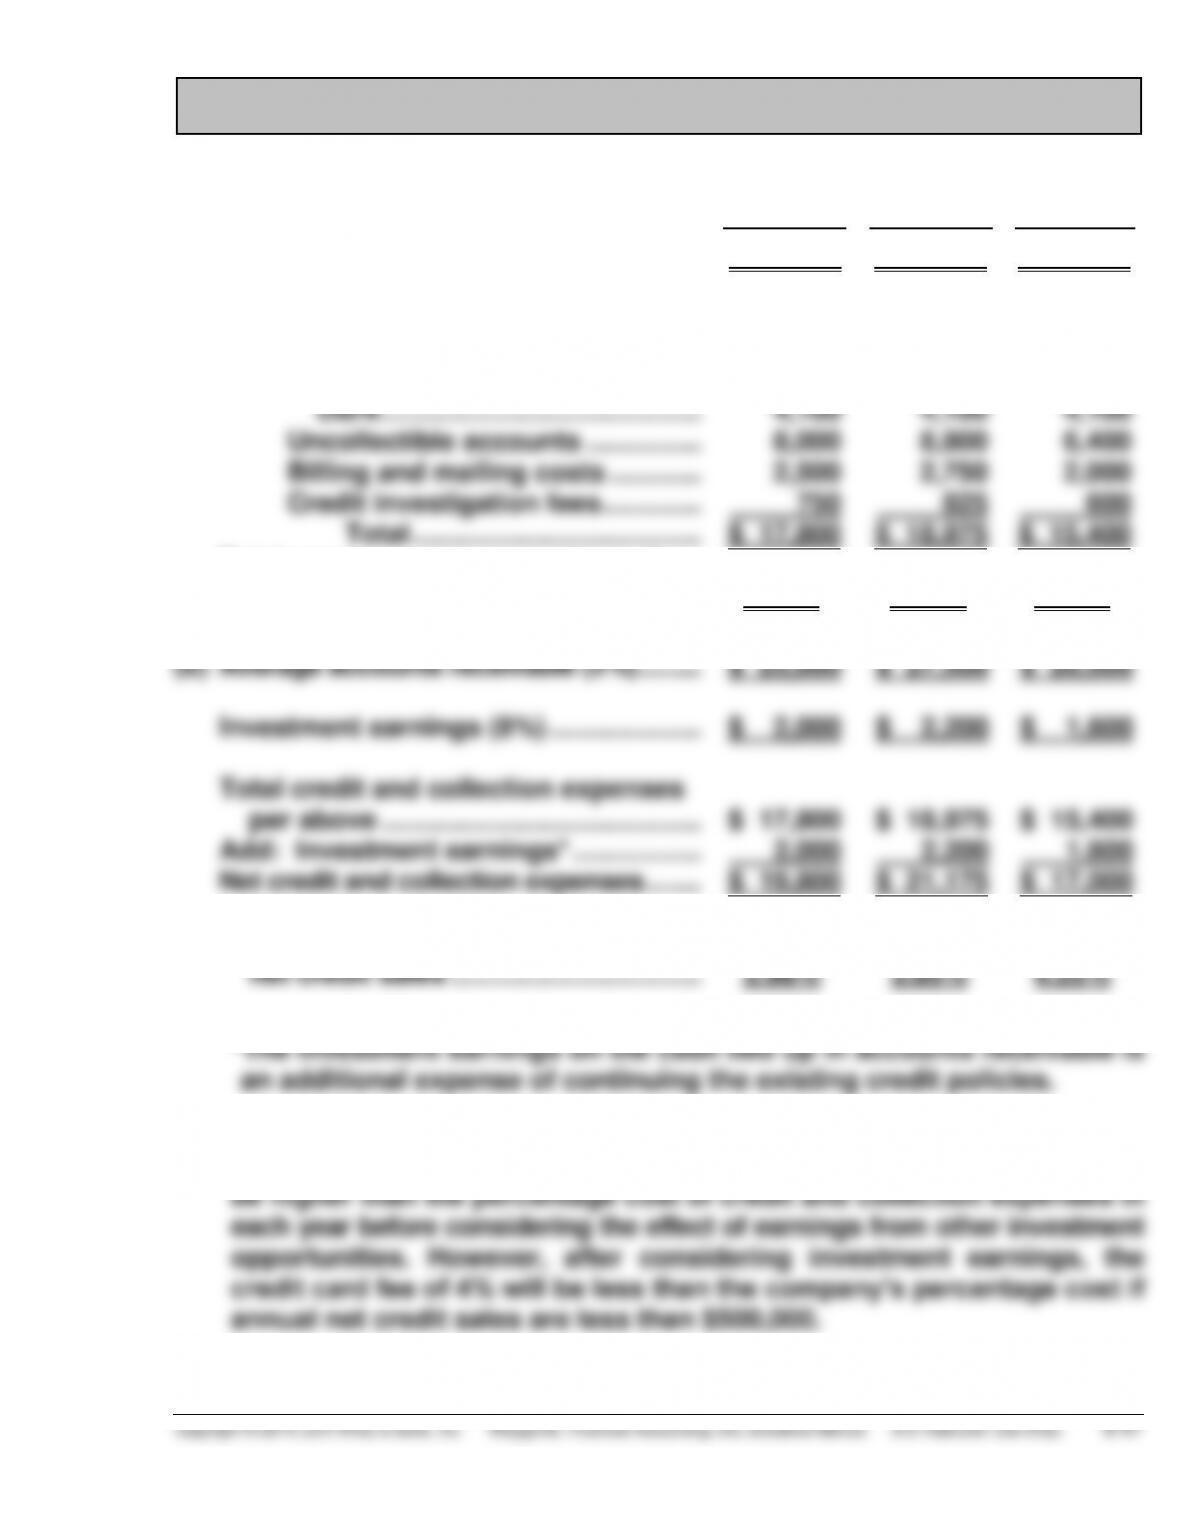
BYP 8-5 DECISION MAKING ACROSS THE ORGANIZATION
(a)
2016
2015
2014
Net credit sales ……………………………….
Credit and collection expenses
Collection agency fees…………….
Salary of accounts receivable
clerk ……………………………………
Uncollectible accounts ……………
Billing and mailing costs …………
Credit investigation fees ………….
Total ………………………………..
Total expenses as a percentage of
net credit sales …………………………...
$500,000
$ 2,450
4,100
8,000
2,500
750
$ 17,800
3.56%
$550,000
$ 2,500
4,100
8,800
2,750
825
$ 18,975
3.45%
$400,000
$ 2,300
4,100
6,400
2,000
600
$ 15,400
3.85%
(b)
Average accounts receivable (5%) ………
Investment earnings (8%) ………………..
Total credit and collection expenses
per above ……………………………………
Add: Investment earnings* ……………..
Net credit and collection expenses ……..
Net expenses as a percentage of
net credit sales …………………………...
$ 25,000
$ 2,000
$ 17,800
2,000
$ 19,800
3.96%
$ 27,500
$ 2,200
$ 18,975
2,200
$ 21,175
3.85%
$ 20,000
$ 1,600
$ 15,400
1,600
$ 17,000
4.25%