BYP 6-1 FINANCIAL REPORTING PROBLEM
(a)
September 24, 2011
September 25, 2010
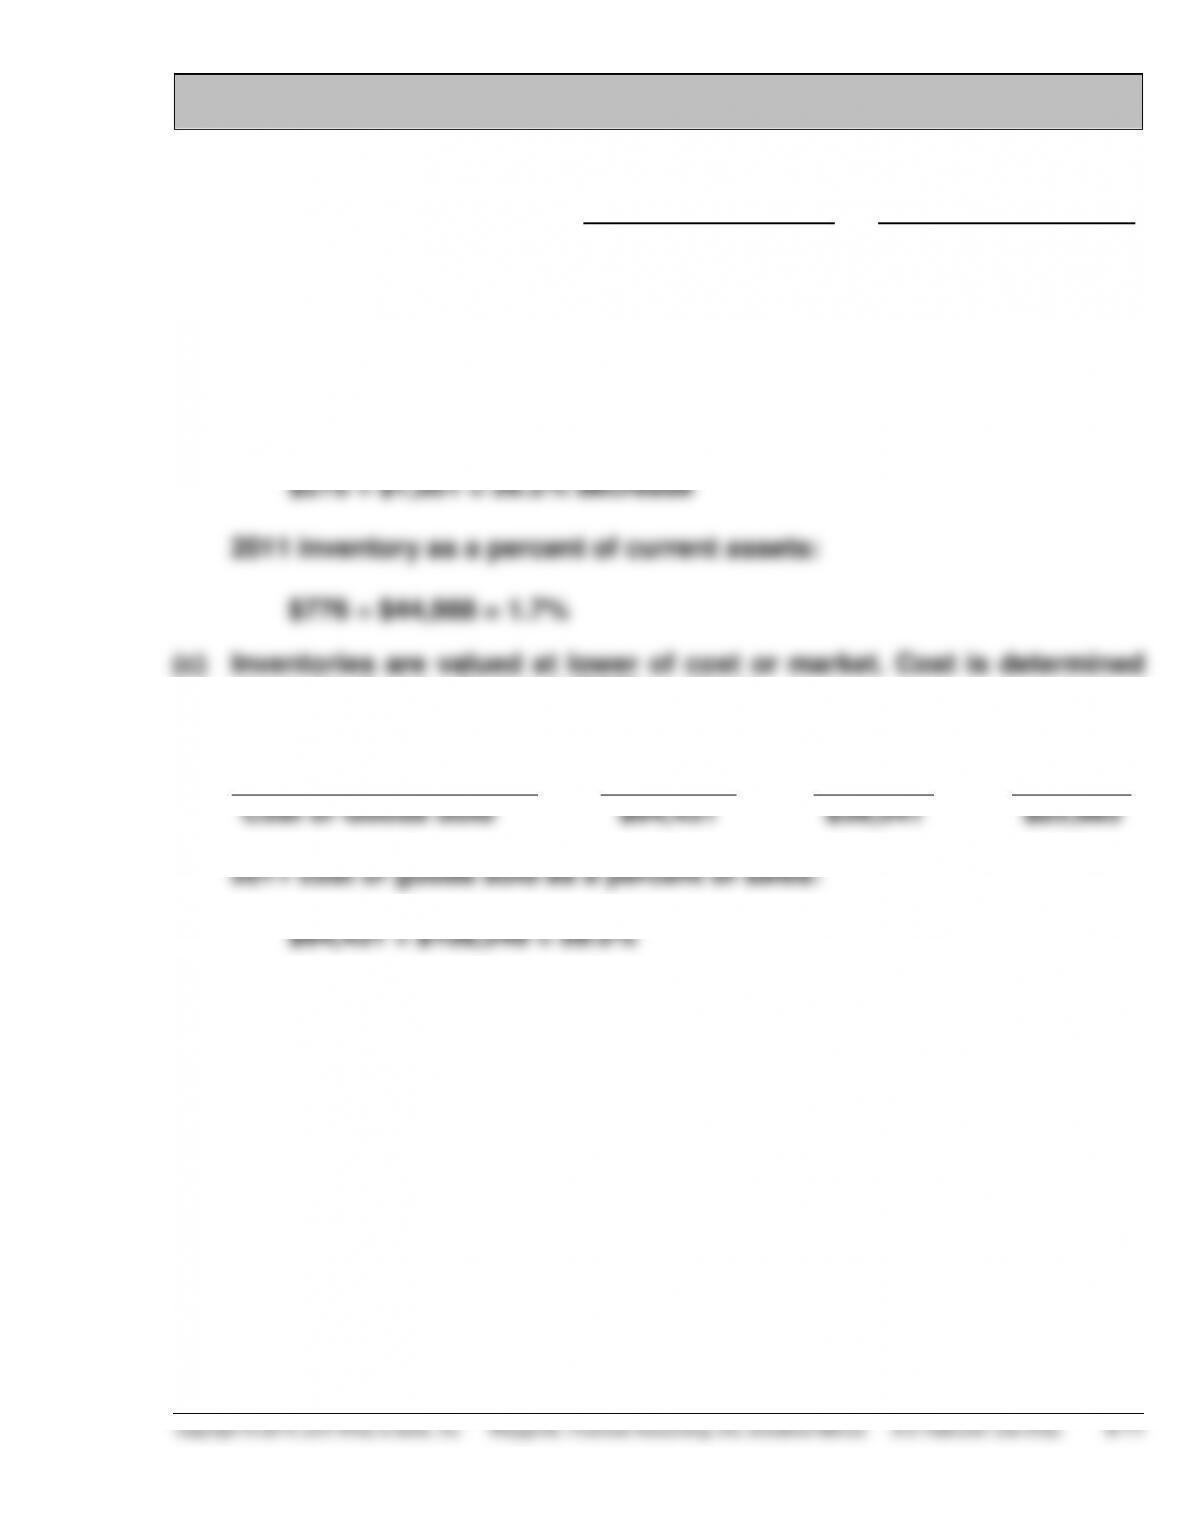
Inventories
$776 million
$1,051 million
(b) Dollar change in inventories between 2010 and 2011:
$776 – $1,051 = $275 million decrease
Percentage change in inventories between 2010 and 2011:
using the first-in, first-out (FIFO) method.
(d)
Apple (in millions)
2011
2010
2009
Cost of Goods Sold
$64,431
$39,541
$25,683
BYP 6-2 COMPARATIVE ANALYSIS PROBLEM
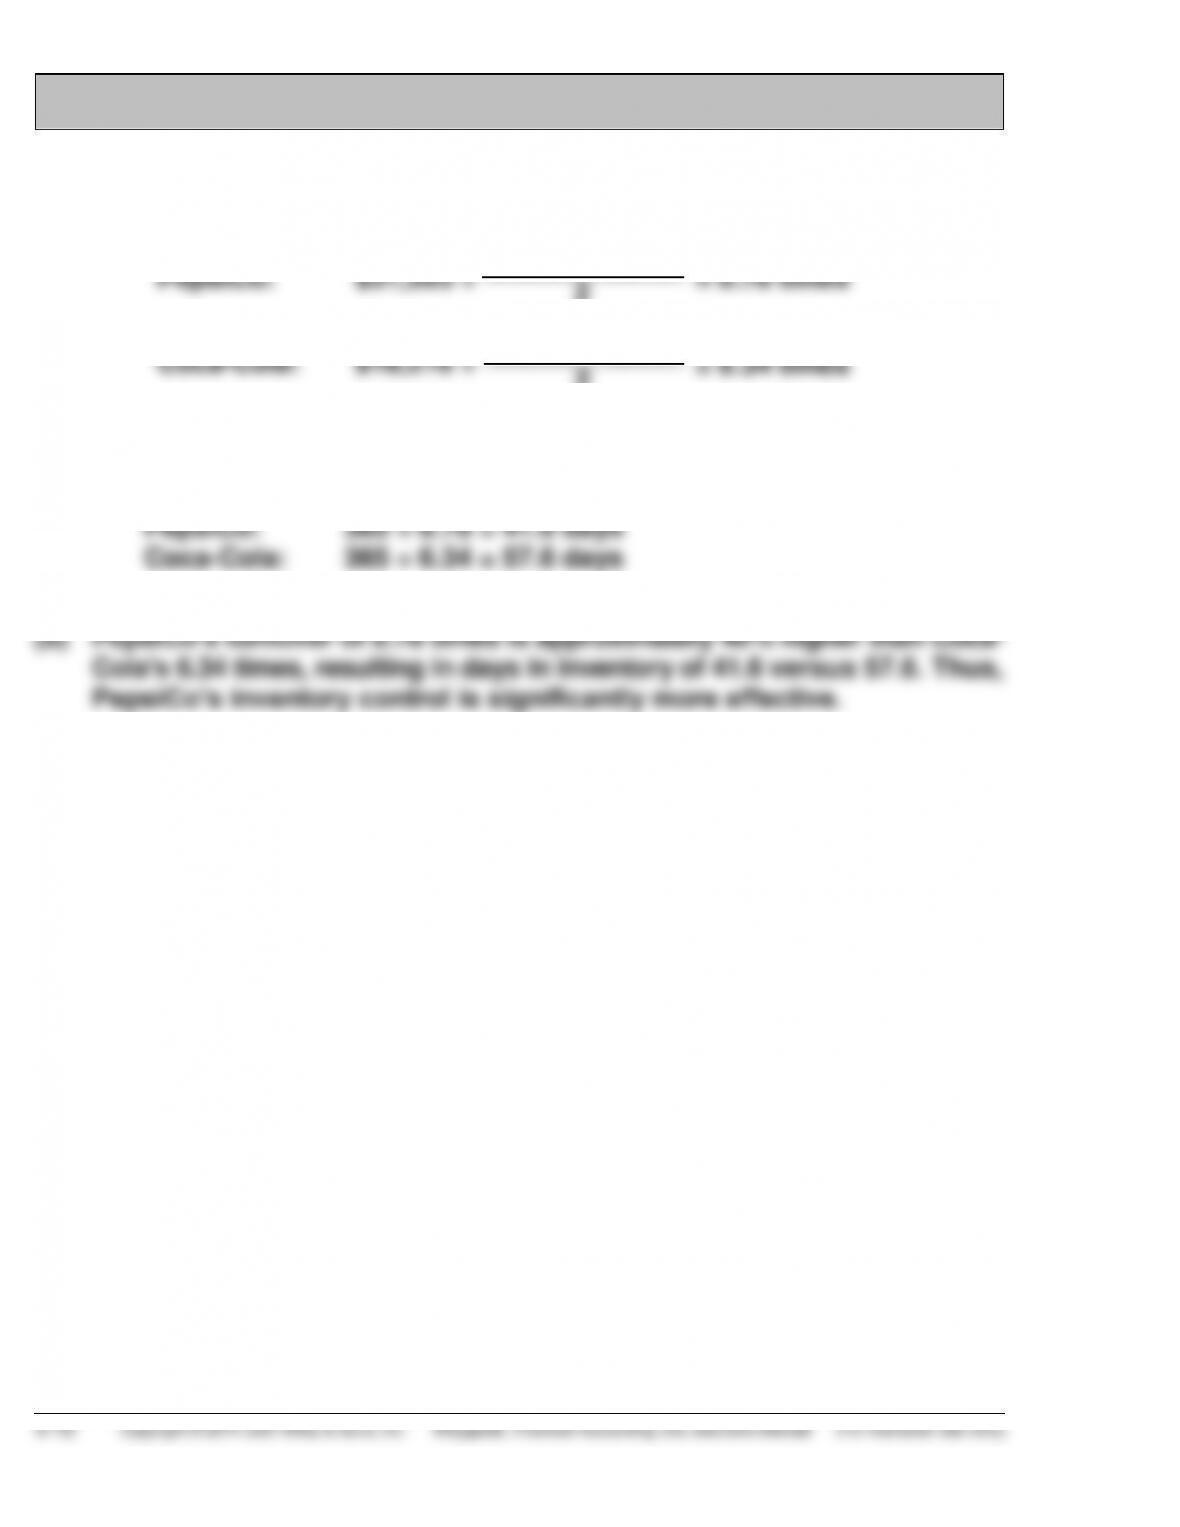
(a) (1) Inventory turnover:
PepsiCo:
$31,593 ÷
$3,827 + 3,372
= 8.78 times
2
Coca-Cola:
$18,216 ÷
$3,092 + 2,650
= 6.34 times
2
(2) Days in inventory:
BYP 6-3 COMPARATIVE ANALYSIS PROBLEM
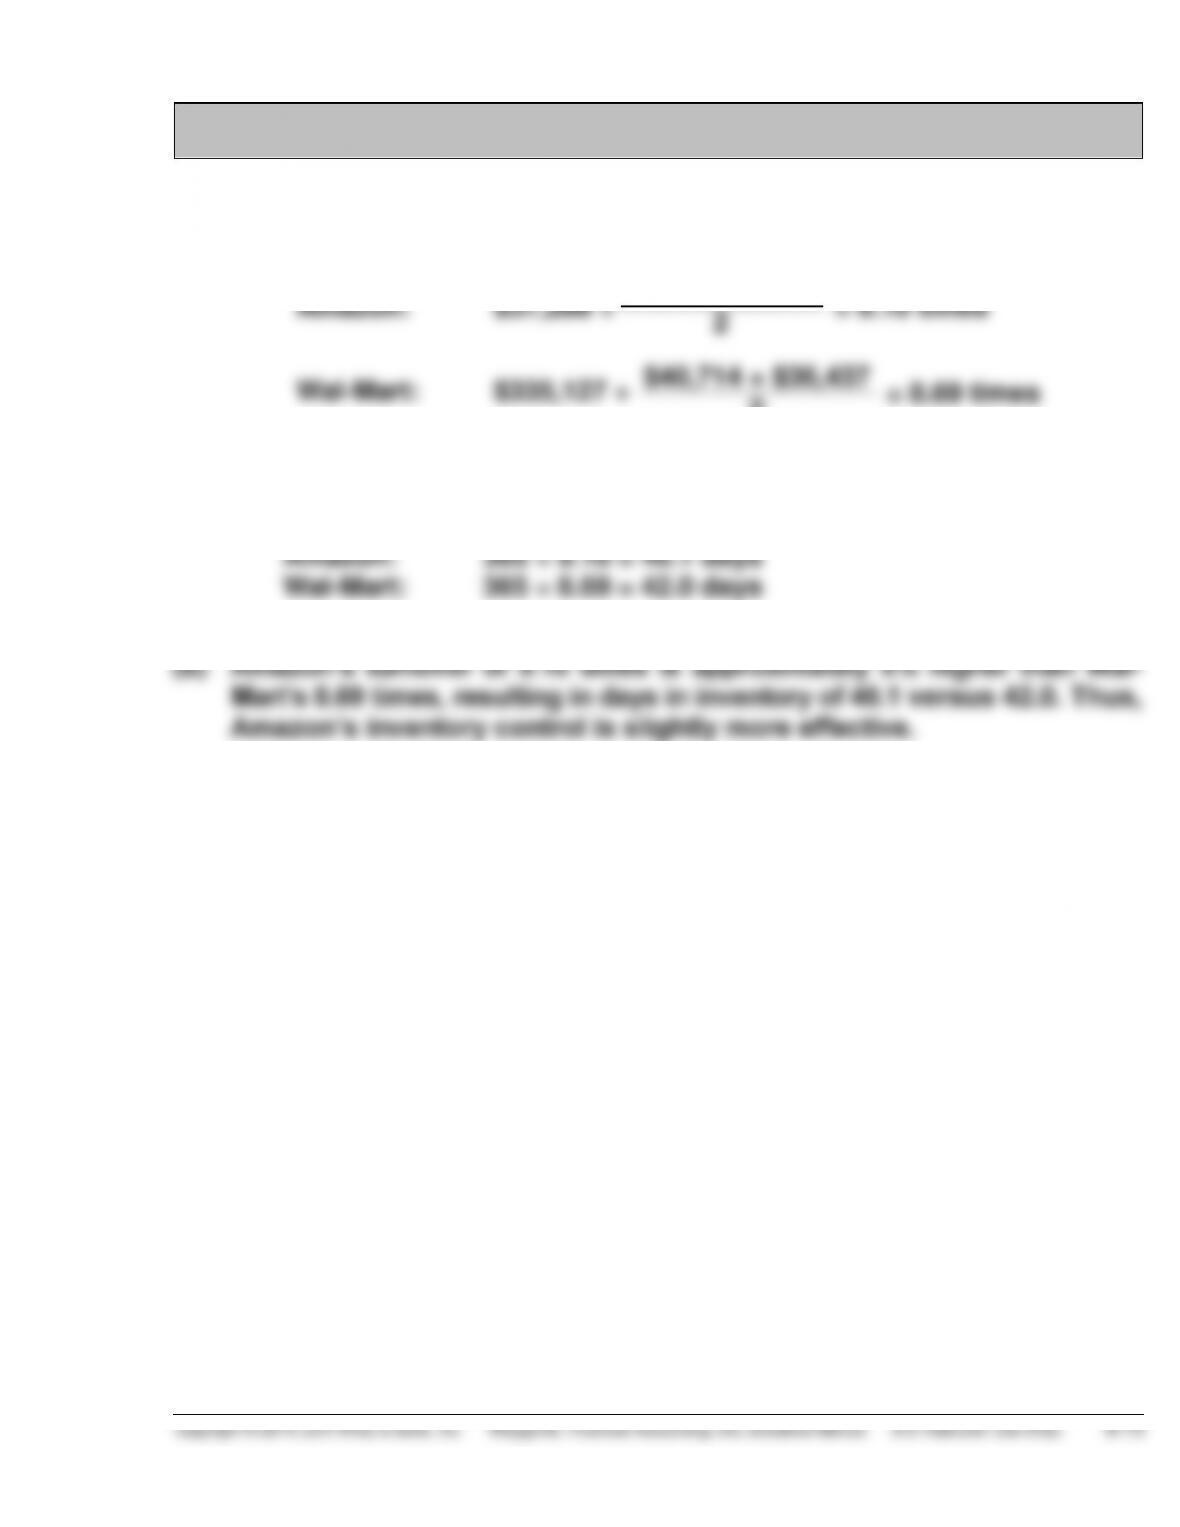
(a) (1) Inventory turnover:
Amazon:
$37,288 ÷
$4,992 + $3,202
= 9.10 times
2
Wal-Mart:
$335,127 ÷
$40,714 + $36,437
= 8.69 times
2
(2) Days in inventory:
BYP 6-4 REAL-WORLD FOCUS
(a) $1,486,000,000, as of July 30, 2011.
BYP 6-5 DECISION MAKING ACROSS THE ORGANIZATION
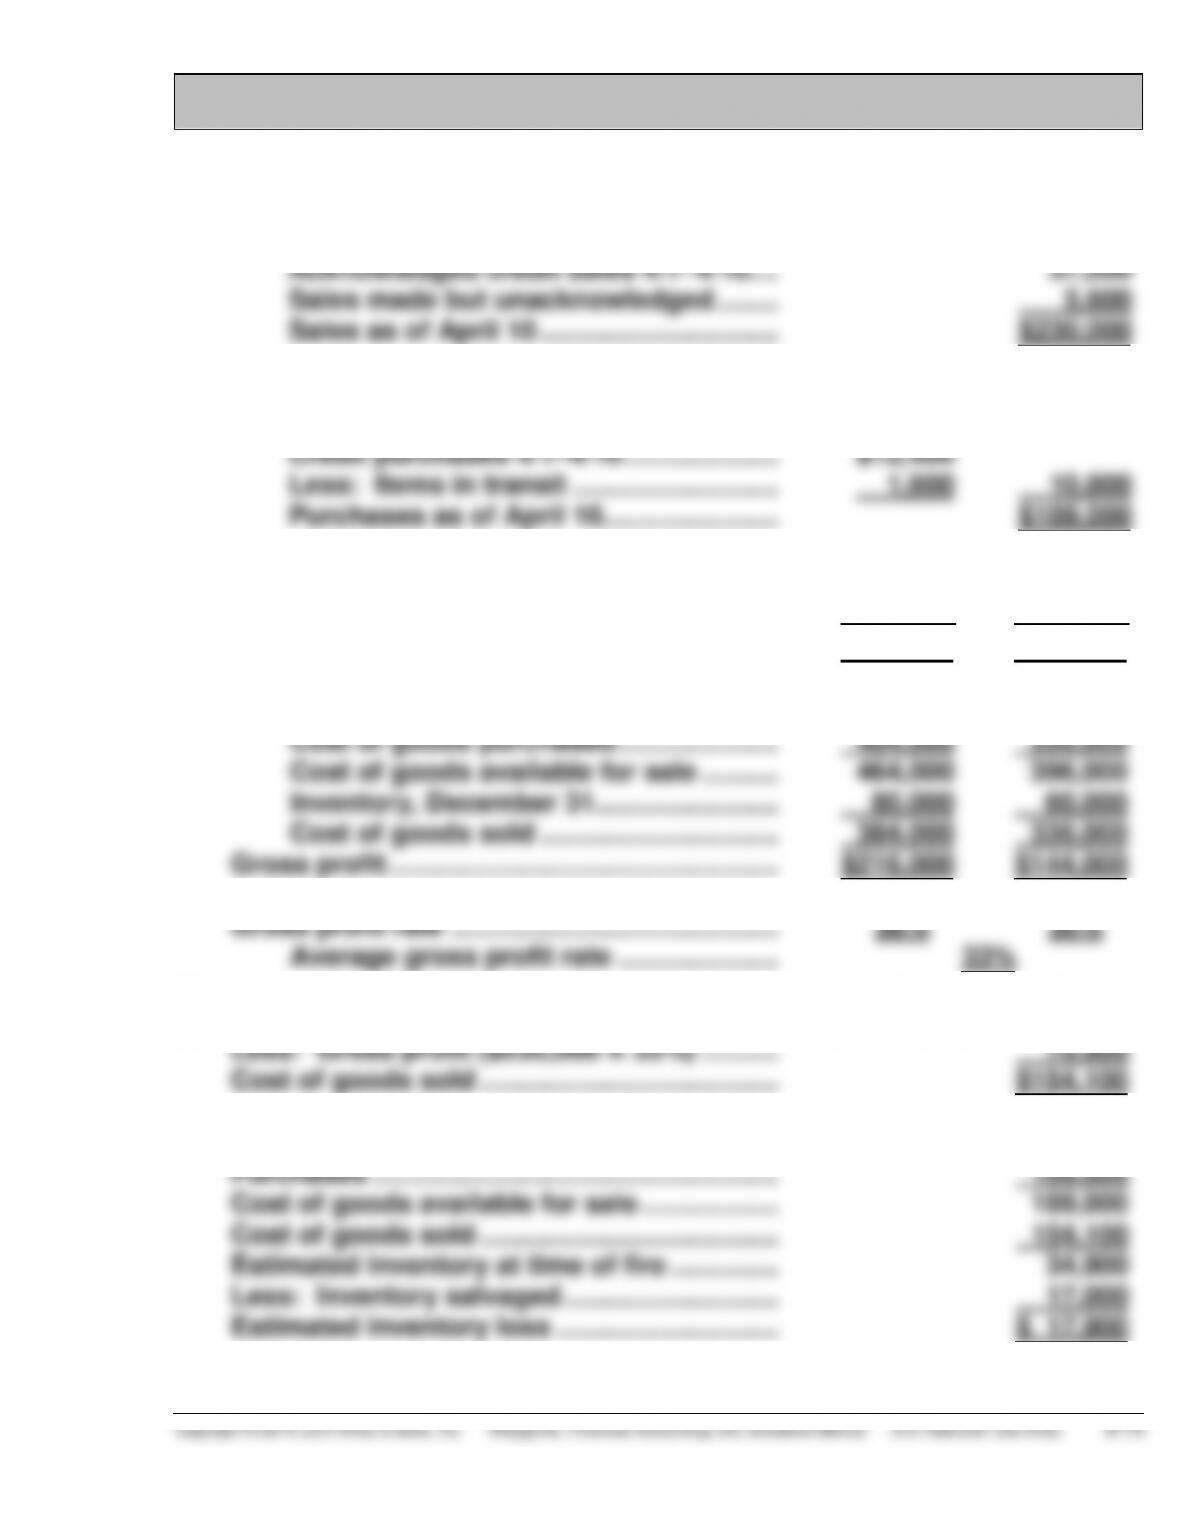
(a) (1) Sales January 1–March 31 ……………….. $180,000
Cash sales 4/1–4/10 ($18,500 X 40%) … 7,400
(2) Purchases January 1–March 31 ……….. $ 94,000
Cash purchases 4/1–4/10 …………………. 4,200
*(b)
2014
2013
Net sales …………………………..…………………… $600,000 $480,000
Cost of goods sold
Inventory, January 1 ……………………….. 60,000 40,000
*(c) Sales …………………………..………………………… $230,000
Inventory, January 1 ………………………………. $ 80,000
BYP 6-6 COMMUNICATION ACTIVITY
MEMO
To: Marta Johns, President
From: Student
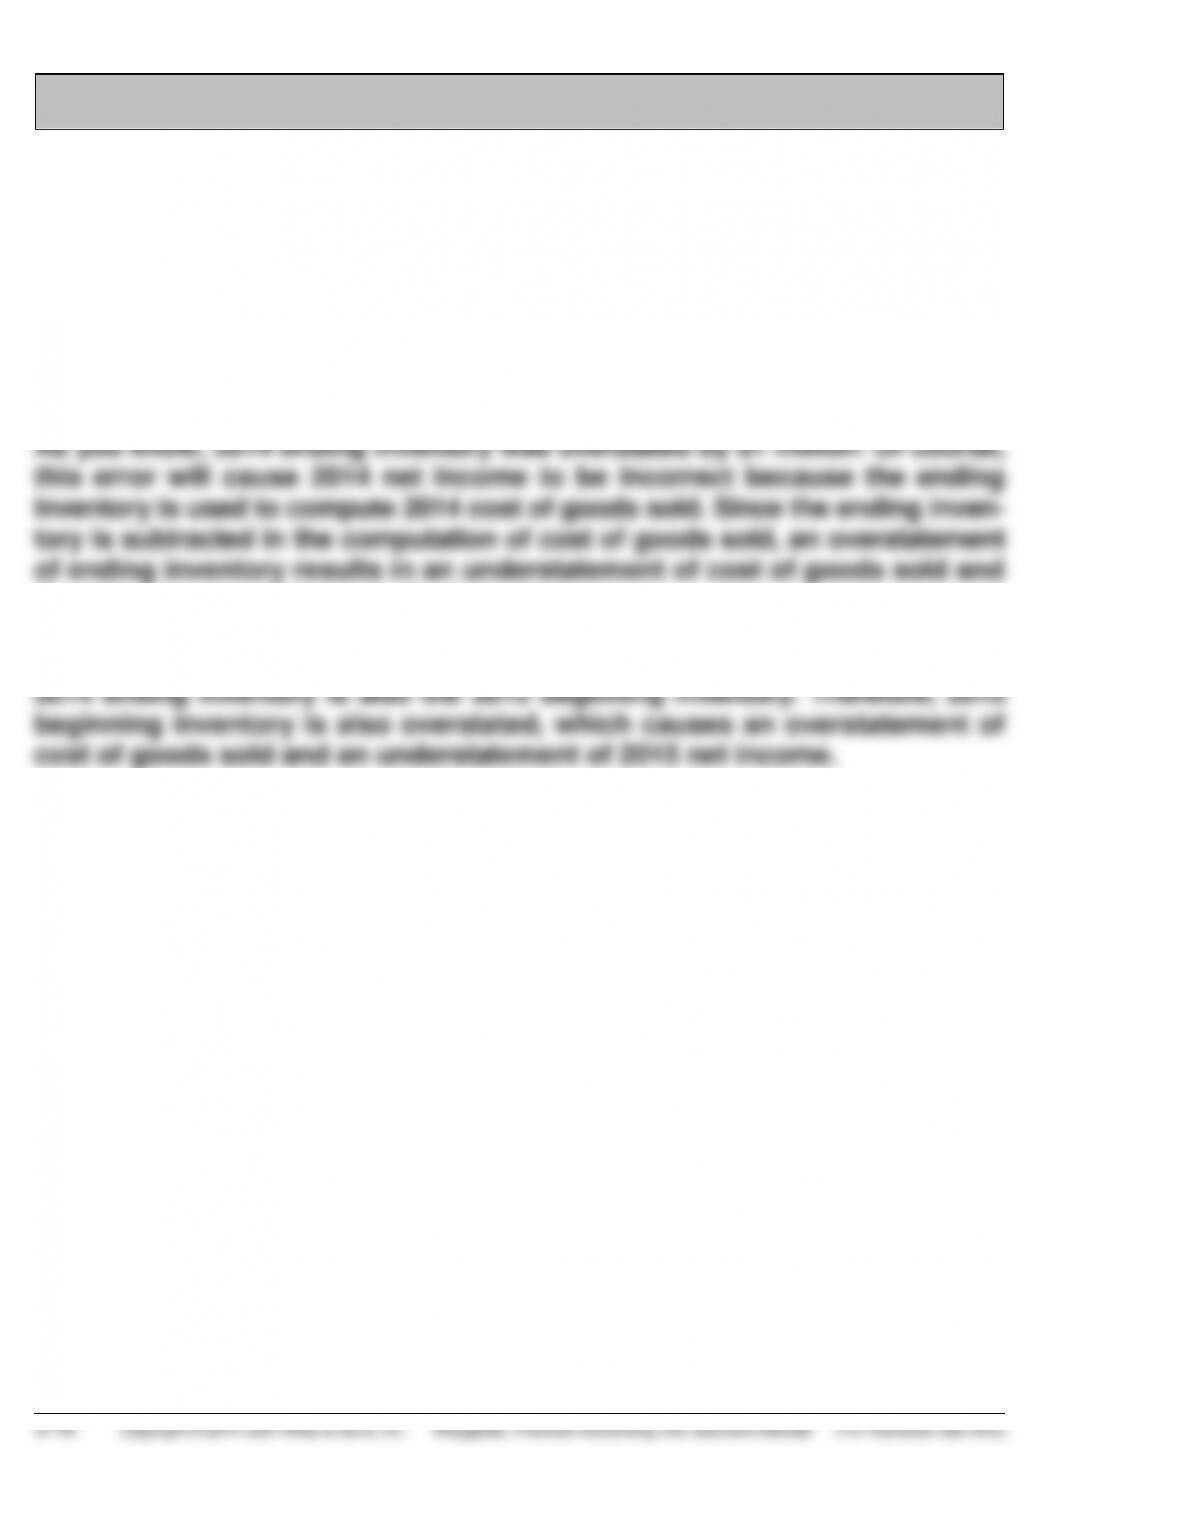
Re: 2014 ending inventory error
therefore an overstatement of net income.
Unfortunately, unless corrected, this error will also affect 2015 net income. The