
PROBLEM 6-3B (Continued)
(b)
LIFO
(1)
Ending Inventory
(2)
Cost of Goods Sold
Date
Units
Unit
Cost
Total
Cost
Cost of goods
available for sale
$19,300
1/1
400
$8
$3,200
Less: Ending
inventory
4,100
2/20
100
9
900
500
$4,100
Cost of goods sold
$15,200
Proof of Cost of Goods Sold
Date
Units
Unit
Cost
Total
Cost
12/8
200
$12
$ 2,400
8/12
300
11
3,300
5/5
500
10
5,000
2/20
500
9
4,500
1,500
$15,200
AVERAGE-COST
(1)
Ending Inventory
(2)
Cost of Goods Sold
$19,300 ÷ 2,000 = $9.65
Cost of goods
available for sale
$19,300
Units
Unit
Cost
Total
Cost
Less: Ending
inventory
4,825
500
$9.65
$4,825
Cost of goods sold
$14,475
Proof of Cost of Goods Sold
1,500 units X 9.65 = $14,475
$4,100.
PROBLEM 6-4B
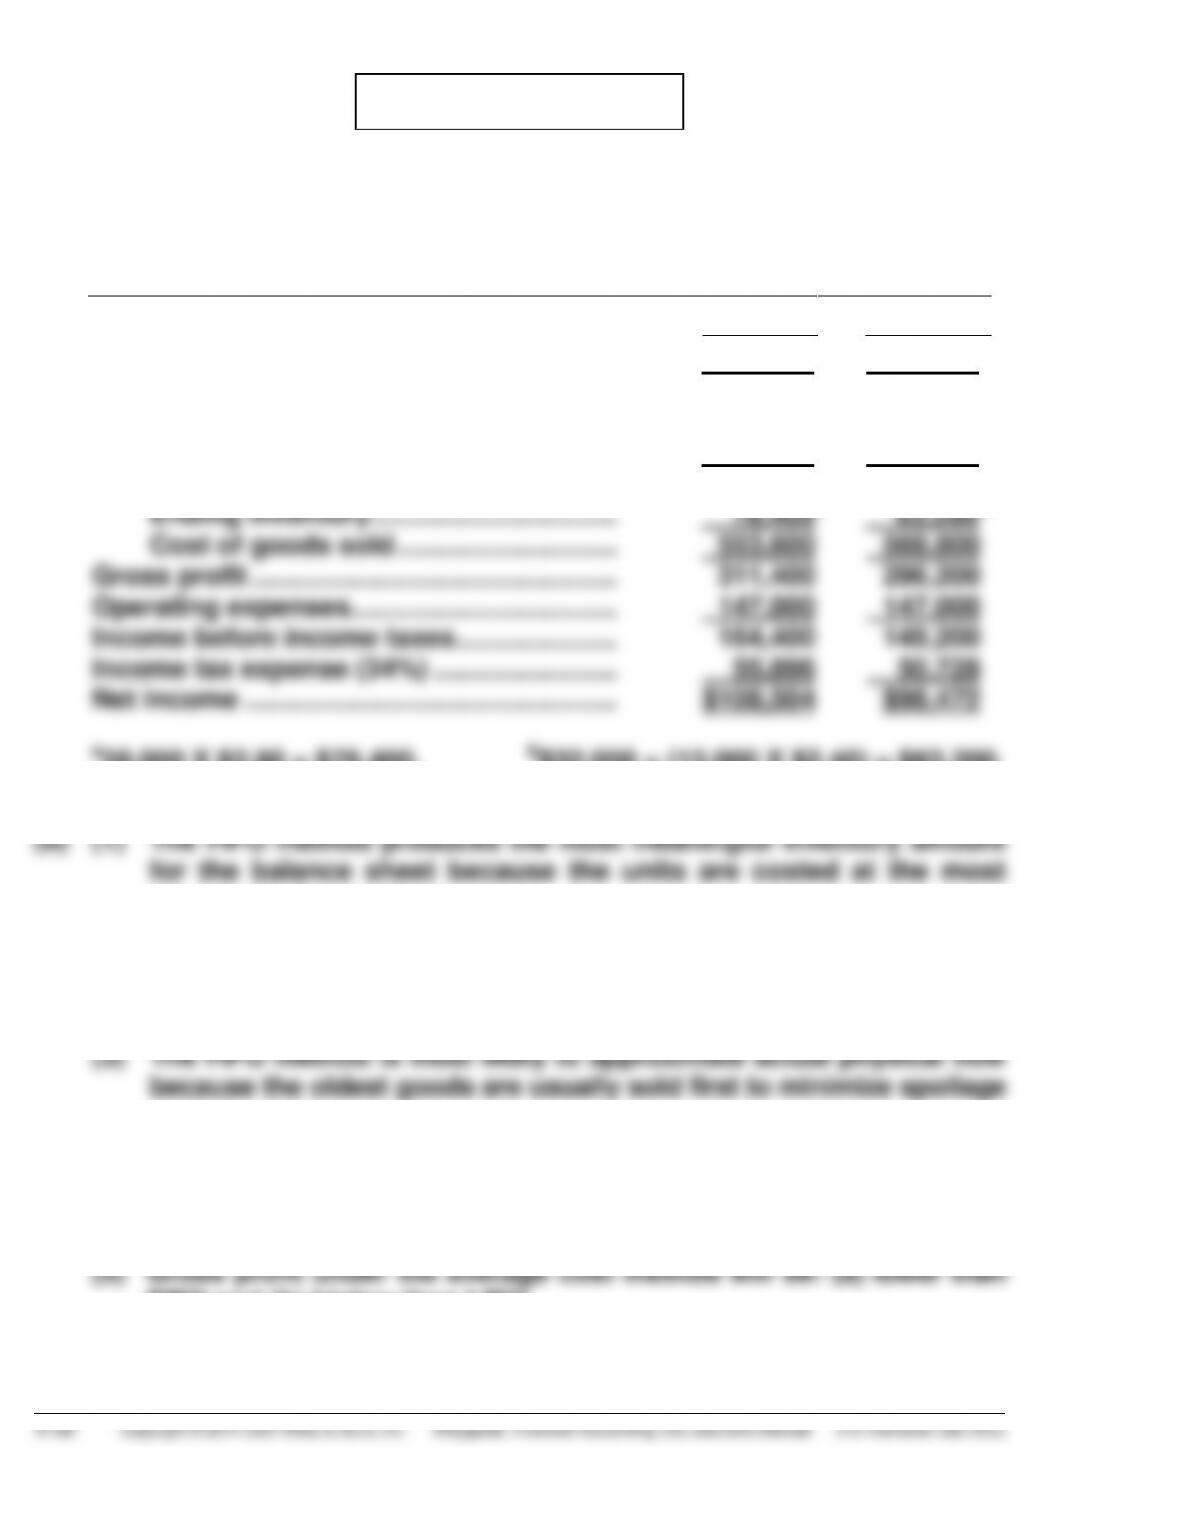
(a) Patel CO.
Condensed Income Statement
For the Year Ended December 31, 2015
FIFO
LIFO
Sales revenue ……………………………………… $865,000 $865,000
Cost of goods sold
Beginning inventory ……………………… 32,000 32,000
Cost of goods purchased ……………… 600,000 600,000
Cost of goods available for sale …….. 632,000 632,000
recent purchase prices.
(2) The LIFO method produces the most meaningful net income because
the costs of the most recent purchases are matched against sales.
and obsolescence.
(4) There will be $5,168 additional cash available under LIFO because
income taxes are $50,728 under LIFO and $55,896 under FIFO.
FIFO and (b) higher than LIFO.
PROBLEM 6-5B
Cost of Goods Available for Sale
Date
Explanation
Units
Unit Cost
Total Cost
October 1
Beginning Inventory
60
$25
$1,500
9
Purchase
120
26
3,120
17
Purchase
70
27
1,890
25
Purchase
80
28
2,240
Total
330
$8,750
Ending Inventory in Units:
Sales Revenue
Units available for sale
330
Unit
Sales (100 + 60 + 110)
270
Date
Units
Price
Total Sales
Units remaining in ending inventory
60
October 11
100
$35
$ 3,500
22
60
40
2,400
29
110
40
4,400
270
$10,300
(a)
(1)
LIFO
(i)
Ending Inventory
(ii)
Cost of Goods Sold
October 1
60 @ $25 = $1,500
Cost of goods available
for sale
$8,750
Less: Ending inventory
1,500
Cost of goods sold
$7,250
(iii)
Gross Profit
(iv)
Gross Profit Rate
Sales revenue
$10,300
Gross profit
$ 3,050
=
29.6%
Cost of goods sold
7,250
Net sales
$10,300
Gross profit
$ 3,050

PROBLEM 6-5B (Continued)
(2)
FIFO
(i)
Ending Inventory
(ii)
Cost of Goods Sold
October 25
60 @ $28 = $1,680
Cost of goods available
for sale
$ 8,750
Less: Ending inventory
1,680
Cost of goods sold
$ 7,070
(iii)
Gross Profit
(iv)
Gross Profit Rate
Sales revenue
$10,300
Gross profit
$ 3,230
=
31.4%
Cost of goods sold
7,070
Net sales
$10,300
Gross profit
$ 3,230
(3)
Average-Cost
Weighted-average cost per unit:
cost of goods available for sale
units available for sale
$8,750
=
$26.515
330
(i)
Ending Inventory
(ii)
Cost of Goods Sold
60 @ $26.515 = $1,591*
Cost of goods available
for sale
$8,750
*rounded to nearest dollar
Less: Ending inventory
1,591
Cost of goods sold
$7,159
(iii)
Gross Profit
(iv)
Gross Profit Rate
Sales revenue
$10,300
Gross profit
$ 3,141
=
30.5%
Cost of goods sold
7,159
Net sales
$10,300
Gross profit
$ 3,141
(b) LIFO produces the lowest ending inventory value, gross profit, and
gross profit rate because its cost of goods sold is higher than FIFO or
average-cost.

PROBLEM 6-6B
(a) (1) To maximize gross profit, Princess Diamonds should sell the
diamonds with the lowest cost.
Sale Date
Cost of Goods Sold
Sales Revenue
March 5
150 @ $300
$ 45,000
180 @ $600
$108,000
30 @ $360
10,800
400 @ $650
260,000
March 25
170 @ $360
61,200
230 @ $380
87,400
580
$204,400
580
$368,000
(2) To minimize gross profit, Princess Diamonds should sell the diamonds
with the highest cost.
Sale Date
Cost of Goods Sold
Sales Revenue
March 5
180 @ $360
$ 64,800
180 @ $600
$108,000
March 25
350 @ $380
133,000
400 @ $650
260,000
20 @ $360
7,200
30 @ $300
9,000
580
$214,000
580
$368,000
Gross profit $368,000 – $214,000 = $154,000.
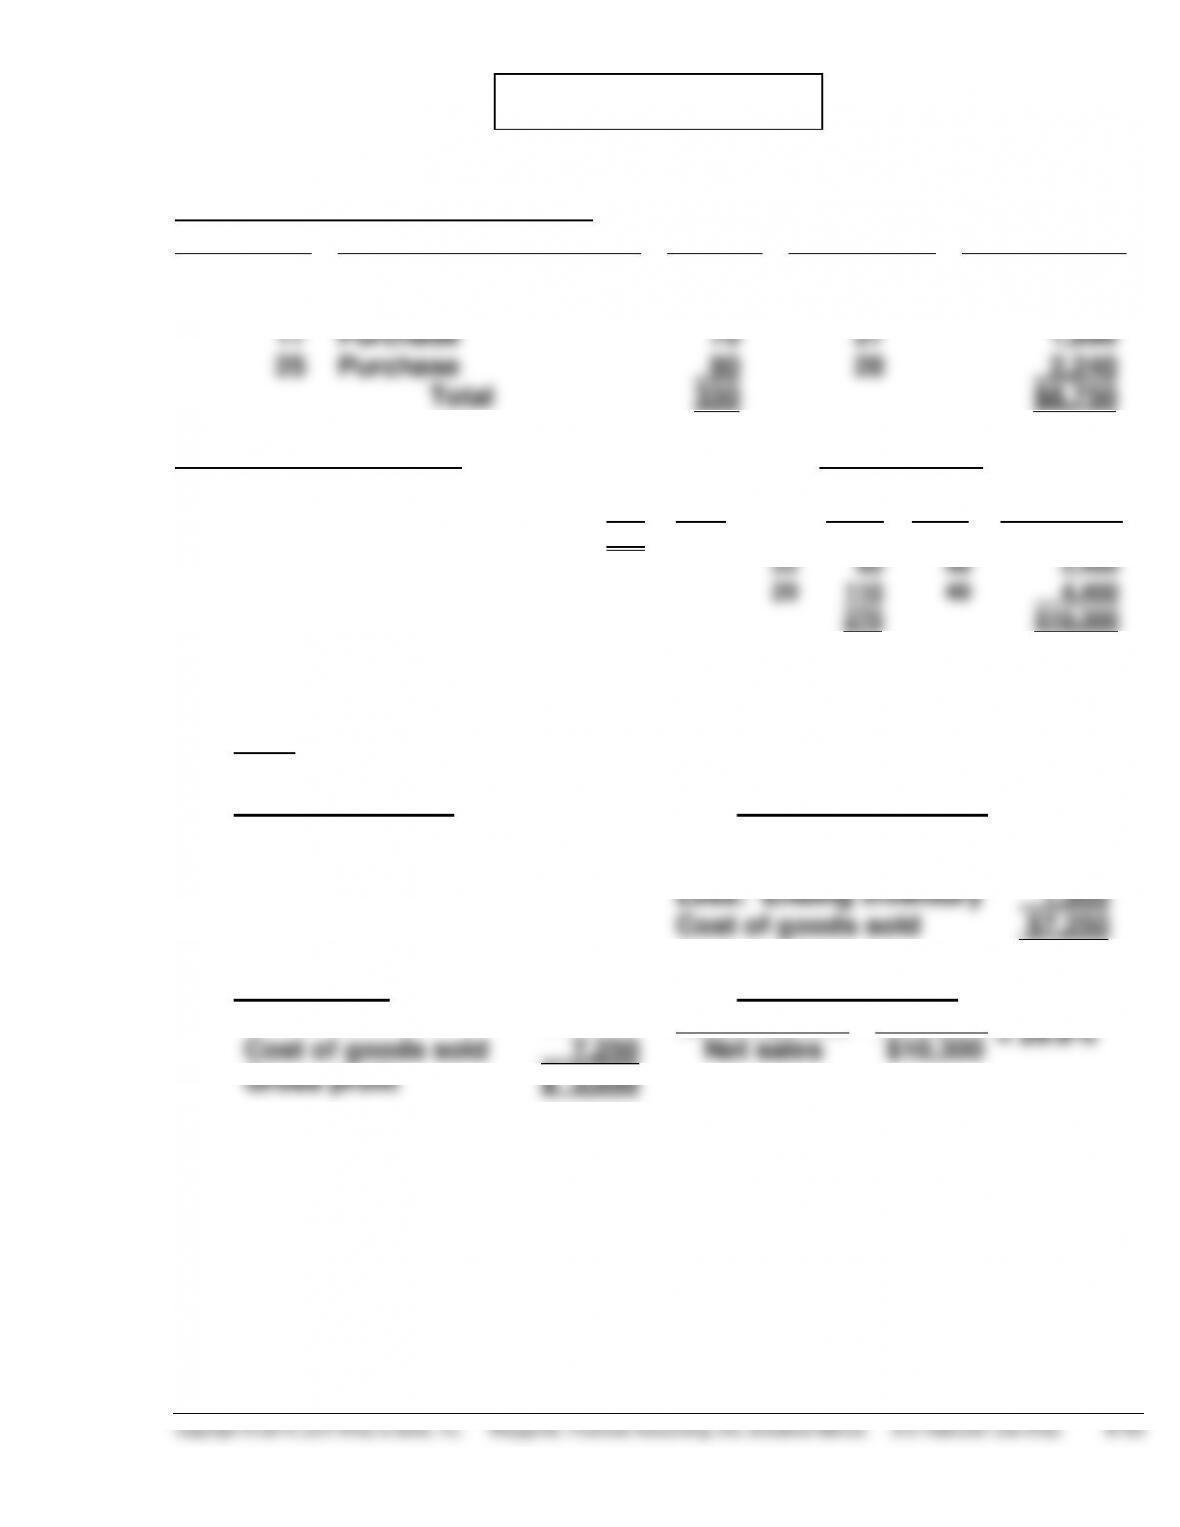
(b) FIFO
Cost of goods available for sale
March 1
Beginning inventory
150 @ $300
$ 45,000
3
Purchase
200 @ $360
72,000
10
Purchase
350 @ $380
133,000
700
$250,000
Goods available for sale
700
Units sold
580
Ending inventory
120 @ $380
$45,600
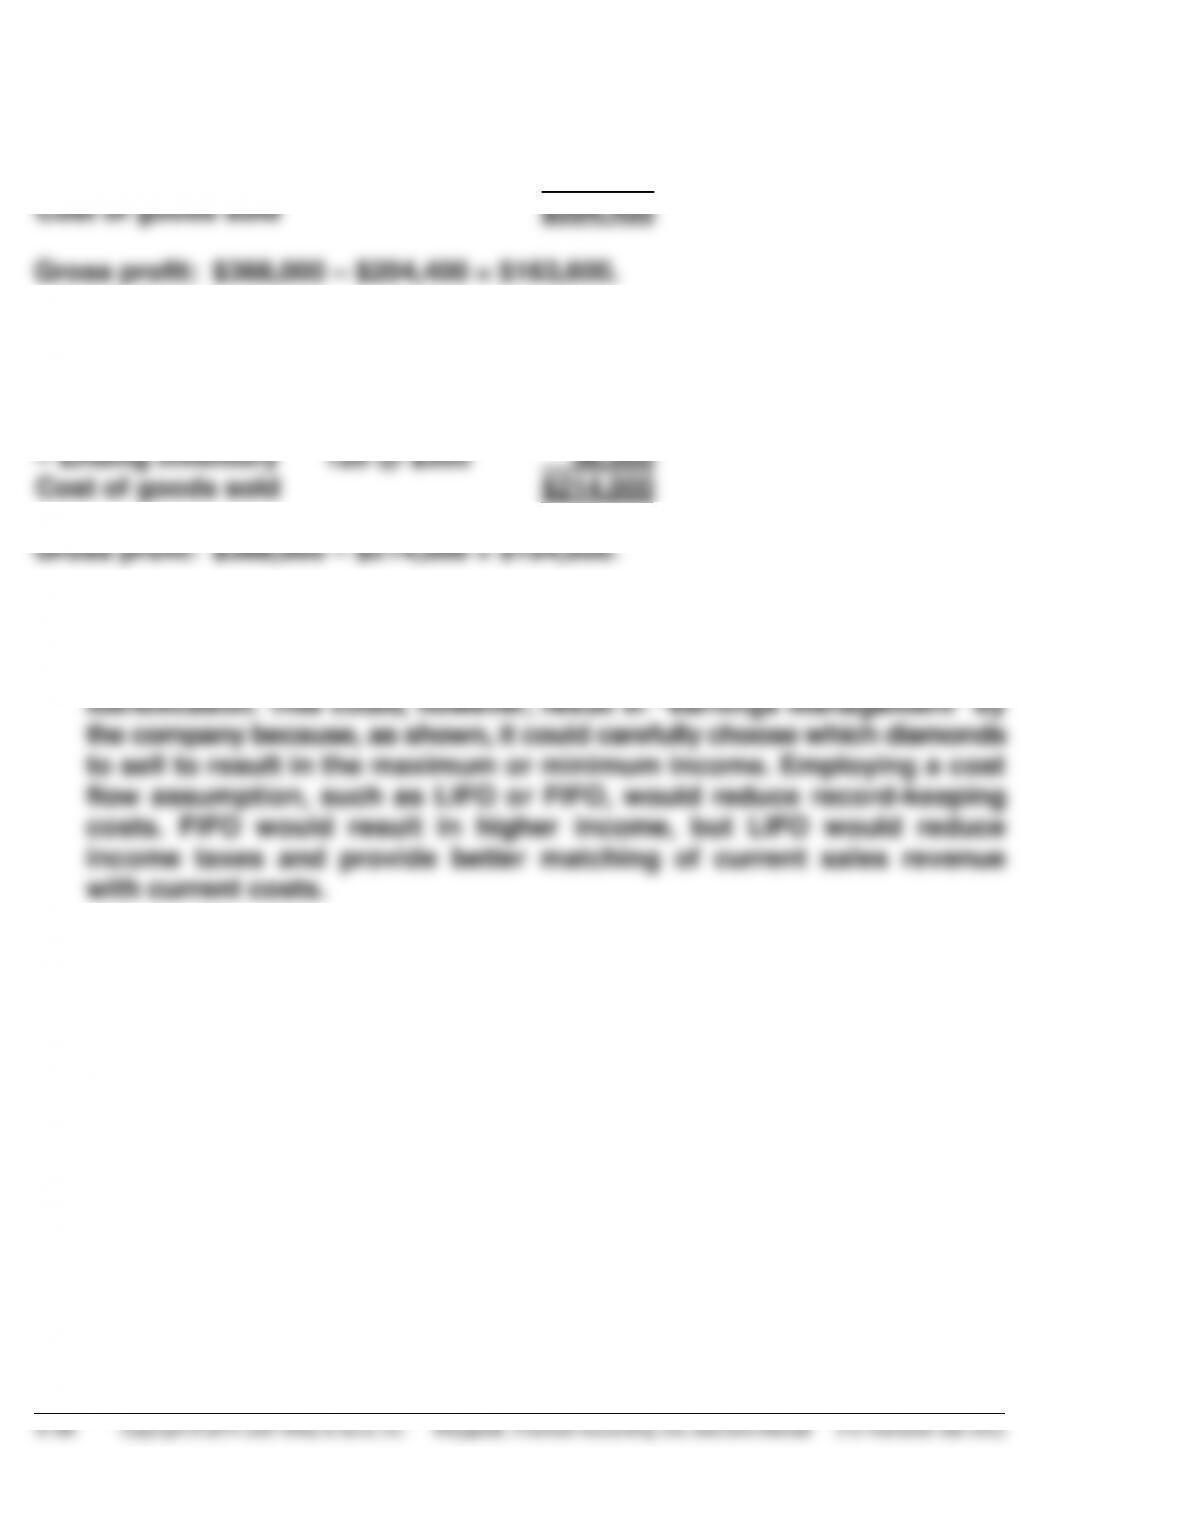
PROBLEM 6-6B (Continued)
Goods available for sale
$250,000
– Ending inventory
45,600
Cost of goods sold
$204,400
(c) LIFO
Cost of goods available for sale
$250,000
(from part b)
– Ending inventory 120 @ $300
36,000
Cost of goods sold
$214,000
(d) The choice of inventory method depends on the company’s objectives.
Since the diamonds are marked and coded, the company could use specific
PROBLEM 6-7B
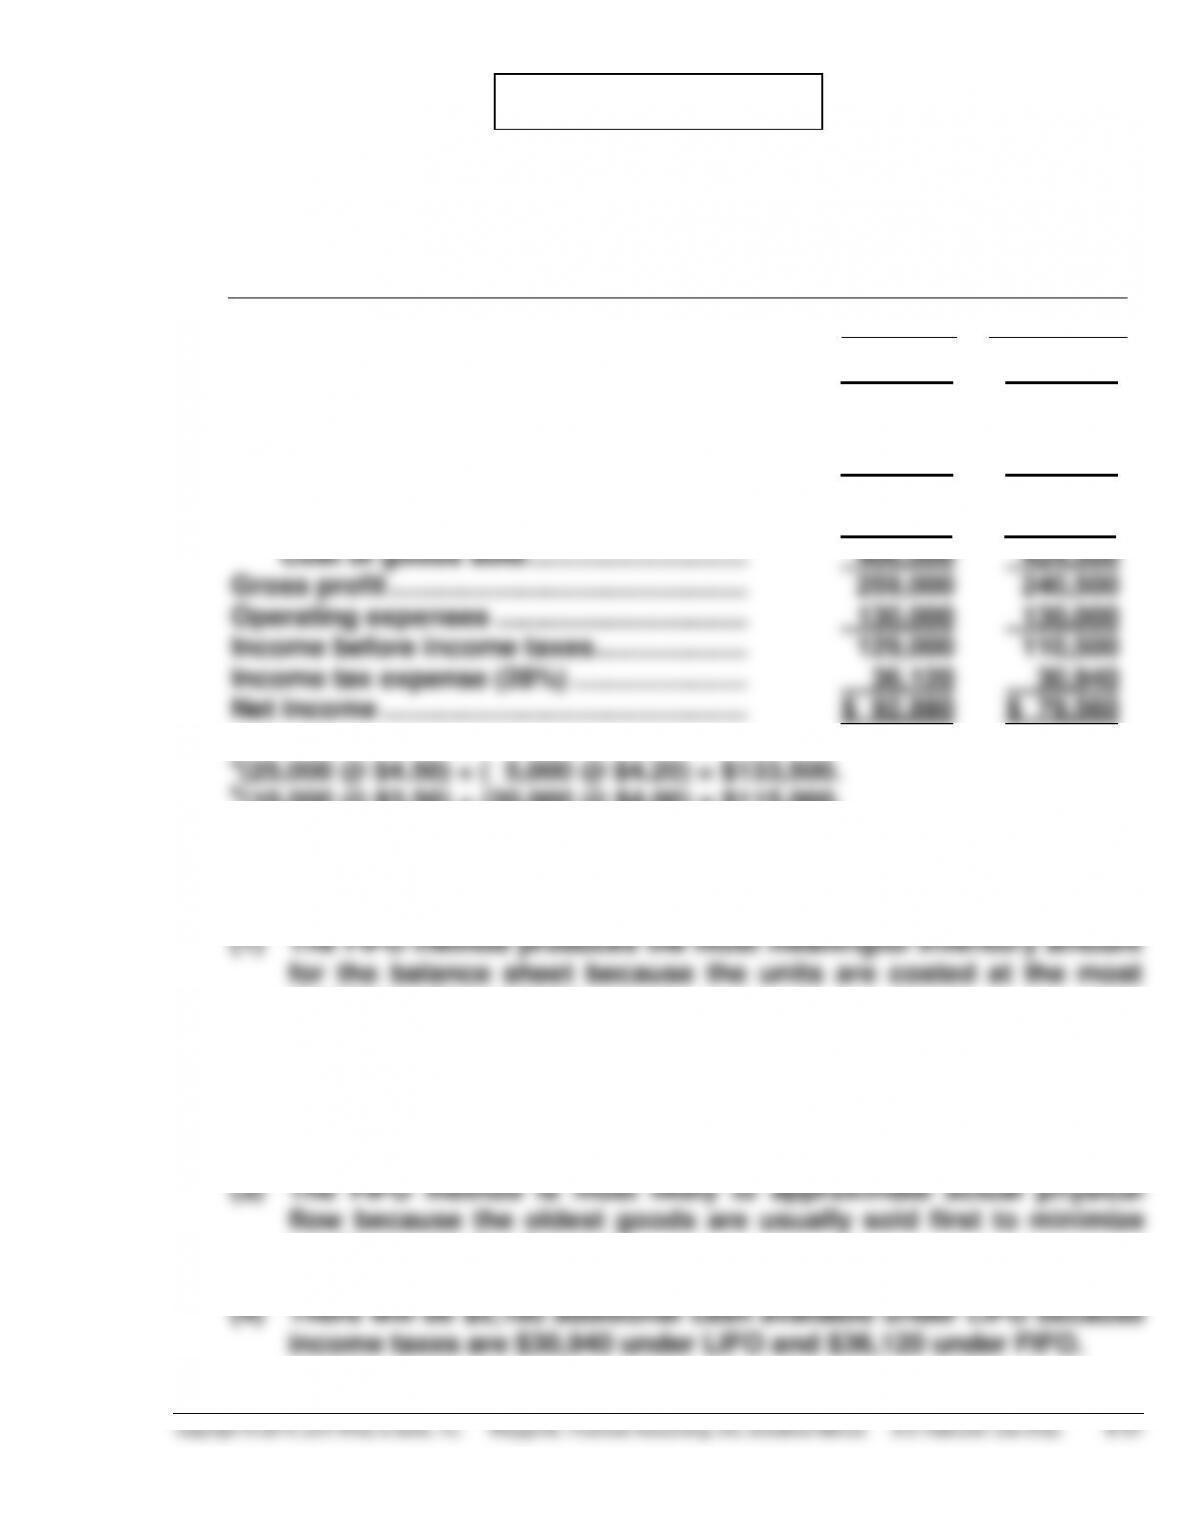
(a) Chelsea INC.
Condensed Income Statement
For the Year Ended December 31, 2015
FIFO
LIFO
Sales revenue ……………………………………. $665,000 $665,000
Cost of goods sold
Beginning inventory……………………… 35,000 35,000
Cost of goods purchased ……………… 504,500 504,500
Cost of goods available for sale ……. 539,500 539,500
Ending inventory ………………………….. 133,500a 115,000b
(b) Answers to questions:
recent purchase prices.
(2) The LIFO method produces the most meaningful net income because
the costs of the most recent purchases are matched against
sales.
spoilage and obsolescence.
PROBLEM 6-7B (Continued)
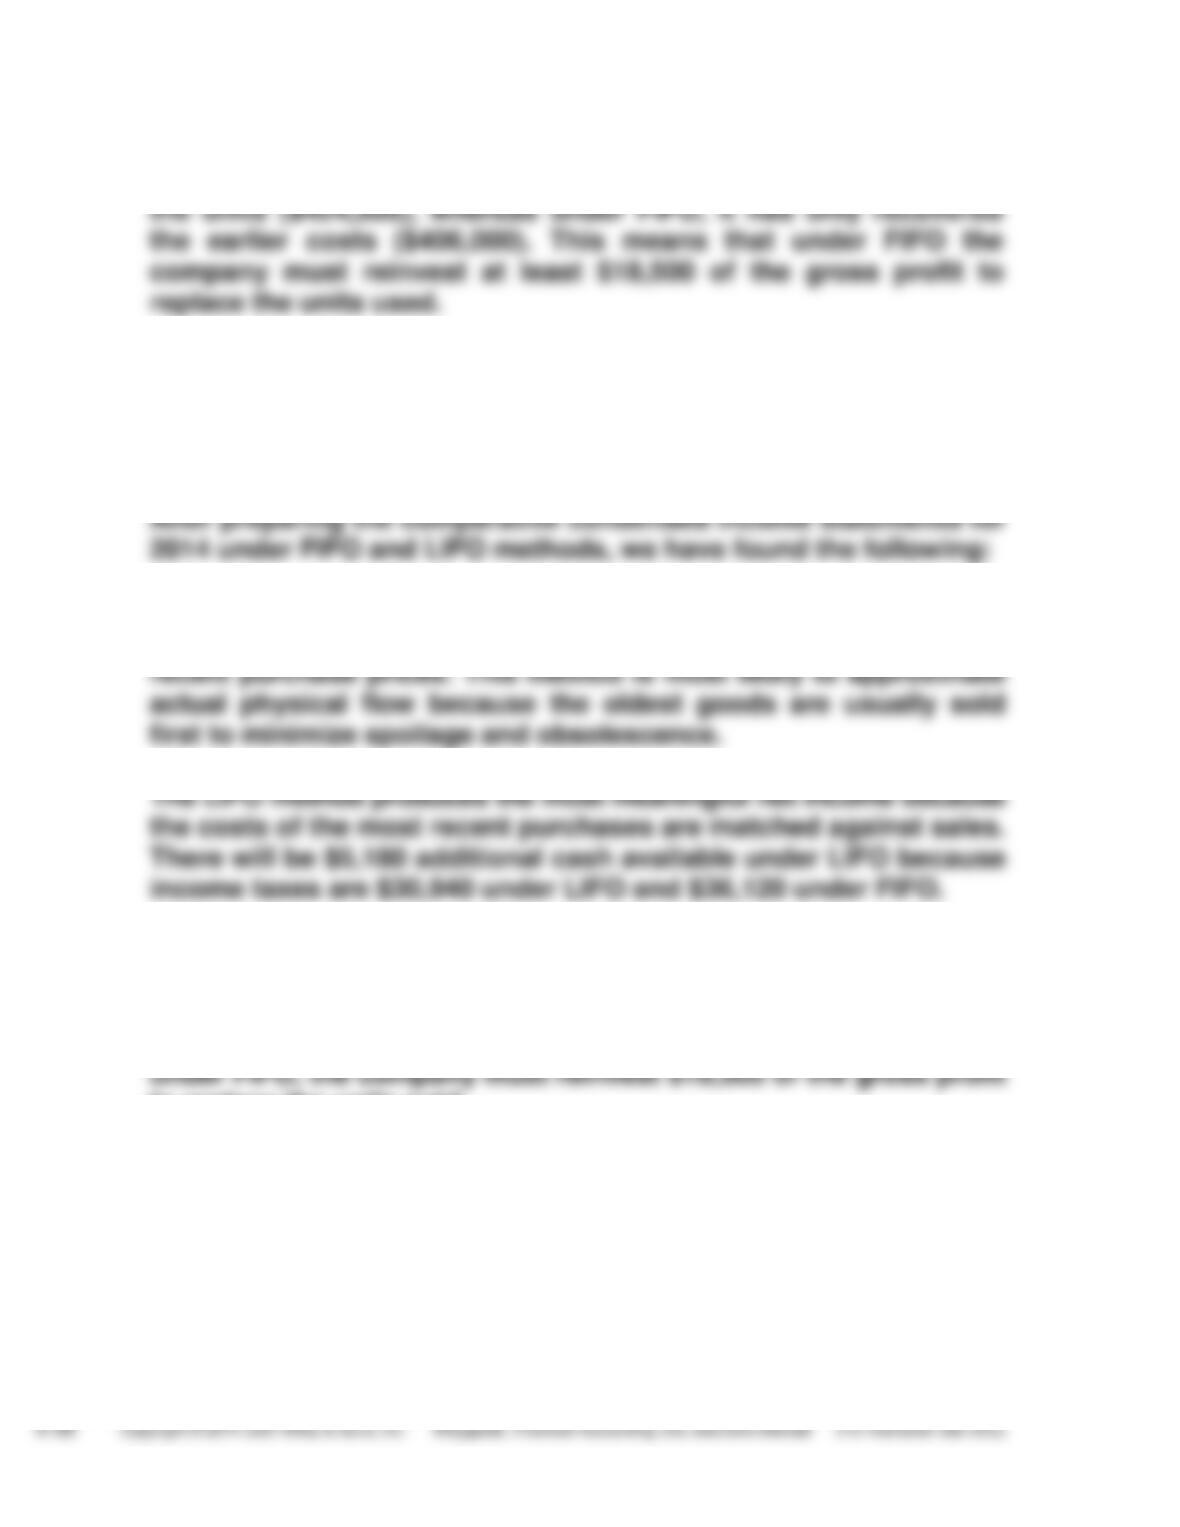
(5) The illusionary gross profit is $18,500 or ($259,000 – $240,500). Under
LIFO, Chelsea Inc. has recovered the current replacement cost of
Answer in business letter form:
Dear Chelsea Inc.
The FIFO method produces the most meaningful inventory amount
for the balance sheet because the units are costed at the most
There exists an illusionary gross profit of $18,500 ($259,000 –
$240,500) under FIFO. Under LIFO, you have recovered the current
replacement cost of the units ($424,500) whereas under FIFO you
have only recovered the earlier costs ($406,000). This means that
to replace the units sold.
Sincerely,
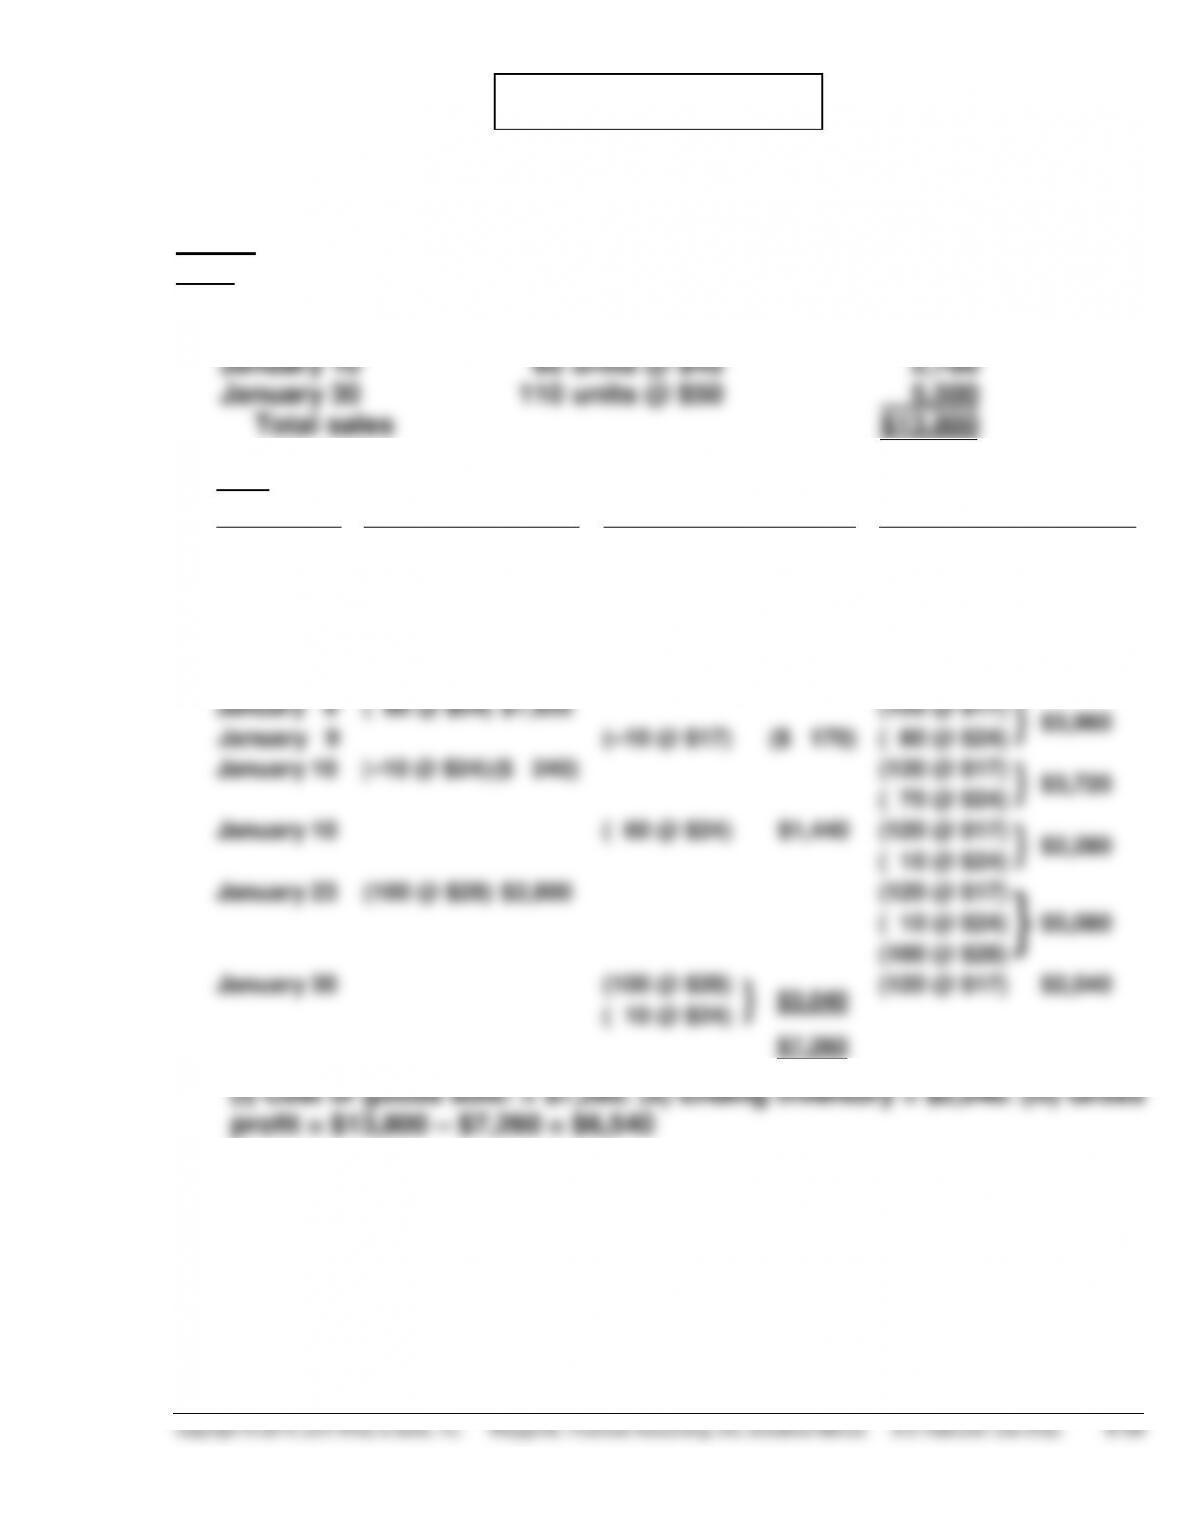
*PROBLEM 6-8B
(a)
Sales:
Date
January 6
150 units @ $40
$ 6,000
January 9 (return)
(10 units @ $40)
(400)
January 10
60 units @ $45
2,700
January 30
110 units @ $50
5,500
Total sales
$13,800
(1)
LIFO
Date
Purchases
Cost of Goods Sold
Balance
January 1
(160 @ $17)
$2,720
(160 @ $17)
}
$4,820
January 2
(100 @ $21) $2,100
(100 @ $21)
January 6
(100 @ $21)
}
$2,950
(110 @ $17)
$1,870
( 50 @ $17)
January 9
( 80 @ $24) $1,920
(120 @ $17)
}
$3,960
January 9
(–10 @ $17) ($ 170)
( 80 @ $24)
January 10
(–10 @ $24) ($ 240)
(120 @ $17)
}
$3,720
( 70 @ $24)
January 10
( 60 @ $24) $1,440
(120 @ $17)
}
$2,280
( 10 @ $24)
January 23
(100 @ $28) $2,800
(120 @ $17)
}
( 10 @ $24)
$5,080
(100 @ $28)
January 30
(100 @ $28)
}
$3,040
(120 @ $17)
$2,040
( 10 @ $24)
$7,260
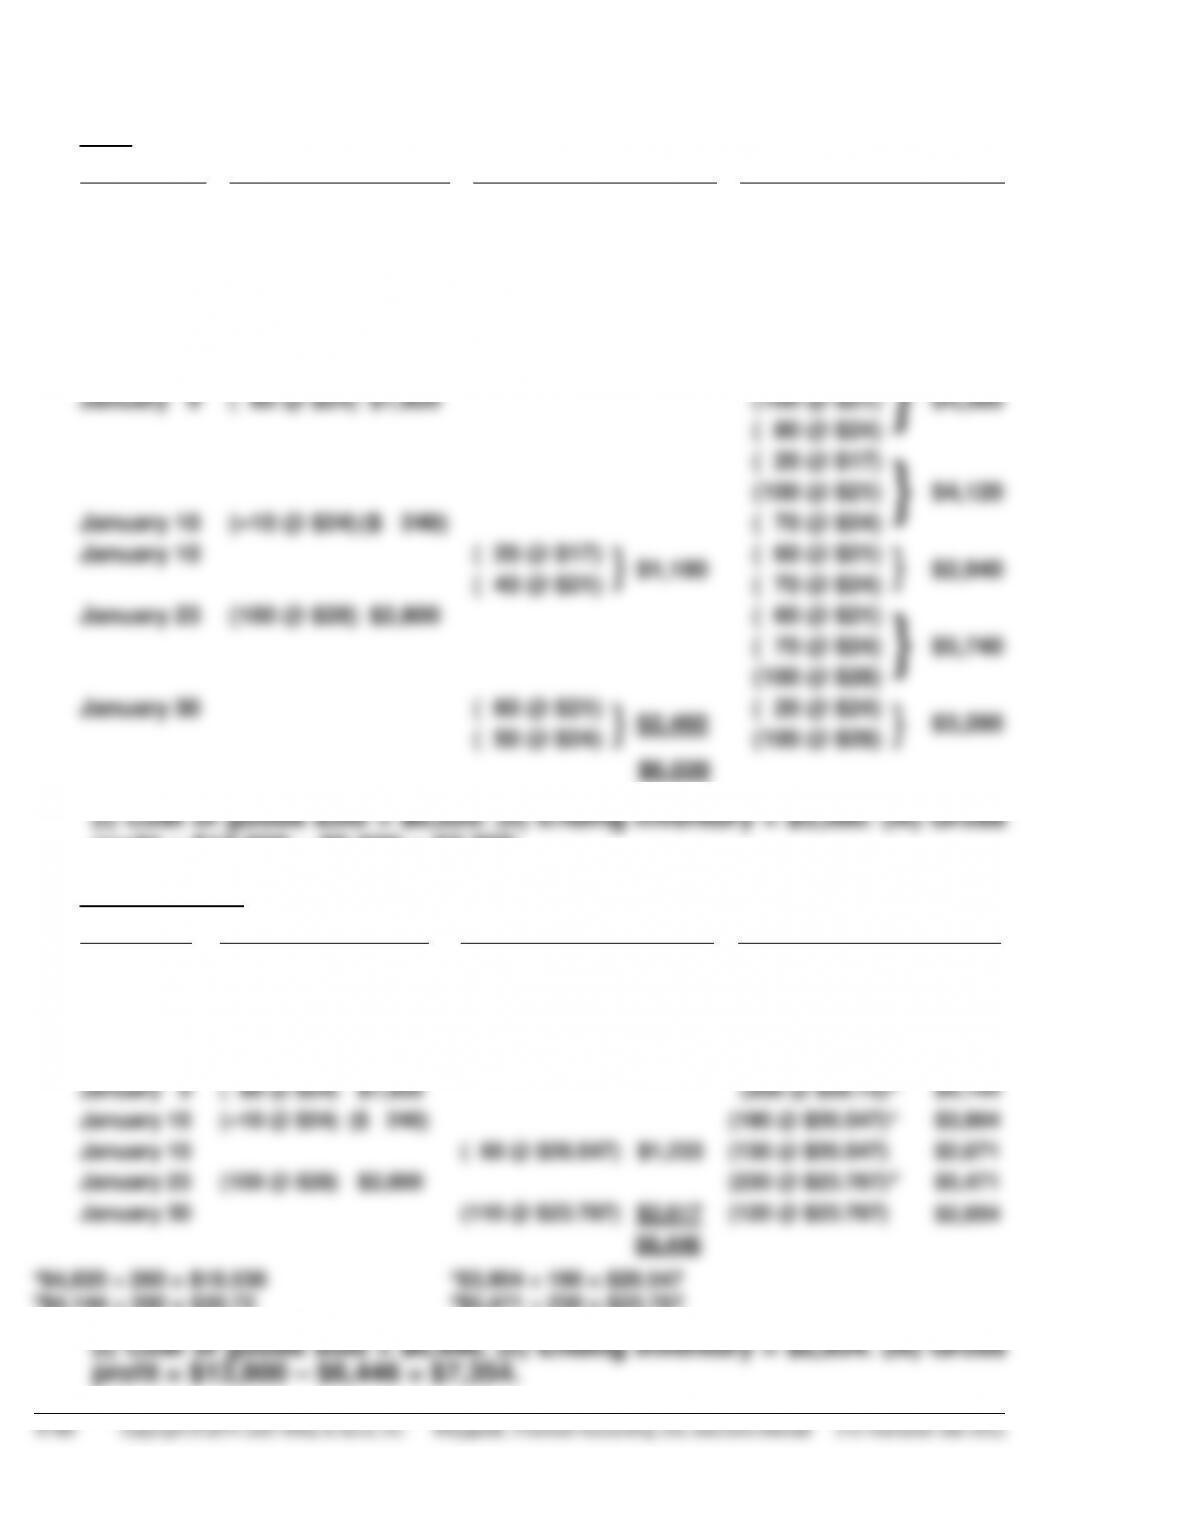
*PROBLEM 6-8B (Continued)
(2)
FIFO
Date
Purchases
Cost of Goods Sold
Balance
January 1
(160 @ $17)
$2,720
(160 @ $17)
}
$4,820
January 2
(100 @ $21) $2,100
(100 @ $21)
January 6
(150 @ $17)
$2,550
( 10 @ $17)
(100 @ $21)
}
$2,270
January 9
(–10 @ $17)
($ 170)
( 20 @ $17)
}
$4,360
January 9
( 80 @ $24) $1,920
(100 @ $21)
( 80 @ $24)
( 20 @ $17)
}
$4,120
(100 @ $21)
January 10
(–10 @ $24) ($ 240)
( 70 @ $24)
January 10
( 20 @ $17)
}
$1,180
( 60 @ $21)
}
$2,940
( 40 @ $21)
( 70 @ $24)
January 23
(100 @ $28) $2,800
( 60 @ $21)
}
$5,740
( 70 @ $24)
(100 @ $28)
January 30
( 60 @ $21)
}
$2,460
( 20 @ $24)
}
$3,280
( 50 @ $24)
(100 @ $28)
$6,020
profit = $13,800 – $6,020 = $7,780.
(3)
Moving-Average
Date
Purchases
Cost of goods sold
Balance
January 1
(160 @ $17)
$2,720
January 2
(100 @ $21) $2,100
(260 @ $18.538)a
$4,820
January 6
(150 @ $18.538)
$2,781
(110 @ $18.538)
$2,039
January 9
(–10 @ $18.538)
($ 185)
(120 @ $18.538)
$2,224
January 9
( 80 @ $24) $1,920
(200 @ $20.72)
b
$4,144
January 10
(–10 @ $24) ($ 240)
(190 @ $20.547)
c
$3,904
January 10
( 60 @ $20.547)
$1,233
(130 @ $20.547)
$2,671
January 23
(100 @ $28) $2,800
(230 @ $23.787)
d
$5,471
January 30
(110 @ $23.787)
$2,617
(120 @ $23.787)
$2,854
$6,446
a$4,820 ÷ 260 = $18.538 c$3,904 ÷ 190 = $20.547
b$4,144 ÷ 200 = $20.72 d$5,471 ÷ 230 = $23.787