*PROBLEM 6-8A
(a)
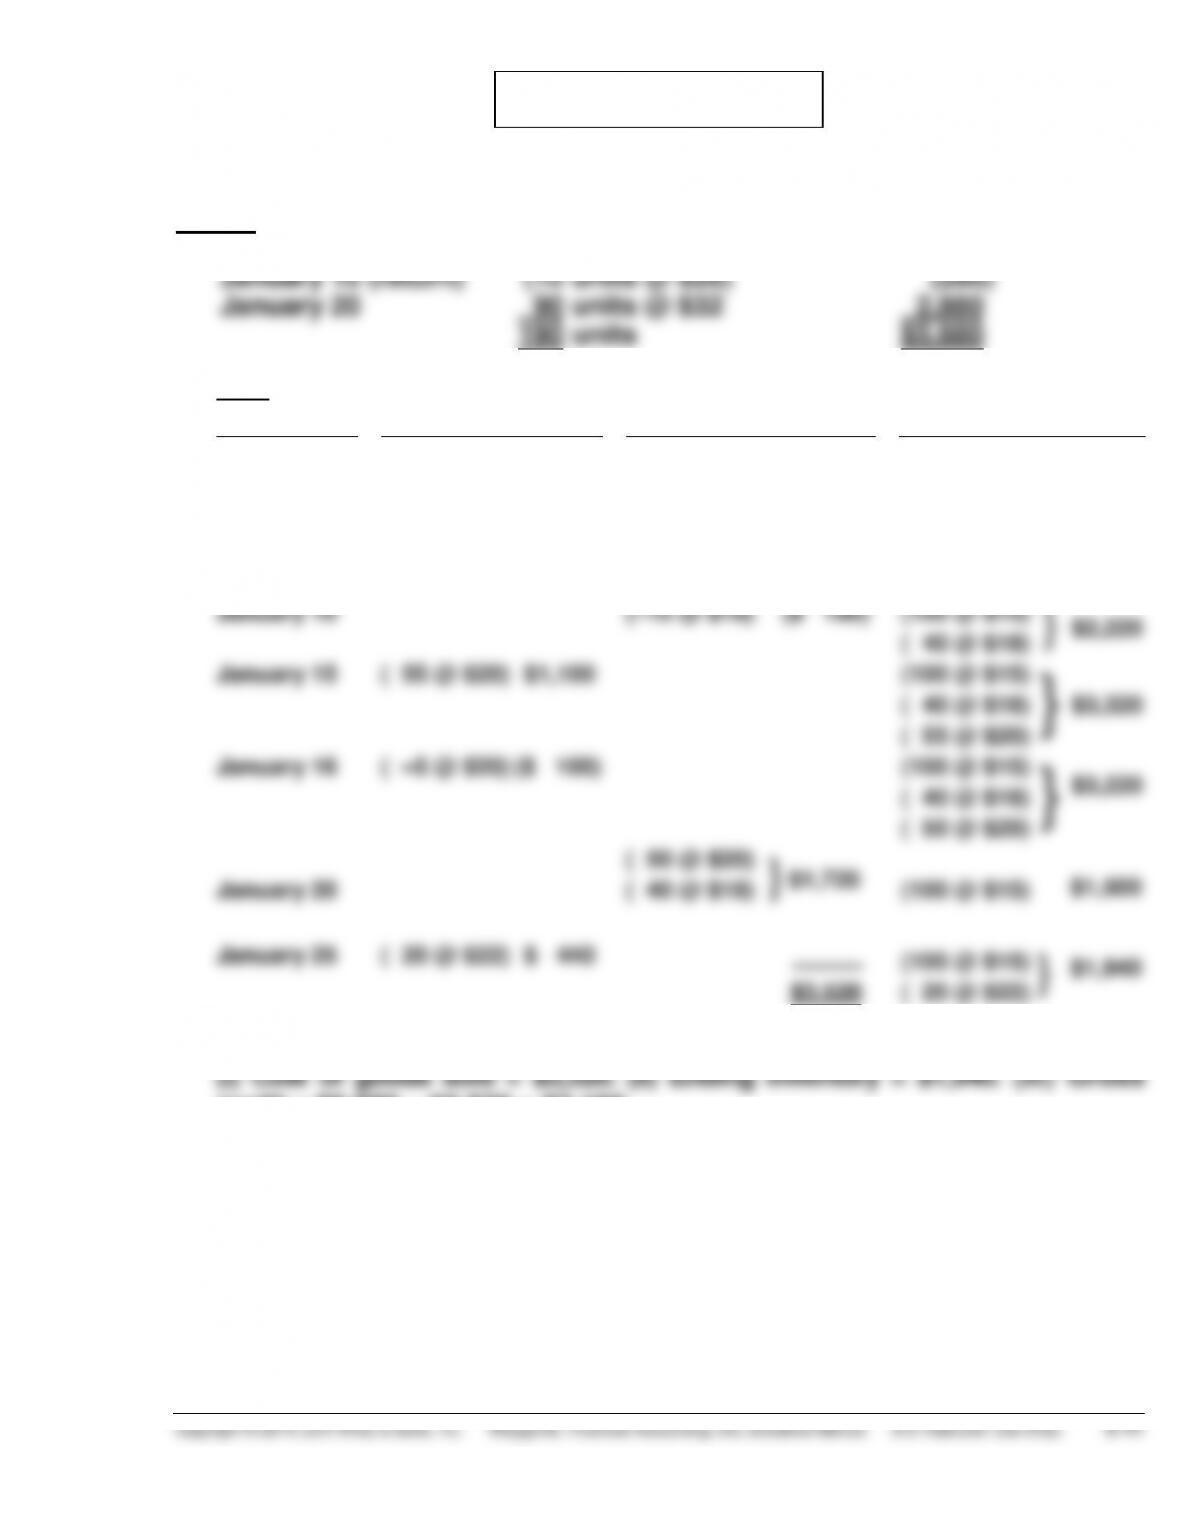
Sales:
January 8
110 units @ $28
$3,080
January 10 (return)
(10 units @ $28)
(280)
January 20
90 units @ $32
2,880
190 units
$5,680
(1)
LIFO
Date
Purchases
Cost of Goods Sold
Balance
January 1
(100 @ $15)
$1,500
January 5
(140 @ $18) $2,520
(100 @ $15)
}
$4,020
(140 @ $18)
January 8
(110 @ $18) $1,980
(100 @ $15)
}
$2,040
( 30 @ $18)
January 10
(–10 @ $18) ($ 180)
(100 @ $15)
}
$2,220
( 40 @ $18)
January 15
( 55 @ $20) $1,100
(100 @ $15)
}
$3,320
( 40 @ $18)
( 55 @ $20)
January 16
( –5 @ $20) ($ 100)
(100 @ $15)
}
$3,220
( 40 @ $18)
( 50 @ $20)
( 50 @ $20)
}
$1,720
January 20
( 40 @ $18)
(100 @ $15)
}
January 25
( 20 @ $22) $ 440
(100 @ $15)
}
$3,520
( 20 @ $22)
$1,500
$1,940
*PROBLEM 6-8A (Continued)
(2)
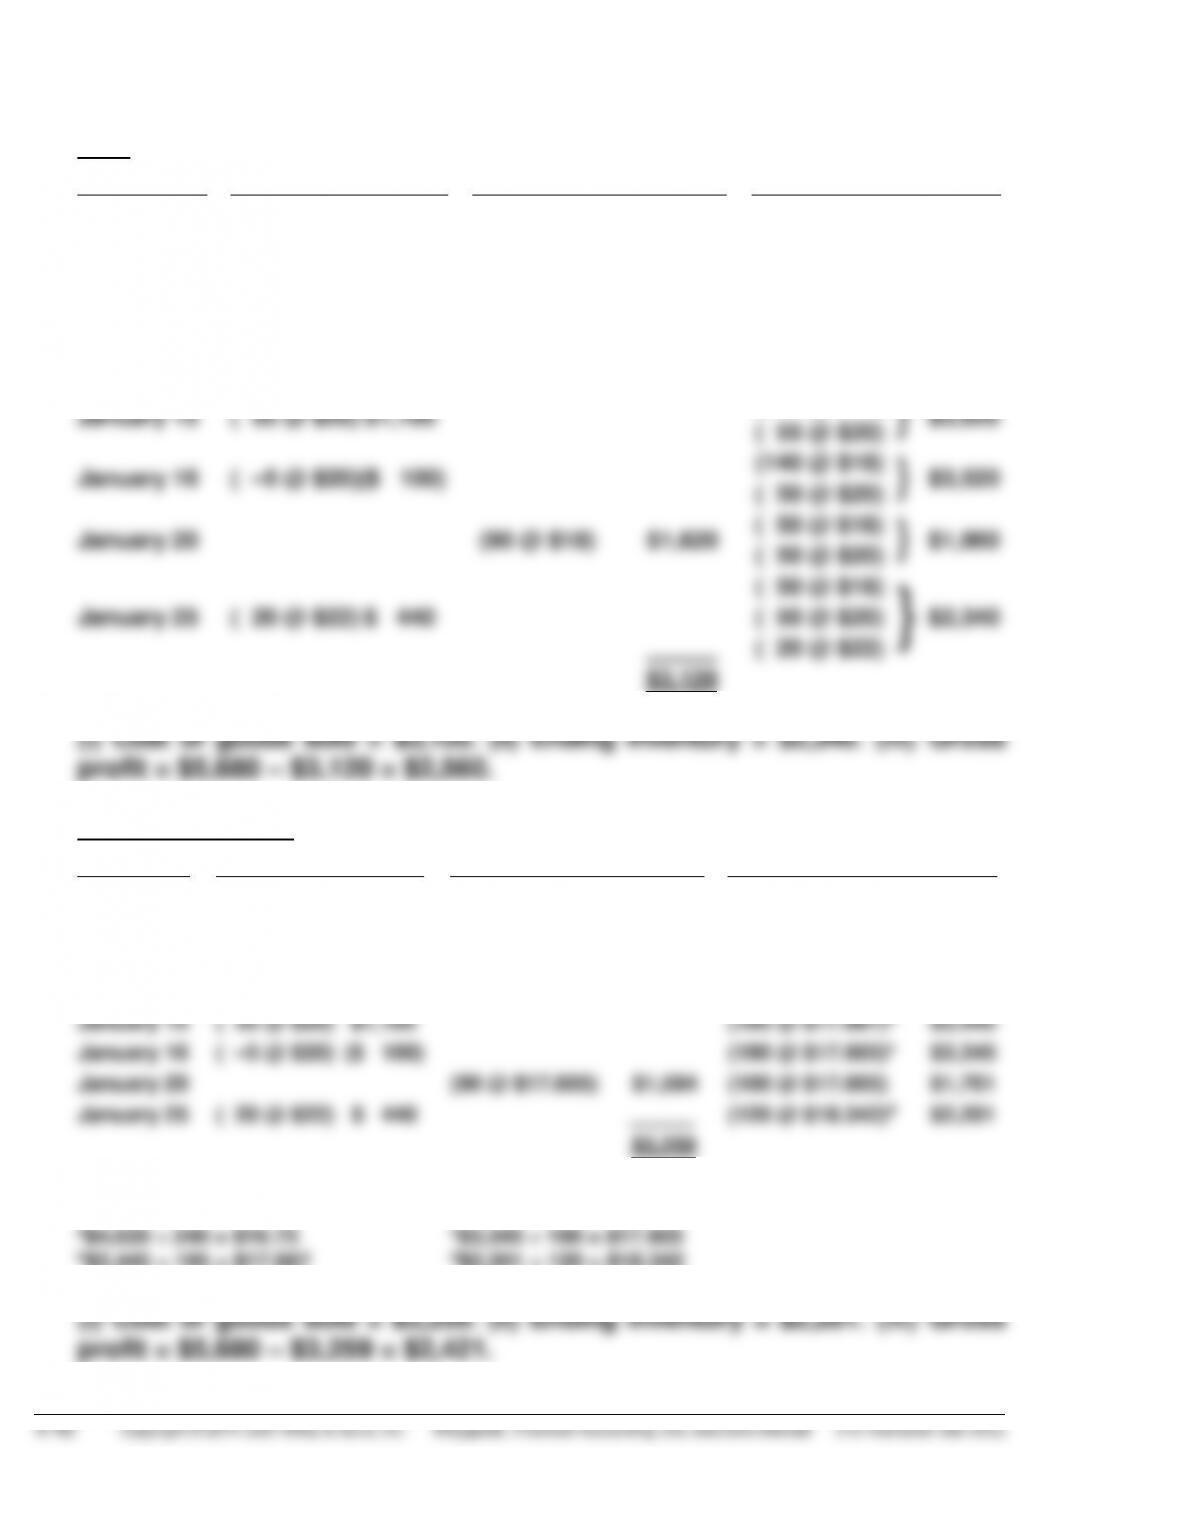
FIFO
Date
Purchases
Cost of Goods Sold
Balance
January 1
(100 @ $15)
$1,500
January 5
(140 @ $18) $2,520
(100 @ $15)
}
$4,020
(140 @ $18)
January 8
(100 @ $15)
}
$1,680
(130 @ $18)
$2,340
( 10@ $18)
January 10
(–10 @ $18) ($ 180)
(140 @ $18)
$2,520
January 15
( 55 @ $20) $1,100
(140 @ $18)
}
$3,620
( 55 @ $20)
January 16
( –5 @ $20)($ 100)
(140 @ $18)
}
$3,520
( 50 @ $20)
January 20
(90 @ $18)
$1,620
( 50 @ $18)
( 50 @ $20)
}
$1,900
January 25
( 20 @ $22) $ 440
( 50 @ $18)
( 50 @ $20)
}
$2,340
( 20 @ $22)
$3,120
(3)
Moving-Average Cost
Date
Purchases
Cost of Goods Sold
Balance
January 1
(100 @ $15)
$1,500
January 5
(140 @ $18) $2,520
(240 @ $16.75)a
$4,020
January 8
(110 @ $16.75)
$1,843
(130 @ $16.75)
$2,177
January 10
(–10 @ $16.75)
($ 168)
(140 @ $16.75)
$2,345
January 15
( 55 @ $20) $1,100
(195 @ $17.667)b
$3,445
January 16
( –5 @ $20) ($ 100)
(190 @ $17.605)c
$3,345
January 20
(90 @ $17.605)
$1,584
(100 @ $17.605)
$1,761
January 25
( 20 @ $22) $ 440
(120 @ $18.342)d
$2,201
$3,259
*rounded
*PROBLEM 6-8A (Continued)
(b)
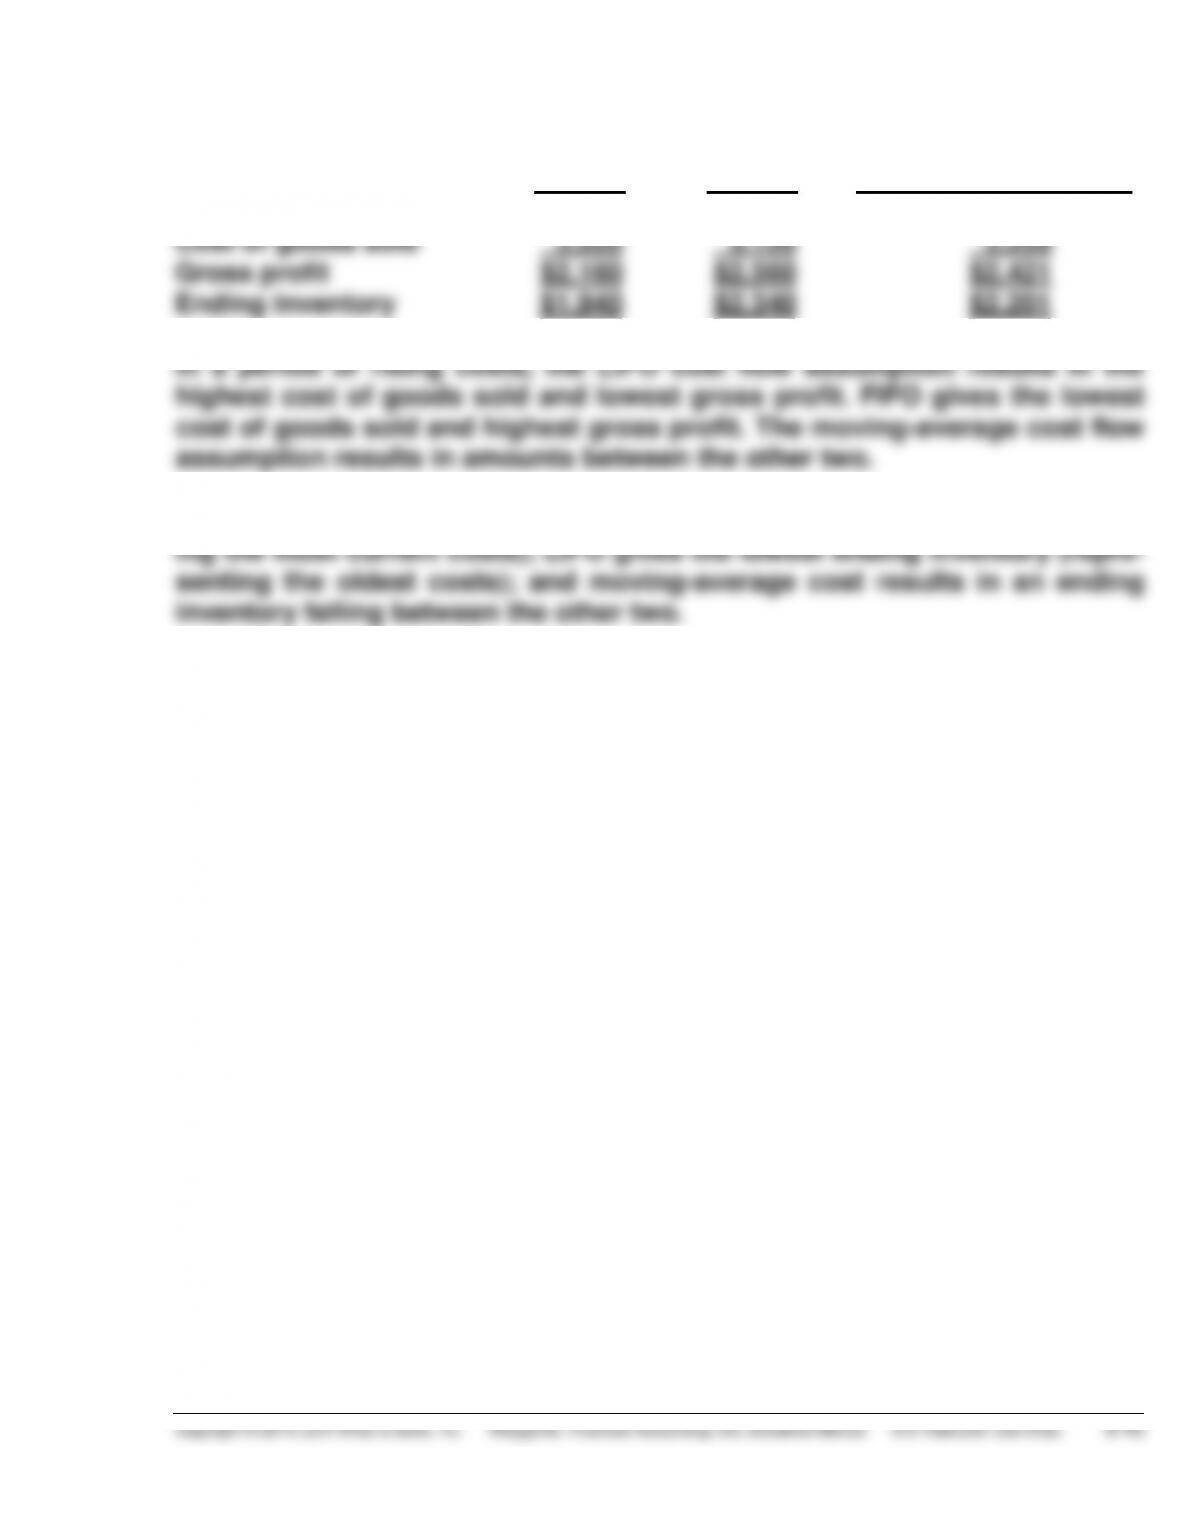
Gross profit:
LIFO
FIFO
Moving-Average Cost
Sales
$5,680
$5,680
$5,680
Cost of goods sold
3,520
3,120
3,259
Gross profit
$2,160
$2,560
$2,421
Ending inventory
$1,940
$2,340
$2,201
On the balance sheet, FIFO gives the highest ending inventory (represent-
*PROBLEM 6-9A
(a)
(1)
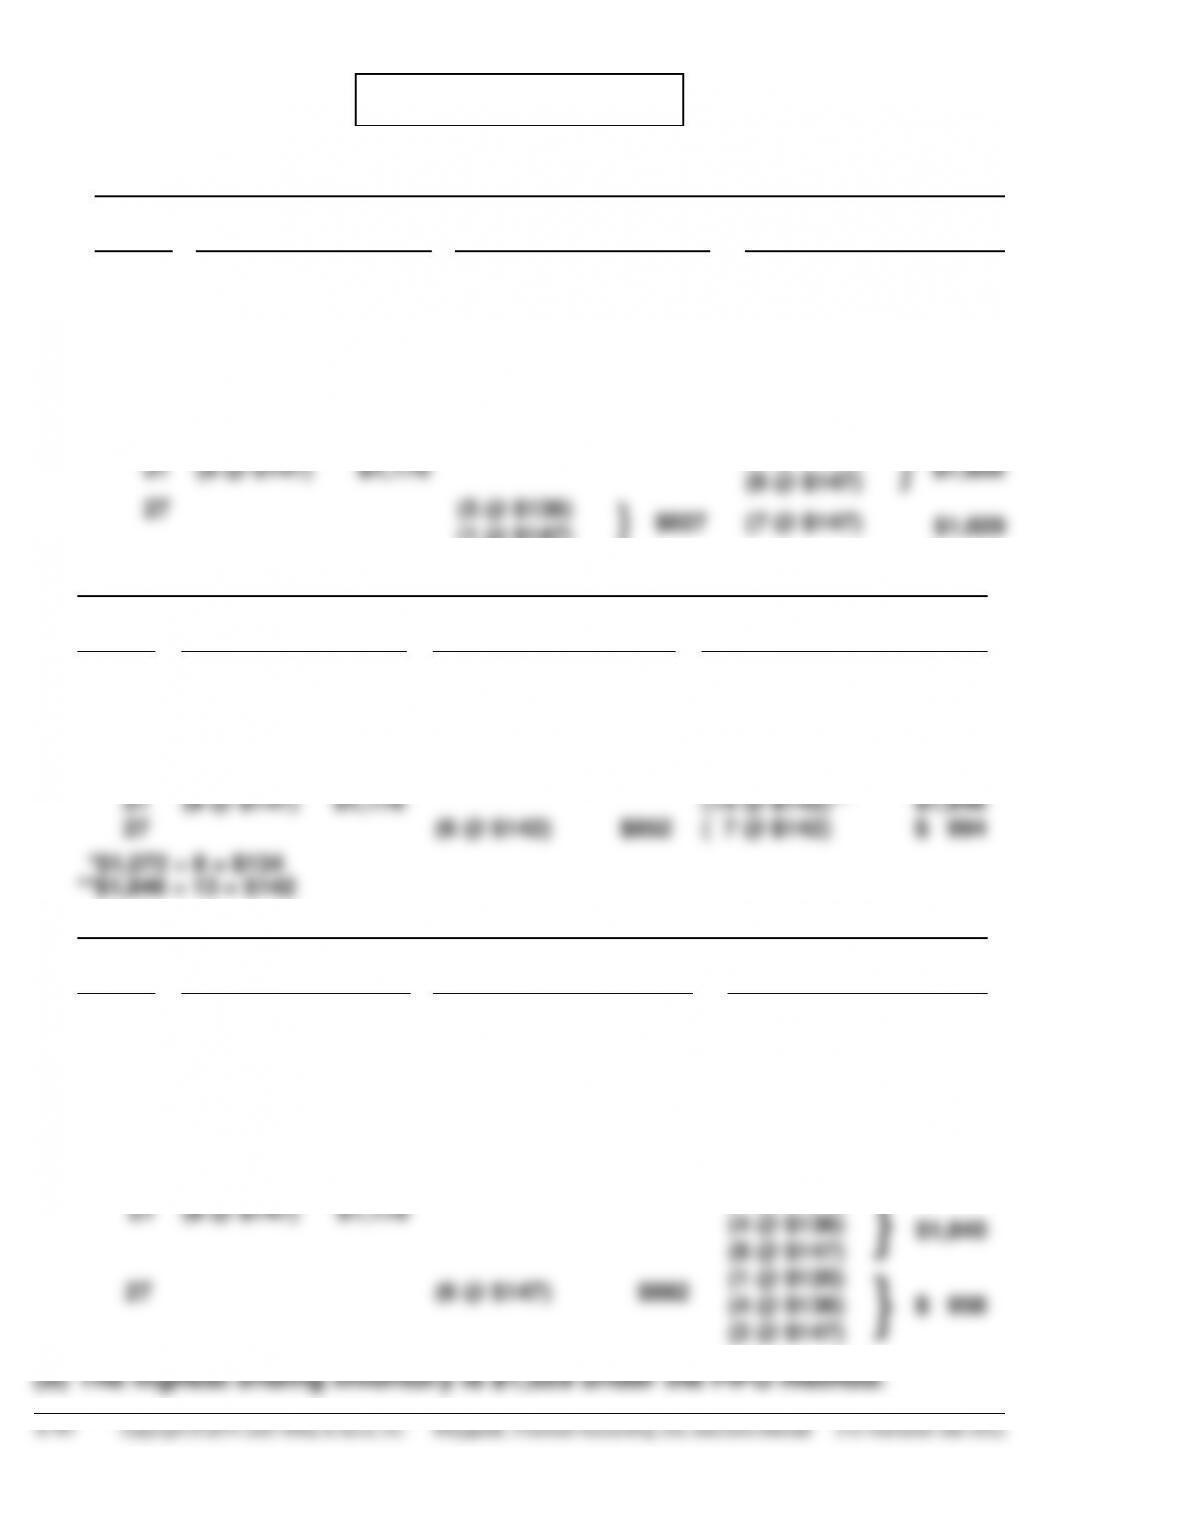
FIFO
Date
Purchases
Cost of Goods Sold
Balance
July 1
(5 @ $120)
$ 600
(5 @ $120)
$ 600
6
(4 @ $120)
$480
(1 @ $120)
$ 120
11
(7 @ $136)
$ 952
(1 @ $120)
}
$1,072
(7 @ $136)
14
(1 @ $120)
}
$392
(2 @ $136)
(5 @ $136)
$ 680
21
(8 @ $147)
$1,176
(5 @ $136)
}
$1,856
(8 @ $147)
27
(5 @ $136)
(1 @ $147)
}
$827
(7 @ $147)
$1,029
(2)
MOVING-AVERAGE COST
Date
Purchases
Cost of Goods Sold
Balance
July 1
(5 @ $120)
$ 600
( 5 @ $120)
$ 600
6
(4 @ $120)
$480
( 1 @ $120)
$ 120
11
(7 @ $136)
$ 952
( 8 @ $134)*
$1,072
14
(3 @ $134)
$402
( 5 @ $134)
$ 670
21
(8 @ $147)
$1,176
(13 @ $142)**
$1,846
27
(6 @ $142)
$852
( 7 @ $142)
$ 994
*$1,072 ÷ 8 = $134
**$1,846 ÷ 13 = $142
(3)
LIFO
Date
Purchases
Cost of Goods Sold
Balance
July 1
(5 @ $120)
$ 600
(5 @ $120)
$ 600
6
(4 @ $120)
$480
(1 @ $120)
$ 120
11
(7 @ $136)
$ 952
(1 @ $120)
}
$1,072
(7 @ $136)
14
(3 @ $136)
$408
(1 @ $120)
}
$ 664
(4 @ $136)
21
(8 @ $147)
$1,176
(1 @ $120)
}
$1,840
(4 @ $136)
(8 @ $147)
27
(6 @ $147)
$882
(1 @ $120)
}
$ 958
(4 @ $136)
(2 @ $147)
*PROBLEM 6-10A
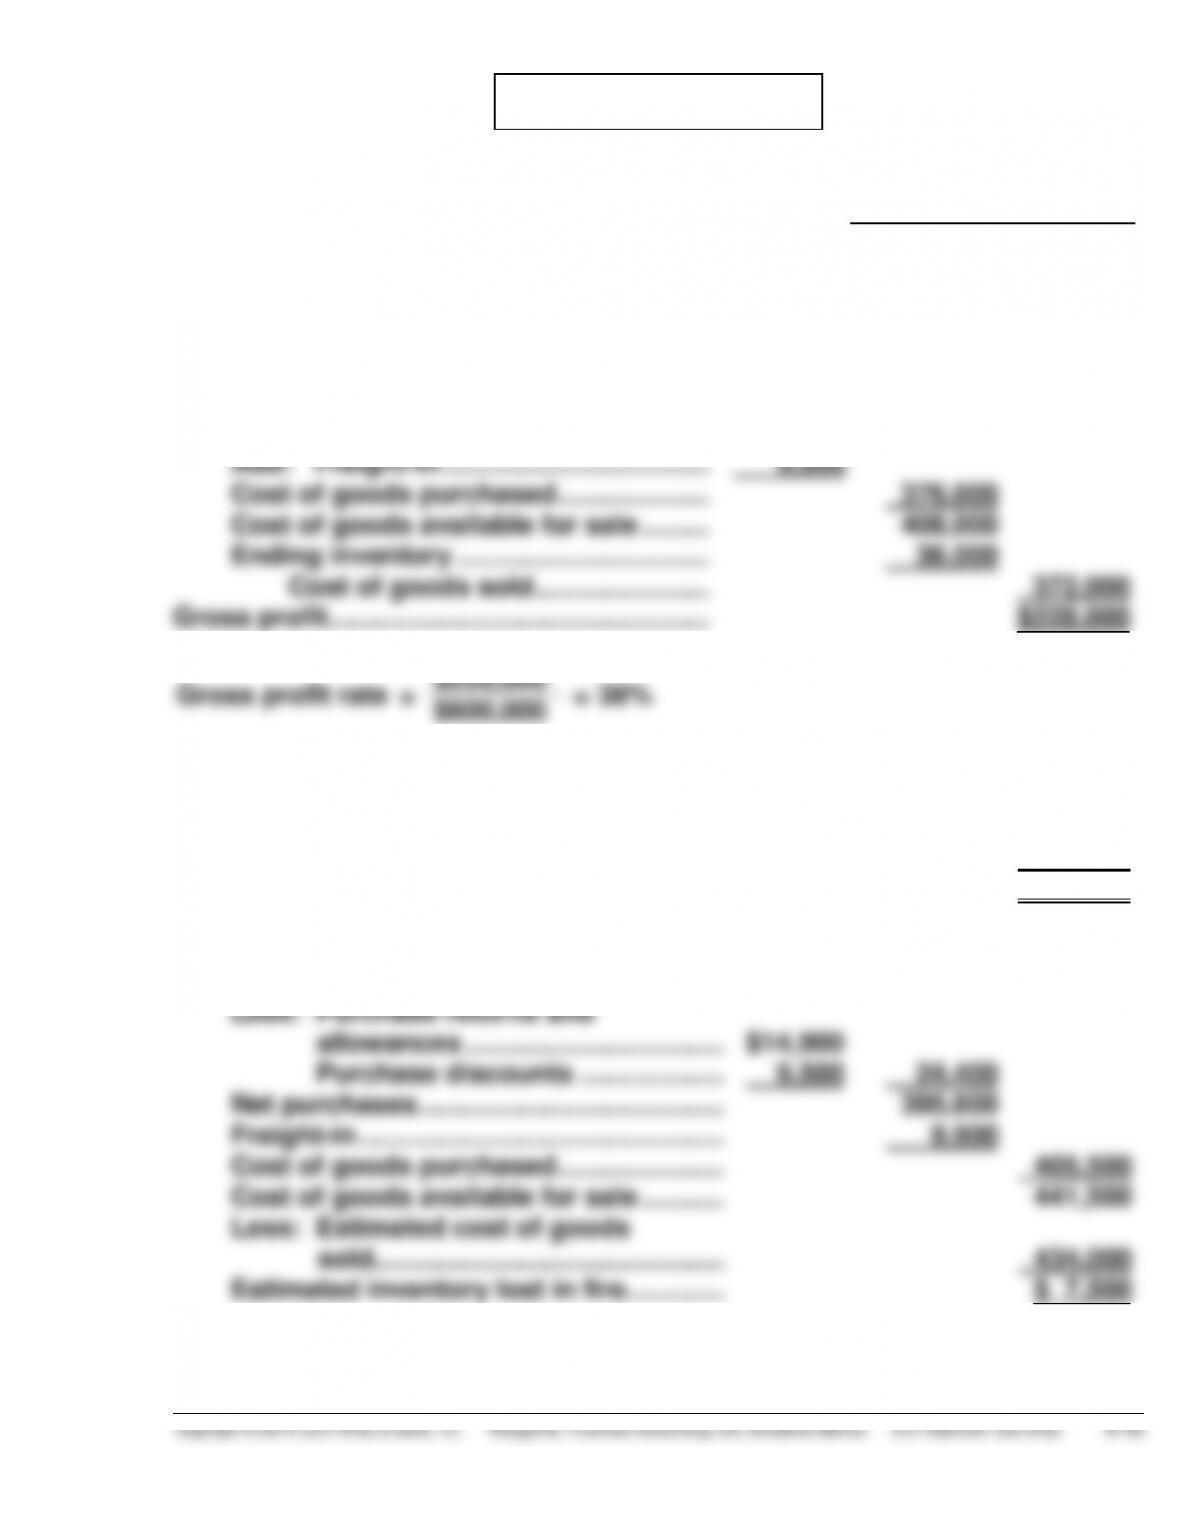
(a)
November
Net sales ……………………………………………… $600,000
Cost of goods sold
Beginning inventory ………………………. $ 32,000
Purchases …………………………..………… $389,000
Less: Purchase returns and
allowances ………………………….. 13,300
Purchase discounts …………….. 8,500
Gross profit rate
=
$228,000
=
38%
$600,000
(b) Net sales ………………………………………… $700,000
Less: Estimated gross profit
(38% X $700,000) …………………… 266,000
Estimated cost of goods sold …………… $434,000
Beginning inventory ………………………… $ 36,000
Purchases …………………………..………….. $420,000
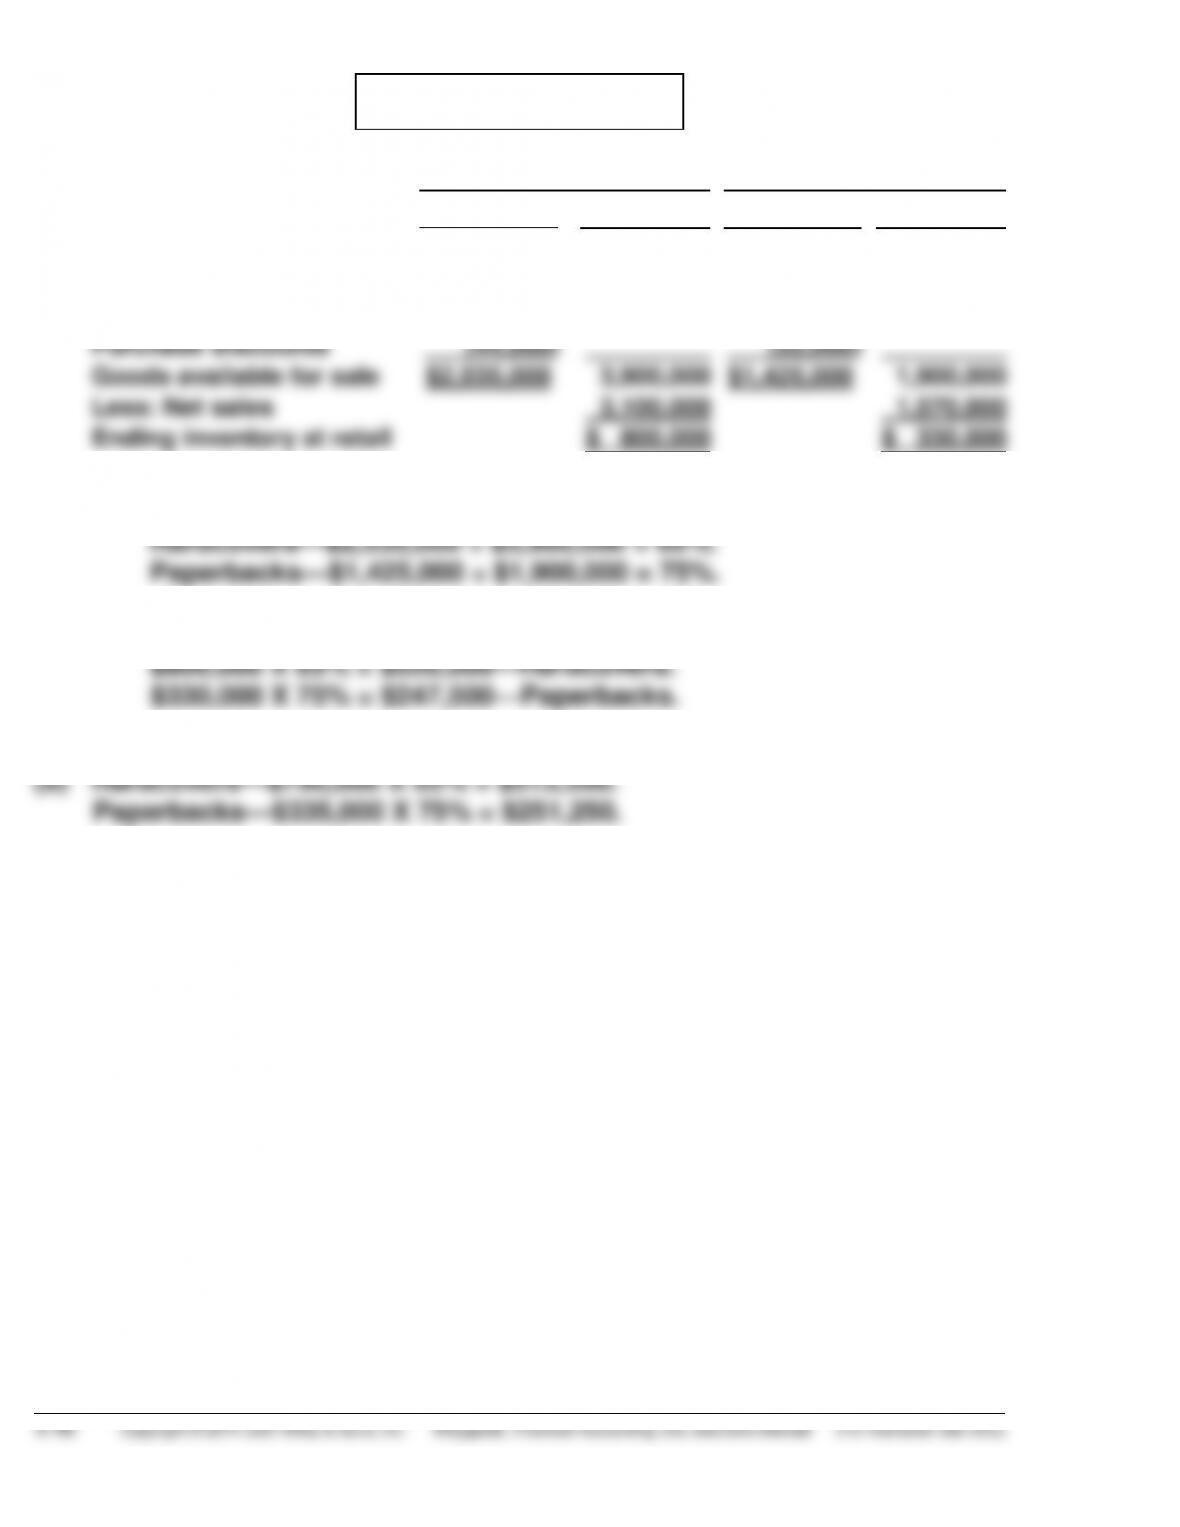
*PROBLEM 6-11A
(a)
Hardcovers
Paperbacks
Cost
Retail
Cost
Retail
Beginning inventory
$ 420,000
$ 700,000
$ 280,000
$ 360,000
Purchases
2,135,000
3,200,000
1,155,000
1,540,000
Freight–in
24,000
12,000
Purchase discounts
(44,000)
(22,000)
Goods available for sale
$2,535,000
3,900,000
$1,425,000
1,900,000
Less: Net sales
3,100,000
1,570,000
Ending inventory at retail
$ 800,000
$ 330,000
Cost-to-retail ratio:
Estimated ending inventory at cost:
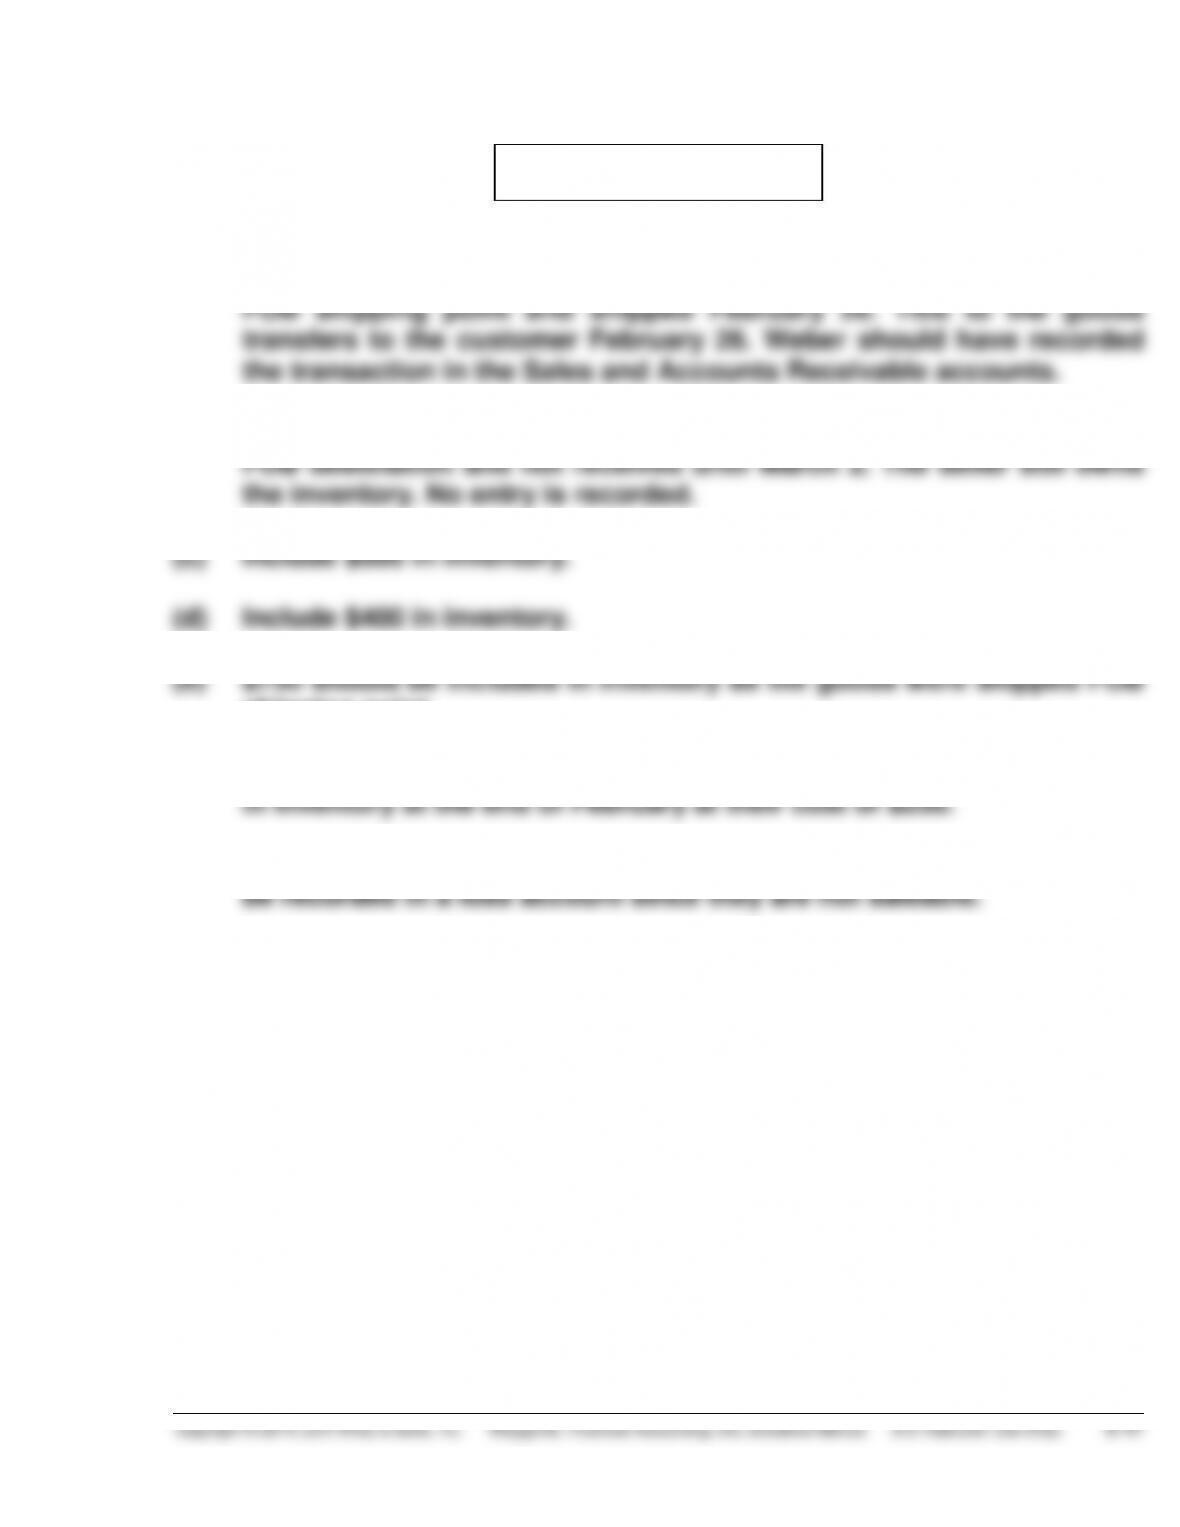
SOLUTIONS TO PROBLEMS
PROBLEM 6-1B
(a) The goods should not be included in inventory as they were shipped
(b) The amount should not be included in inventory as they were shipped
shipping point.
(f) The sale will be recorded on March 2. The goods should be included
(g) The damaged goods should not be included in inventory. They should

PROBLEM 6-2B
(a)
COST OF GOODS AVAILABLE FOR SALE
Date
Explanation
Units
Unit Cost
Total Cost
March 1
Beginning Inventory
1,500
$ 7
$ 10,500
5
Purchase
3,000
8
24,000
13
Purchase
4,500
9
40,500
21
Purchase
4,000
10
40,000
26
Purchase
2,500
11
27,500
Total
15,500
$142,500
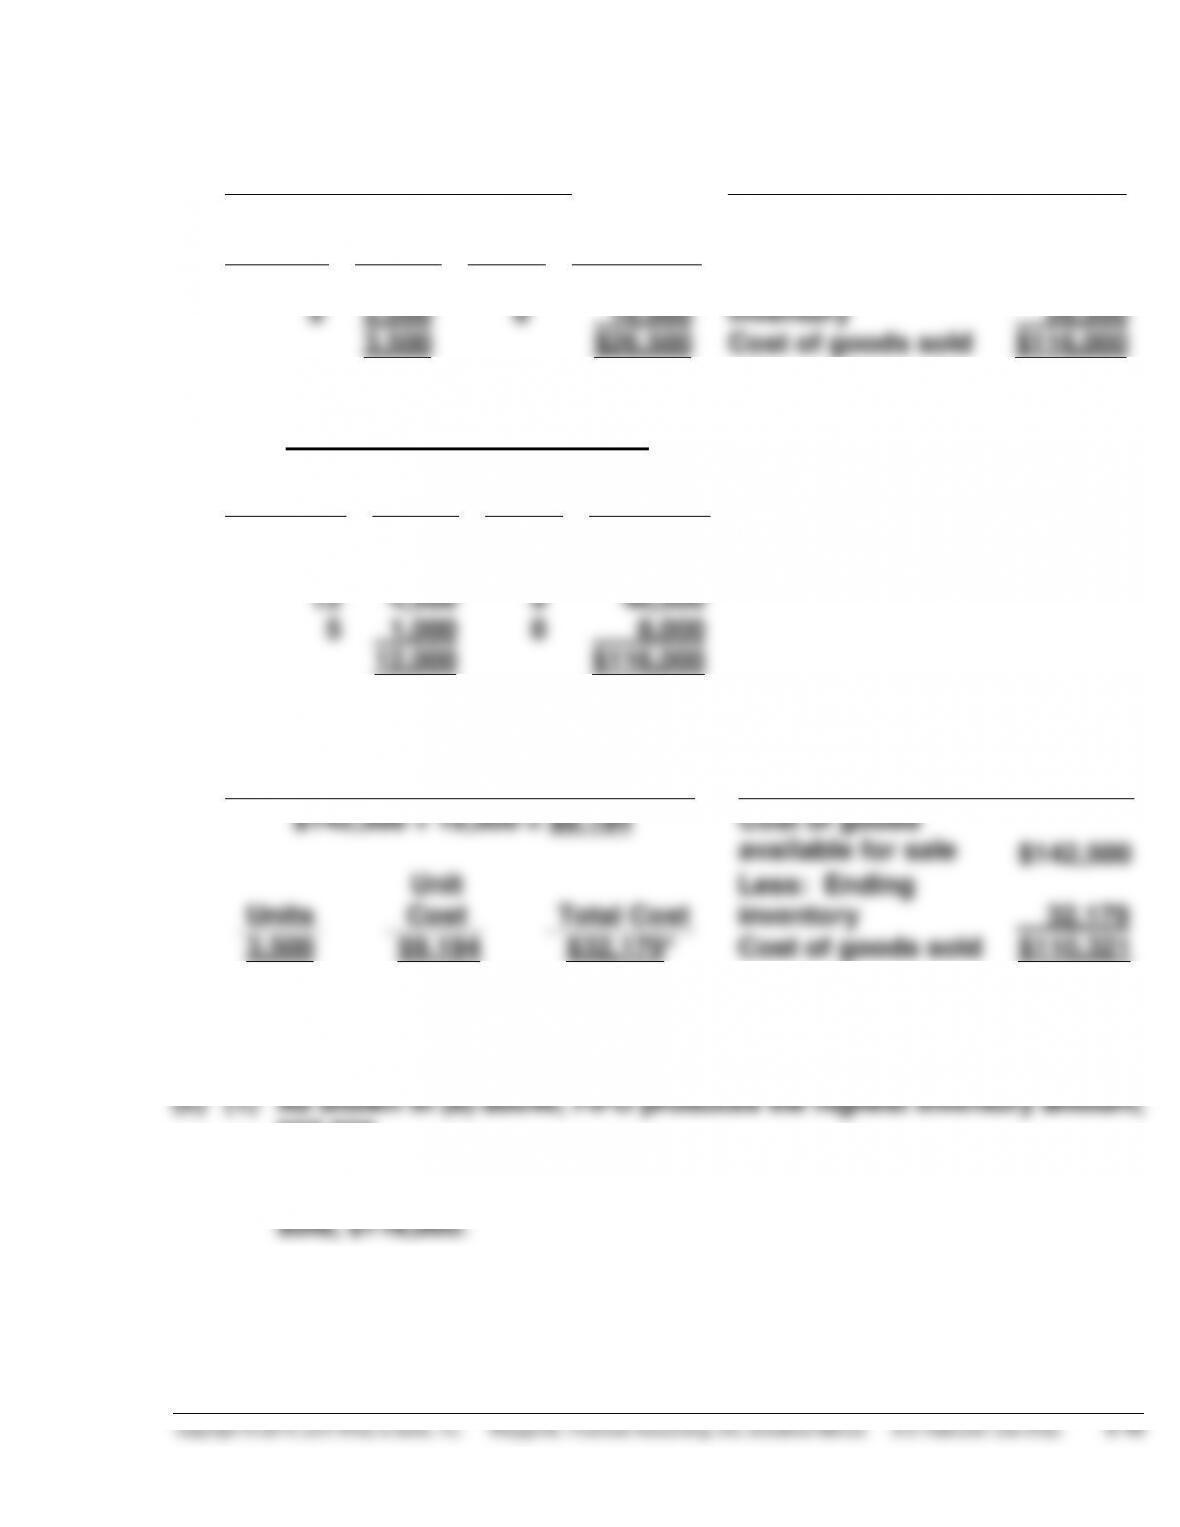
(b)
FIFO
(1)
Ending Inventory
(2)
Cost of Goods Sold
Date
Units
Unit
Cost
Total
Cost
Cost of goods
available for sale
$142,500
March 26
2,500
$11
$27,500
Less: Ending
inventory
37,500
21
1,000
10
10,000
3,500*
$37,500
Cost of goods sold
$105,000
Proof of Cost of Goods Sold
Date
Units
Unit
Cost
Total
Cost
March 1
1,500
$ 7
$ 10,500
5
3,000
8
24,000
13
4,500
9
40,500
21
3,000
10
30,000
12,000
$105,000
PROBLEM 6-2B (Continued)
LIFO
(1)
Ending Inventory
(2)
Cost of Goods Sold
Date
Units
Unit
Cost
Total
Cost
Cost of goods
available for sale
$142,500
March 1
1,500
$7
$10,500
Less: Ending
inventory
26,500
5
2,000
8
16,000
3,500
$26,500
Cost of goods sold
$116,000
Proof of Cost of Goods Sold
Date
Units
Unit
Cost
Total
Cost
March 26
2,500
$11
$27,500
21
4,000
10
40,000
13
4,500
9
40,500
5
1,000
8
8,000
12,000
$116,000
AVERAGE-COST
(1)
Ending Inventory
(2)
Cost of Goods Sold
$142,500 ÷ 15,500 = $9.194
Cost of goods
available for sale
$142,500
Units
Unit
Cost
Total Cost
Less: Ending
inventory
32,179
3,500
$9.194
$32,179*
Cost of goods sold
$110,321
*rounded to nearest dollar
$37,500.
(2) As shown in (b) above, LIFO produces the highest cost of goods
PROBLEM 6-3B
(a)
COST OF GOODS AVAILABLE FOR SALE
Date
Explanation
Units
Unit Cost
Total Cost
1/1
Beginning Inventory
400
$ 8
$ 3,200
2/20
Purchase
600
9
5,400
5/5
Purchase
500
10
5,000
8/12
Purchase
300
11
3,300
12/8
Purchase
200
12
2,400
Total
2,000
$19,300
(b)
FIFO
(1)
Ending Inventory
(2)
Cost of Goods Sold
Date
Units
Unit
Cost
Total
Cost
Cost of goods
available for sale
$19,300
12/8
200
$12
$2,400
Less: Ending
inventory
5,700
8/12
300
11
3,300
500
$5,700
Cost of goods sold
$13,600
Proof of Cost of Goods Sold
Date
Units
Unit
Cost
Total
Cost
1/1
400
$ 8
$ 3,200
2/20
600
9
5,400
5/5
500
10
5,000
1,500
$13,600